

Artificial intelligence-based computational framework for drug-target prioritization and inference of novel repositionable drugs for Alzheimer’s disease
Open accessPublished version of a preprint
The DOI matches its Crossref record; 61 of the 62 references it cites were found in a registry or an index.
Abstract
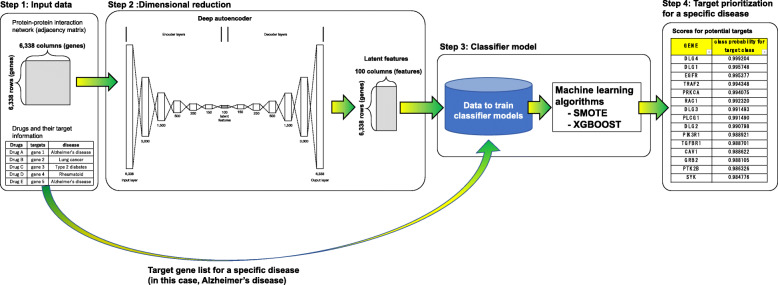
Background: Identifying novel therapeutic targets is crucial for the successful development of drugs. However, the cost to experimentally identify therapeutic targets is huge and only approximately 400 genes are targets for FDA-approved drugs. As a result, it is inevitable to develop powerful computational tools that can identify potential novel therapeutic targets. Fortunately, the human protein-protein interaction network (PIN) could be a useful resource to achieve this objective. Methods: In this study, we developed a deep learning-based computational framework that extracts low-dimensional representations of high-dimensional PIN data. Our computational framework uses latent features and state-of-the-art machine learning techniques to infer potential drug target genes. Results: We applied our computational framework to prioritize novel putative target genes for Alzheimer’s disease and successfully identified key genes that may serve as novel therapeutic targets (e.g., DLG4, EGFR, RAC1, SYK, PTK2B, SOCS1). Furthermore, based on these putative targets, we could infer repositionable candidate-compounds for the disease (e.g., tamoxifen, bosutinib, and dasatinib). Conclusions: Our deep learning-based computational framework could be a powerful tool to efficiently prioritize new therapeutic targets and enhance the drug repositioning strategy.
Overview
The claims and statistics of this paper haven’t been checked yet.
Free: it reads the open-access text and checks the first 5 claims that cite a source we can check. Create a free account to check every claim.
Integrity signals
Registry
Cites
Statistics
Figures
Verification
Claims the paper makes
The claims and statistics of this paper haven’t been checked yet.
Free: it reads the open-access text and checks the first 5 claims that cite a source we can check. Create a free account to check every claim.
Claims other papers make about this one
Each is checked against this paper’s own text: does it say what the citing paper says it does?
The source backs part of the claim, not all of it — or backs it for a different population, condition or comparison.
In the citing paper
“AI-based approaches typically require a large volume of information for training purposes [41].”
From The role of AI in drug discovery: challenges, opportunities, and strategies (2023) · cites this paper as [41]
Experimental — accuracy not yet measuredThe cited source says what the claim attributes to it.
In the citing paper
“Additionally, the advancement of artificial intelligence (AI)-based computational tools is facilitating drug repurposing, presenting a promising strategy AD drug development.431–433”
From Recent advances in Alzheimer's disease: Mechanisms, clinical trials and new drug development strategies. (2024) · cites this paper as [433]
Self-check
Percentages, sums and reported differences re-computed from the paper’s own numbers.
The self-check needs the paper’s full text.
Citations
Cites
Adam: A Method for Stochastic Optimization
Kingma, D. P., & Ba, J. (2014) · arXiv · doi:10.48550/arxiv.1412.6980 · Cited by 98,946
Scikit-learn: Machine Learning in Python
Pedregosa, F., Varoquaux, G., Gramfort, A., Michel, V., Thirion, B., Grisel, O., Blondel, M., Müller, A., Nothman, J., Louppe, G., et al. (2012) · arXiv · doi:10.48550/arxiv.1201.0490 · Cited by 71,016
XGBoost: A Scalable Tree Boosting System
Chen, T., & Guestrin, C. (2016) · Proceedings of the 22nd ACM SIGKDD International Conference on Knowledge Discovery and Data Mining · doi:10.1145/2939672.2939785 · Cited by 54,569
Collective dynamics of ‘small-world’ networks
Watts, D. J., & Strogatz, S. H. (1998) · Nature · doi:10.1038/30918 · Cited by 43,060 · cited 2×
“…statistical topological features in the PIN for each gene, we calculated the following representative network metrics: indegree, outdegree, betweenness, closeness, PageRank [31], cluster coefficient [32], nearest neighbor degree (NND) [33], bow-tie structures [34], and indispensable nodes [35, 36].”
BackgroundMethodSMOTE synthetic minority over-sampling technique
Chawla, N. V., Bowyer, K. W., Hall, L. O., & Kegelmeyer, W. P. (2002) · Journal of Artificial Intelligence Research · doi:10.1613/jair.953 · Cited by 32,865 · cited 4×
“In order to make class-balanced training datasets for building binary classifiers, we used a state of the art sampling method, SMOTE (Synthetic Minority Oversampling TEchnique) [21] that synthetically creates new cases in minority class (in this study, “positive” case) (see Materials and Method in details).”
MethodInfluentialReducing the dimensionality of data with neural networks
Hinton, G. E., & Salakhutdinov, R. R. (2006) · Science · doi:10.1126/science.1127647 · Cited by 20,928
The anatomy of a large-scale hypertextual Web search engine
Brin, S., & Page, L. (1998) · Computer Networks and ISDN Systems · doi:10.1016/s0169-7552(98)00110-x · Cited by 16,004
The igraph software package for complex network research
Csárdi, G., & Nepusz, T. (2006) · Medical Entomology and Zoology · Cited by 13,507
TensorFlow: A system for large-scale machine learning
Abadi, M., Barham, P., Chen, J., Chen, Z., Davis, A., Dean, J., Devin, M., Ghemawat, S., Irving, G., Isard, M., et al. (2016) · arXiv (Cornell University) · doi:10.48550/arxiv.1605.08695 · Cited by 11,822
DrugBank 5.0: a major update to the DrugBank database for 2018
Wishart, D. S., Feunang, Y. D., Guo, A. C., Lo, E. J., Marcu, A., Grant, J. R., Sajed, T., Johnson, D., Li, C., Sayeeda, Z., et al. (2018) · Nucleic Acids Research · doi:10.1093/nar/gkx1037 · Cited by 8,404
Research works printed but not linked: 1
- Van Der Maaten L, Postma E, Van den Herik J. Dimensionality reduction: a comparative. J Mach Learn Res. 2009; 10(66-71):13.
Cited by
Zhang, J., Zhang, Y., Wang, J., Xia, Y., Zhang, J., & Chen, L. (2024) · Signal Transduction and Targeted Therapy · doi:10.1038/s41392-024-01911-3 · Cited by 1,138
The role of AI in drug discovery: challenges, opportunities, and strategies
Blanco-González, A., Cabezón, A., Seco-González, A., Conde-Torres, D., Antelo-Riveiro, P., Piñeiro, Á., & Garcia-Fandino, R. (2023) · Pharmaceuticals · doi:10.3390/ph16060891 · Cited by 690
Hossain, M. S., & Hussain, M. H. (2025) · Pharmacology Research & Perspectives · doi:10.1002/prp2.70131 · Cited by 121
Applied Artificial Intelligence in Materials Science and Material Design
Chávez‐Ángel, E., Eriksen, M., Castro‐Álvarez, A., García, J. H., Botifoll, M., Ávalos‐Ovando, Ó., Arbiol, J., & Mugarza, A. (2025) · Advanced Intelligent Systems · doi:10.1002/aisy.202400986 · Cited by 100
Toumaj, S., Heidari, A., Shahhosseini, R., & Navimipour, N. J. (2024) · Artificial Intelligence Review · doi:10.1007/s10462-024-11041-5 · Cited by 83
Metadata
- Authors
- Tsuji, S., Hase, T., Yachie-Kinoshita, A., Nishino, T., Ghosh, S., Kikuchi, M., Shimokawa, K., Aburatani, H., Kitano, H., & Tanaka, H.
- Affiliations
- Research Center for Advanced Science and Technology, The University of Tokyo (JP)
- Tokyo Medical and Dental University (JP)
- Systems Biology Institute (JP)
- The University of Osaka (JP)
- Center for Mathematical Modeling and Data Science, The University of Osaka (JP)
- Corresponding author
- Tsuji, Shingo
- Hase, Takeshi
- ORCID
- Venue
- Alzheimer's Research & Therapy
- Published
- 2021-05-03
- Volume
- 13
- Issue
- 1
- Pages
- 92-92
- ISSN
- 1758-9193 (ISSN-L)
- PMC
- PMC8091739
- OpenAlex
- W3158891634
- Cited by
- 75
- References
- 62
- Citations by year
- 2026: 12 · 2025: 16 · 2024: 20 · 2023: 15 · 2022: 10 · 2021: 2
- FWCI
- 6.19
- Type
- journal article
- Language
- en
- Open access
- gold
- doi.org
- Licence
- cc-by
- creativecommons.org/licenses/by/4.0 (tdm)
- creativecommons.org/licenses/by/4.0 (vor)
- Locations
- Alzheimer s Research & Therapy (publishedVersion, cc-by)
- bioRxiv (Cold Spring Harbor Laboratory) (acceptedVersion, cc-by-nc-nd)
- PubMed Central (publishedVersion, cc-by)
- PubMed (publishedVersion)
- DOAJ (DOAJ: Directory of Open Access Journals) (submittedVersion, cc-by-sa)
- Funders
- Japan Society for the Promotion of Science (17H06107, 20K15778)
- Topics
- Life Sciences › Pharmacology, Toxicology and Pharmaceutics › Drug Discovery › Computational Drug Discovery Methods
- Life Sciences › Biochemistry, Genetics and Molecular Biology › Molecular Biology › Bioinformatics and Genomic Networks
- Life Sciences › Neuroscience › Cellular and Molecular Neuroscience › Alzheimer's disease research and treatments
- Keywords
- drug target prioritization, drug repurposing, Alzheimer's disease, protein-protein interaction network, deep learning, drug target identification, latent representations, drug candidates, PSD-95, EGFR, Rac1, Syk, Pyk2, SOCS1, tamoxifen, bosutinib, dasatinib
- MeSH terms
- Machine Learning, Alzheimer Disease, Artificial Intelligence, Pharmaceutical Preparations, Humans, Drug Repositioning
About these checks
Registry, retraction, Cites and statistics results are computed, not judged, with one exception: a printed reference that no index lists is read once by a model before it counts as a citation error. Claims are extracted by a model and kept only when their quote appears verbatim in the text; each cited source is then checked, with a model’s help, for whether it says what the claim relies on. Those verdicts can be wrong — read the claim’s quote and the cited source before relying on one.
Statistics and arithmetic are recomputed, not judged.
Confidence bands are shown only for fields calibrated on our annotated test set. None is calibrated yet, so no band is shown.
What counts as a claim ›How we measure confidence ›How we check this ›
Are you an author, or do you see a problem with this page? Request a review
How to cite
Cite CoChat for the checks on this page, and the paper for its own findings.
- This page
- CoChat. (2026). Citation check: Artificial intelligence-based computational framework for drug-target prioritization and inference of novel repositionable drugs for Alzheimer’s disease. https://app.cochat.ai/papers/10.1186/s13195-021-00826-3
- The paper
- Tsuji, S., Hase, T., Yachie-Kinoshita, A., Nishino, T., Ghosh, S., Kikuchi, M., Shimokawa, K., Aburatani, H., Kitano, H., & Tanaka, H. (2021). Artificial intelligence-based computational framework for drug-target prioritization and inference of novel repositionable drugs for Alzheimer’s disease. Alzheimer's Research & Therapy. https://doi.org/10.1186/s13195-021-00826-3
Data sources
Bibliographic data: Semantic Scholar, OpenAlex, Crossref.
Contains information from the Semantic Scholar Academic Graph Datasets, made available under the ODC Attribution License (ODC-BY 1.0).
Semantic Scholar’s data is described in: Kinney, R., et al. (2023). The Semantic Scholar Open Data Platform. arXiv:2301.10140.
