

The DOI matches its Crossref record; 25 of the 25 references it cites were found in a registry or an index.
Infrared spectrum analysis of organic molecules with neural networks using standard reference data sets in combination with real-world data
Open accessPublished version of a preprint
Abstract
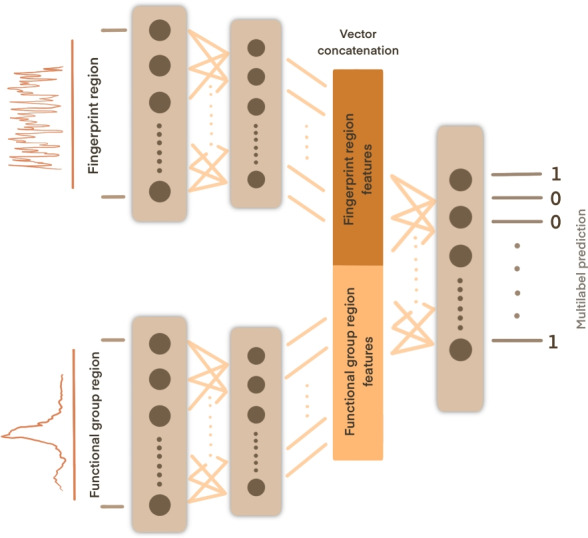
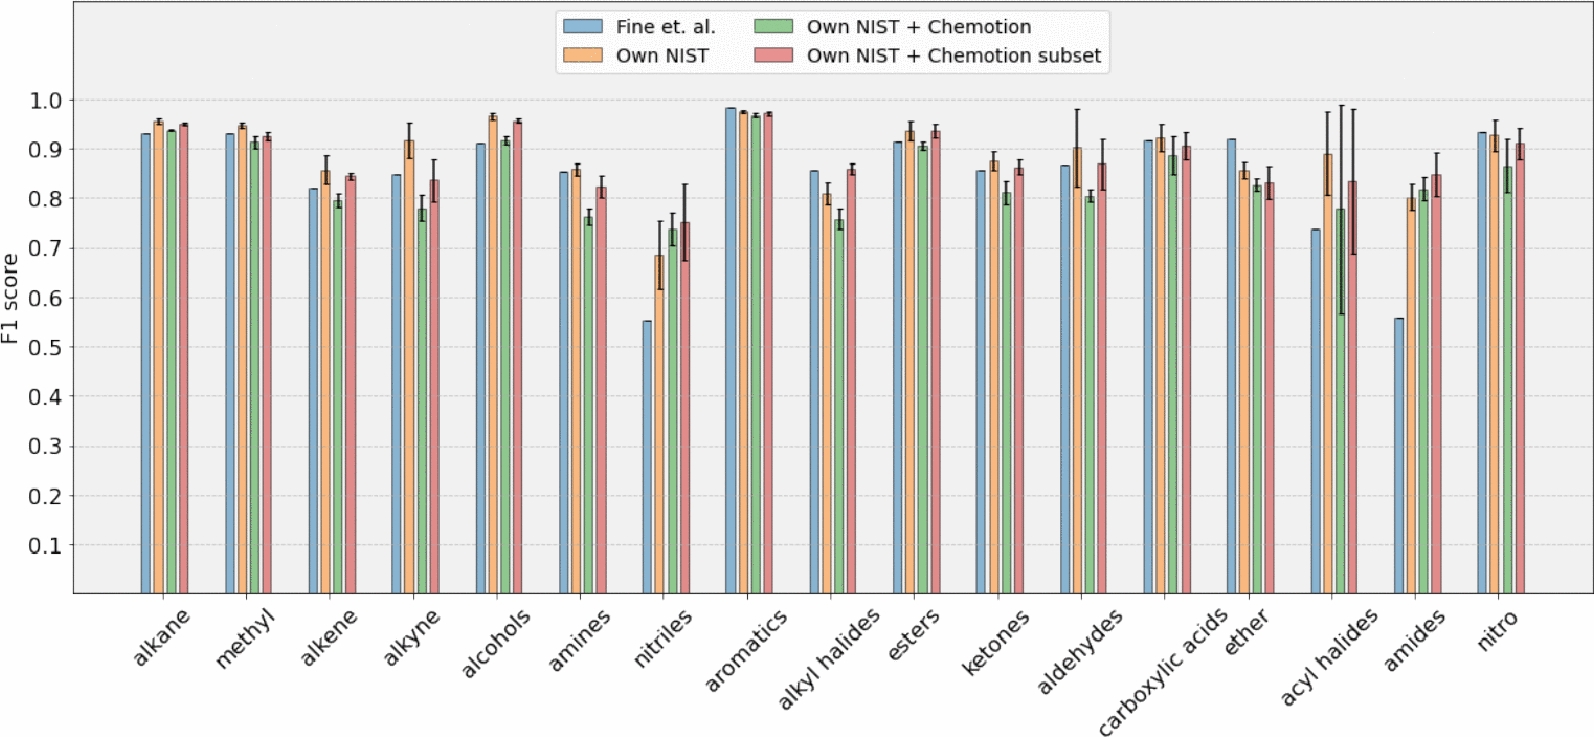
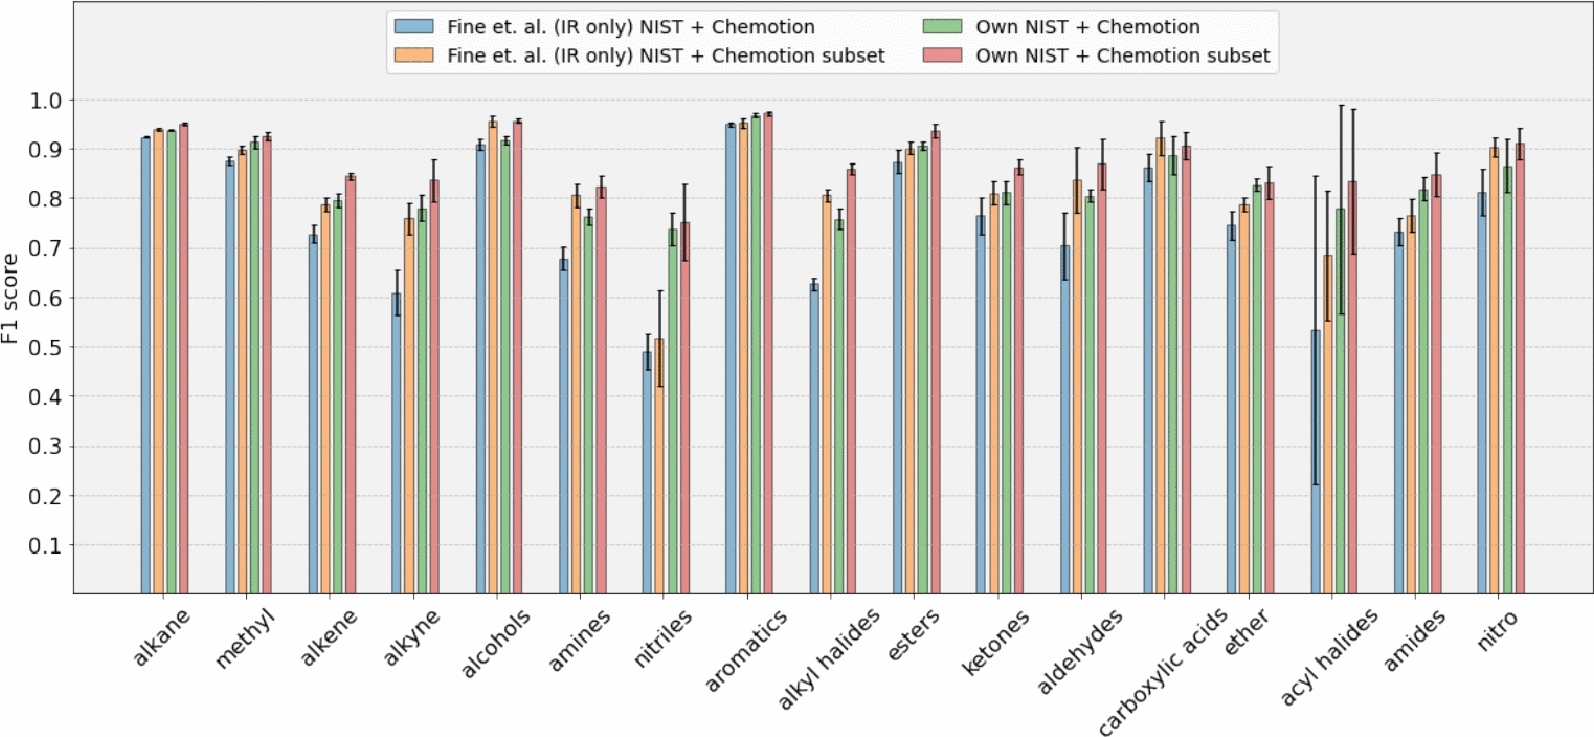
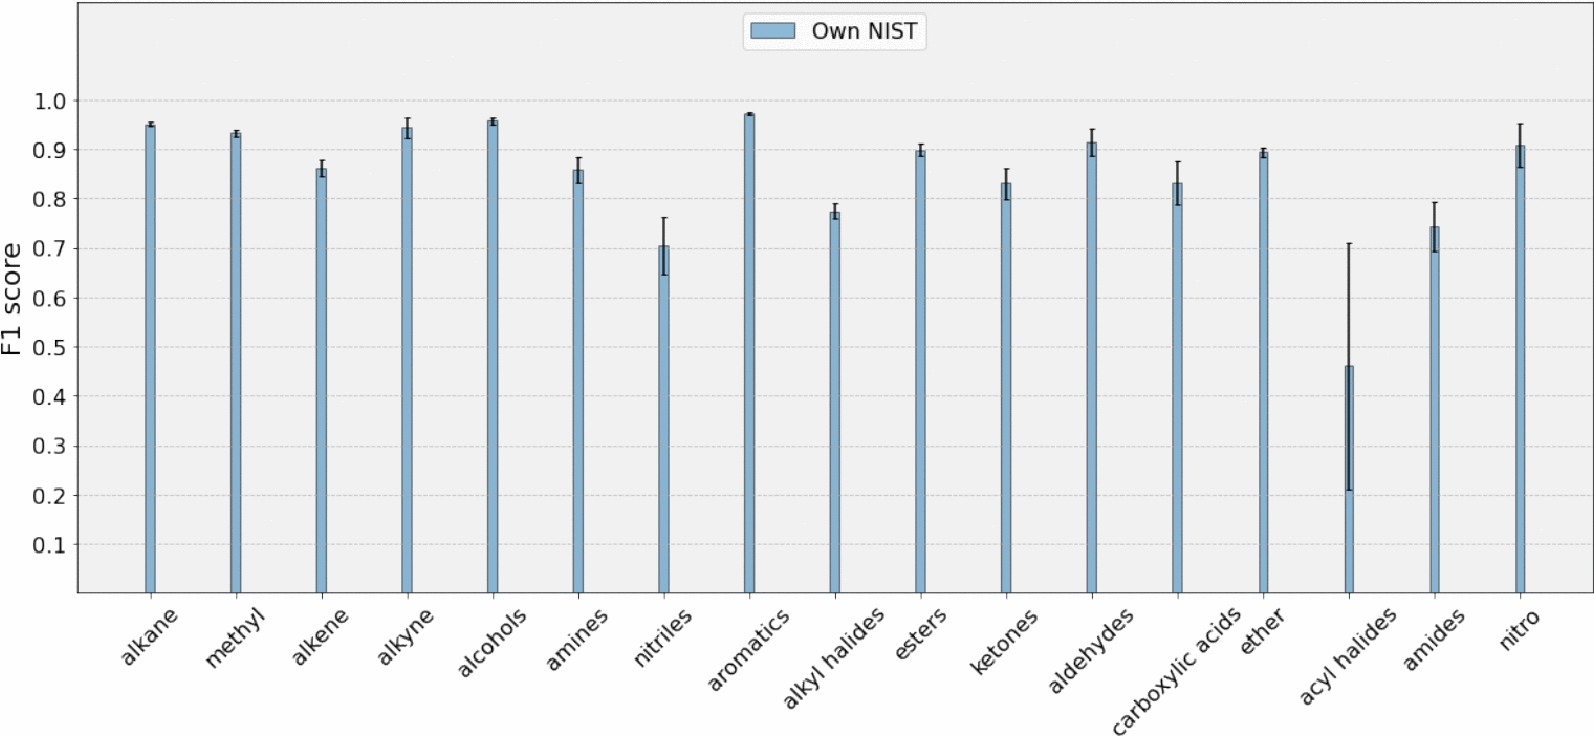
In this study, we propose a neural network- based approach to analyze IR spectra and detect the presence of functional groups. Our neural network architecture is based on the concept of learning split representations. We demonstrate that our method achieves favorable validation performance using the NIST dataset. Furthermore, by incorporating additional data from the open-access research data repository Chemotion, we show that our model improves the classification performance for nitriles and amides. Scientific contribution : Our method exclusively uses IR data as input for a neural network, making its performance, unlike other well-performing models, independent of additional data types obtained from analytical measurements. Furthermore, our proposed method leverages a deep learning model that outperforms previous approaches, achieving F1 scores above 0.7 to identify 17 functional groups. By incorporating real-world data from various laboratories, we demonstrate how open-access, specialized research data repositories can serve as yet unexplored, valuable benchmark datasets for future machine learning research.
Overview
The claims and statistics of this paper haven’t been checked yet.
Run the check — free, no account needed. It reads the open-access text and checks the sources it cites.
Integrity signals
Registry
Cites
Statistics
Figures
Verification
Claims the paper makes
The claims and statistics of this paper haven’t been checked yet.
Run the check — free, no account needed. It reads the open-access text and checks the sources it cites.
Self-check
Percentages, sums and reported differences re-computed from the paper’s own numbers.
The self-check needs the paper’s full text.
Citations
Cites
Highly accurate protein structure prediction with AlphaFold
Jumper, J., Evans, R., Pritzel, A., Green, T., Figurnov, M., Ronneberger, O., Tunyasuvunakool, K., Bates, R., Žídek, A., Potapenko, A., et al. (2021) · Nature · doi:10.1038/s41586-021-03819-2 · Cited by 43,764
Infrared Spectroscopy: Fundamentals and Applications
Stuart, B. H. (2004) · Analytical Techniques in the Sciences · doi:10.1002/0470011149 · Cited by 4,427
Interpretation of Infrared Spectra, A Practical Approach
Coates, J. (2000) · Encyclopedia of Analytical Chemistry · doi:10.1002/9780470027318.a5606 · Cited by 4,411
MoleculeNet: a benchmark for molecular machine learning
Wu, Z., Ramsundar, B., Feinberg, E. N., Gomes, J., Geniesse, C., Pappu, A. S., Leswing, K., & Pande, V. (2018) · Chemical Science · doi:10.1039/c7sc02664a · Cited by 3,107
Fourier Transform Infrared Spectrometry
Griffiths, P. R., & de Haseth, J. A. (2007) · doi:10.1002/047010631x · Cited by 3,052
Highly accurate protein structure prediction for the human proteome
Tunyasuvunakool, K., Adler, J., Wu, Z., Green, T., Zielinski, M., Žídek, A., Bridgland, A., Cowie, A., Meyer, C., Laydon, A., et al. (2021) · Nature · doi:10.1038/s41586-021-03828-1 · Cited by 3,025
Infrared spectral interpretation: a systematic approach
(1999) · Choice Reviews Online · doi:10.5860/choice.36-5697 · Cited by 1,969
Aliper, A., Plis, S., Artemov, A., Ulloa, A., Mamoshina, P., & Zhavoronkov, A. (2016) · Molecular Pharmaceutics · doi:10.1021/acs.molpharmaceut.6b00248 · Cited by 610
Mater, A. C., & Coote, M. L. (2019) · Journal of Chemical Information and Modeling · doi:10.1021/acs.jcim.9b00266 · Cited by 565
Méndez-Lucio, O., Baillif, B., Clevert, D.-A., Rouquié, D., & Wichard, J. (2020) · Nature Communications · doi:10.1038/s41467-019-13807-w · Cited by 419
Research works printed but not linked: 4
- Jung N, Tremouilhac P, Punjabi D et. al. (2024) Chemotion repository - data collection: FT-IR spectroscopy data. Karlsruhe Institute of Technology, Karlsruhe
- Lundberg SM, Lee SI (2017) A unified approach to interpreting model predictions. In: NIPS'17: Proceedings of the 31st international conference on neural information processing systems, pp 4768–4777
- Sigma-Aldrich Library (2024) Sigma-aldrich library of FT-IR spectra. https://sciencesolutions.wiley.com/solutions/technique/ir/sigma-aldrich-library-of-ft-ir-spectra/. Accessed 5 Feb 2025
- Szymanski HA, Erickson RE (1970) Infrared, vol 2. Plenum Press, New York
Metadata
- Authors
- Punjabi, D., Huang, Y.-C., Holzhauer, L., Tremouilhac, P., Friederich, P., Jung, N., & Bräse, S.
- Affiliations
- Karlsruhe Institute of Technology (DE)
- Corresponding author
- Friederich, Pascal
- Jung, Nicole
- Bräse, Stefan
- Venue
- Journal of Cheminformatics
- Published
- 2025-02-26
- Volume
- 17
- Issue
- 1
- Pages
- 24-24
- ISSN
- 1758-2946 (ISSN-L)
- PMC
- PMC11863843
- OpenAlex
- W4407977858
- Cited by
- 12
- References
- 25
- Citations by year
- 2026: 7 · 2025: 5
- FWCI
- 4.50
- Type
- journal article
- Language
- en
- Open access
- gold
- doi.org
- Licence
- cc-by
- creativecommons.org/licenses/by/4.0 (tdm)
- creativecommons.org/licenses/by/4.0 (vor)
- Locations
- Journal of Cheminformatics (publishedVersion, cc-by)
- PubMed Central (publishedVersion, cc-by)
- PubMed (publishedVersion)
- DOAJ (DOAJ: Directory of Open Access Journals) (submittedVersion, cc-by-sa)
- Funders
- Helmholtz - Research Field Information (VirtMat)
- Karlsruher Institut für Technologie (KIT)
- Topics
- Physical Sciences › Chemistry › Analytical Chemistry › Spectroscopy and Chemometric Analyses
- Life Sciences › Biochemistry, Genetics and Molecular Biology › Biophysics › Spectroscopy Techniques in Biomedical and Chemical Research
- Physical Sciences › Materials Science › Materials Chemistry › Machine Learning in Materials Science
- Keywords
- infrared spectroscopy, functional group identification, artificial neural networks, nitriles, amides, benchmark dataset, organic compounds, spectral classification
About these checks
Registry, retraction, Cites and statistics results are computed, not judged, with one exception: a printed reference that no index lists is read once by a model before it counts as a citation error. Claims are extracted by a model and kept only when their quote appears verbatim in the text; each cited source is then checked, with a model’s help, for whether it says what the claim relies on. Those verdicts can be wrong — read the claim’s quote and the cited source before relying on one.
Statistics and arithmetic are recomputed, not judged.
Confidence bands are shown only for fields calibrated on our annotated test set. None is calibrated yet, so no band is shown.
What counts as a claim ›How we measure confidence ›How we check this ›
Are you an author, or do you see a problem with this page? Request a review
How to cite
Cite CoChat for the checks on this page, and the paper for its own findings.
- This page
- CoChat. (2026). Citation check: Infrared spectrum analysis of organic molecules with neural networks using standard reference data sets in combination with real-world data. https://app.cochat.ai/papers/10.1186/s13321-025-00960-2
- The paper
- Punjabi, D., Huang, Y.-C., Holzhauer, L., Tremouilhac, P., Friederich, P., Jung, N., & Bräse, S. (2025). Infrared spectrum analysis of organic molecules with neural networks using standard reference data sets in combination with real-world data. Journal of Cheminformatics. https://doi.org/10.1186/s13321-025-00960-2
Data sources
Bibliographic data: Semantic Scholar, OpenAlex, Crossref.
Contains information from the Semantic Scholar Academic Graph Datasets, made available under the ODC Attribution License (ODC-BY 1.0).
Semantic Scholar’s data is described in: Kinney, R., et al. (2023). The Semantic Scholar Open Data Platform. arXiv:2301.10140.
