

The DOI matches its Crossref record; 100 of the 100 references it cites were found in a registry or an index.
Fecal microbiota transplantation protects rotenone-induced Parkinson’s disease mice via suppressing inflammation mediated by the lipopolysaccharide-TLR4 signaling pathway through the microbiota-gut-brain axis
Open accessAbstract
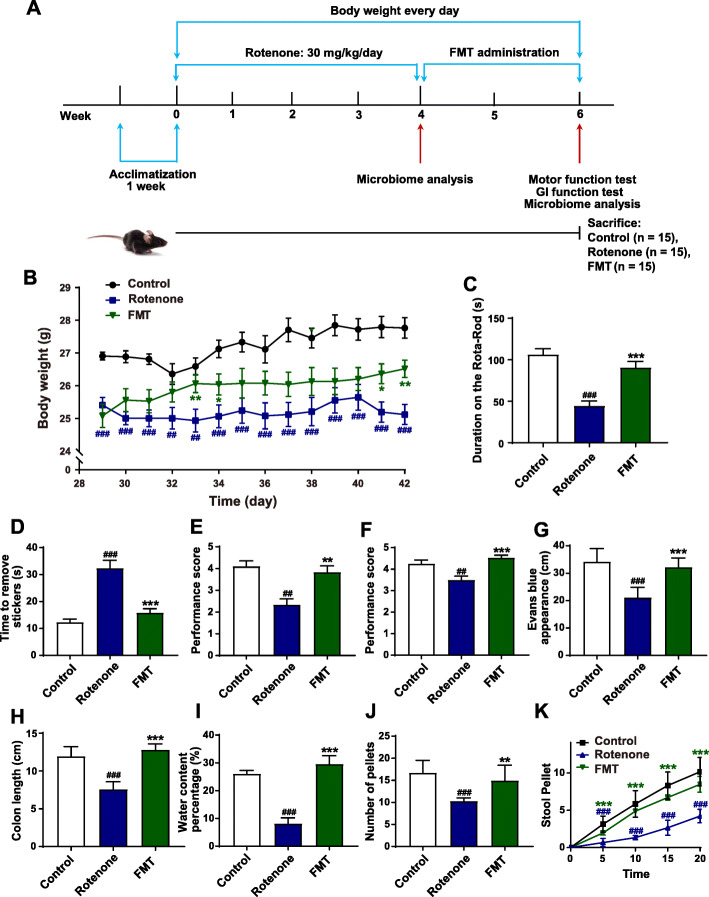
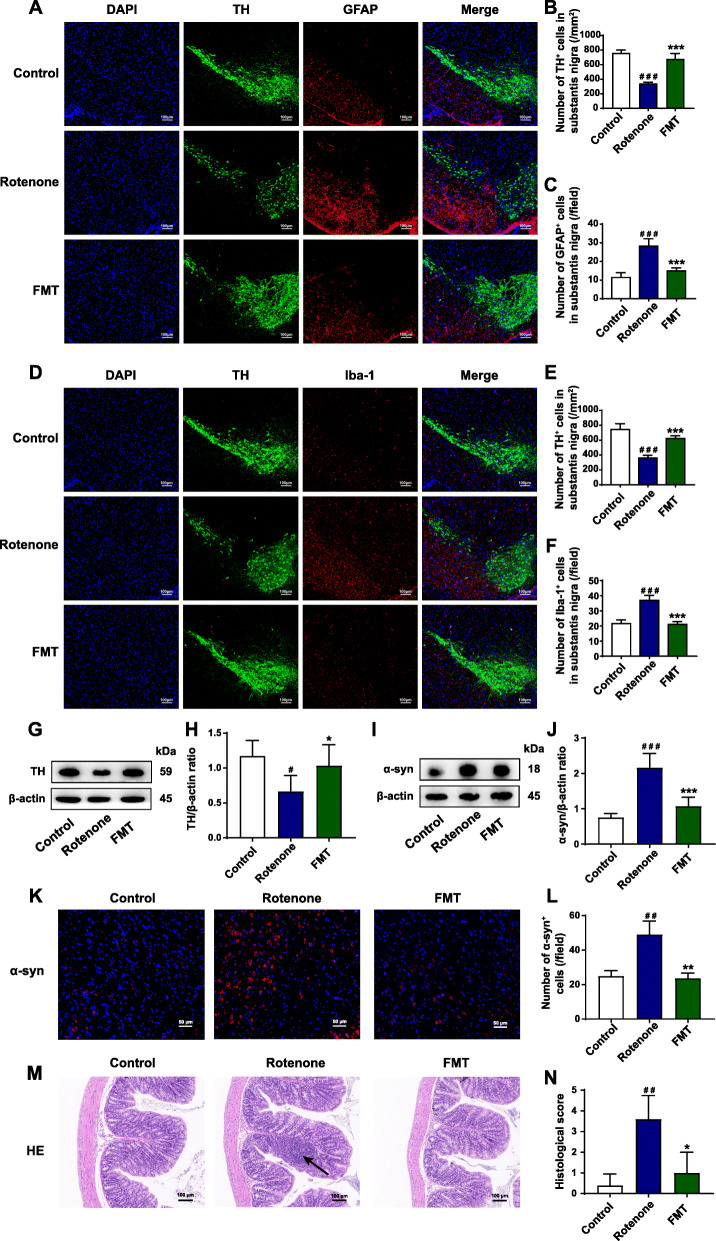
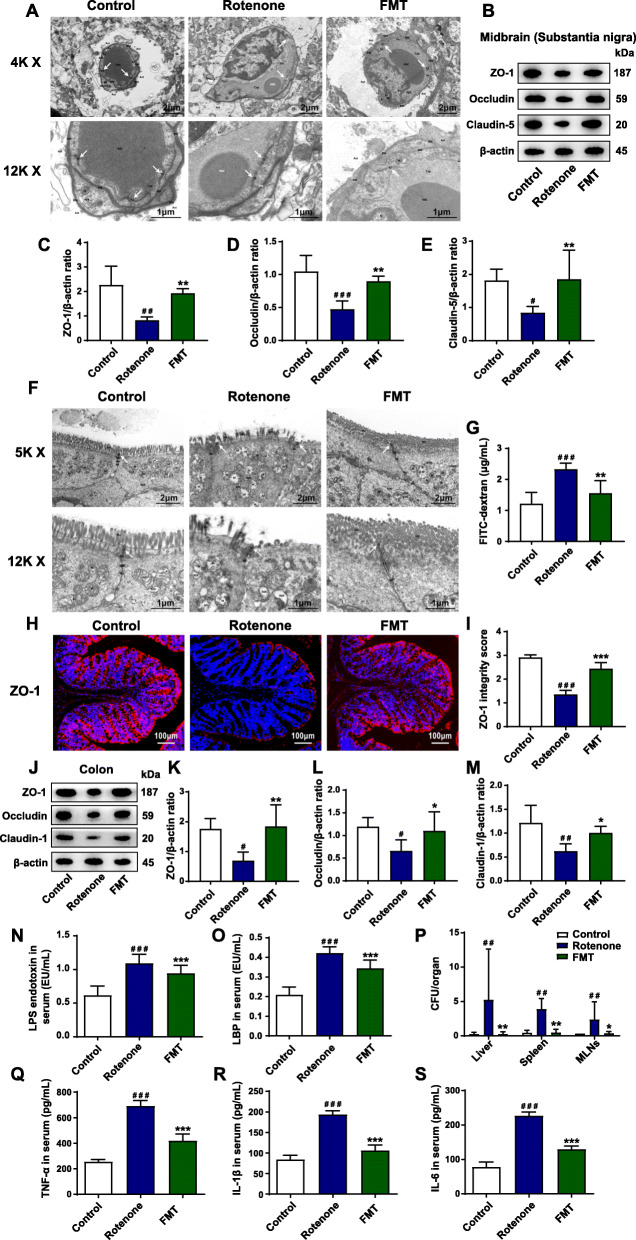
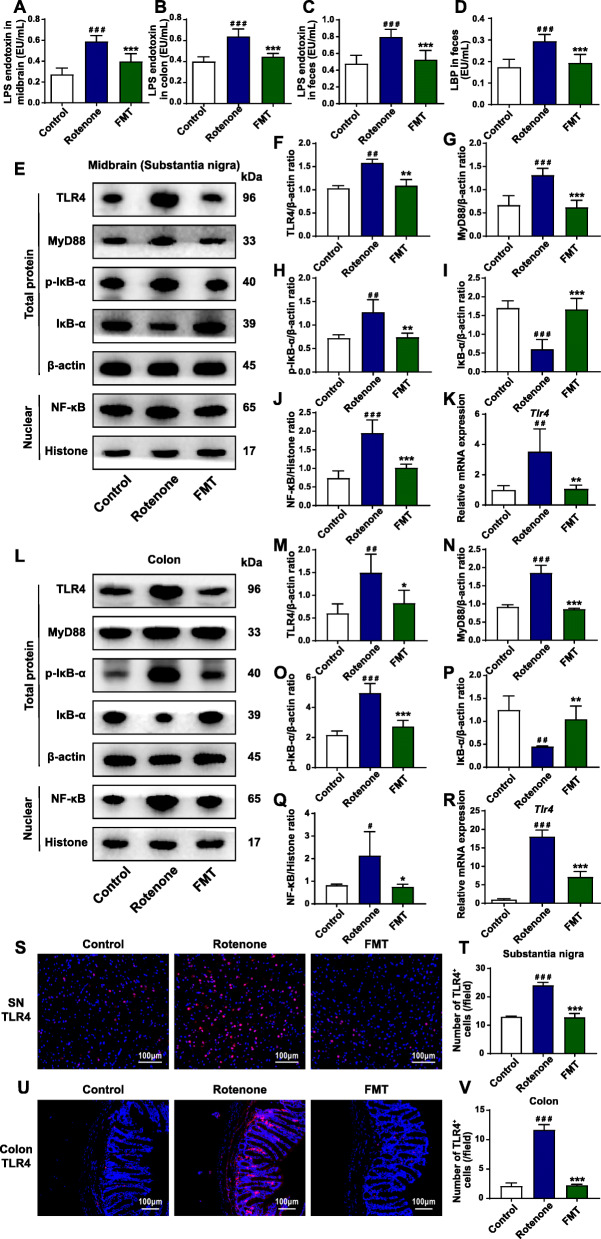
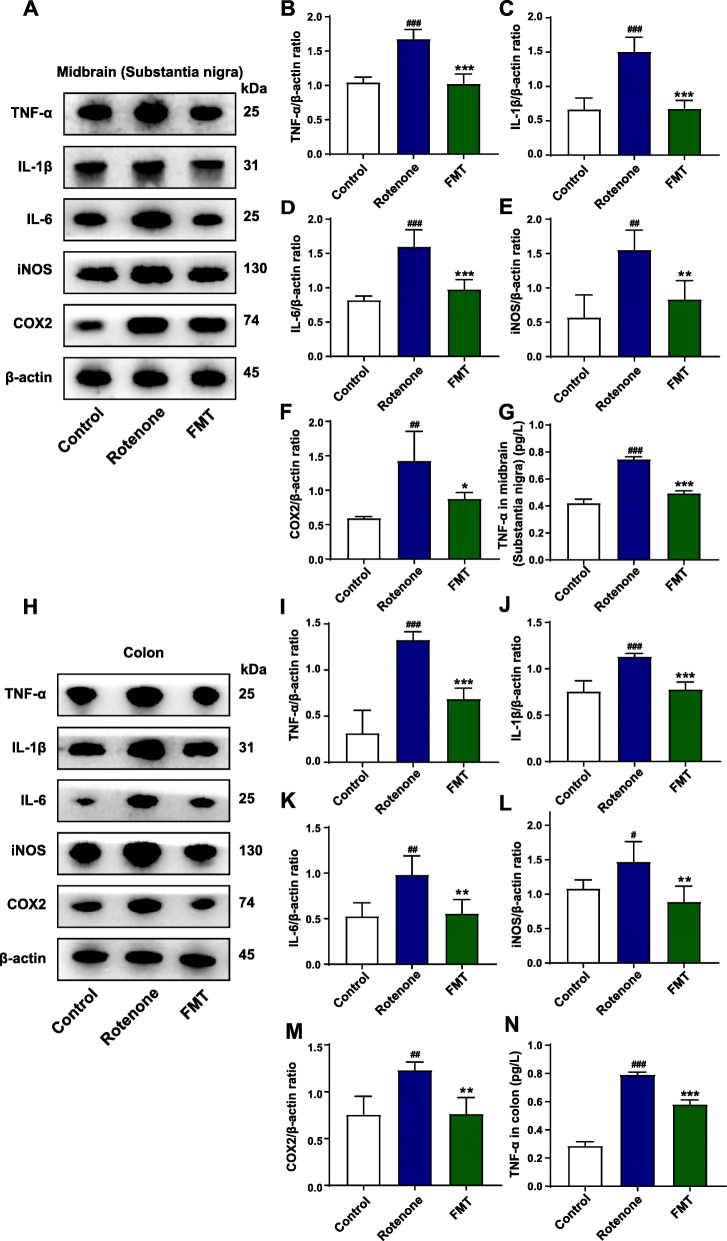
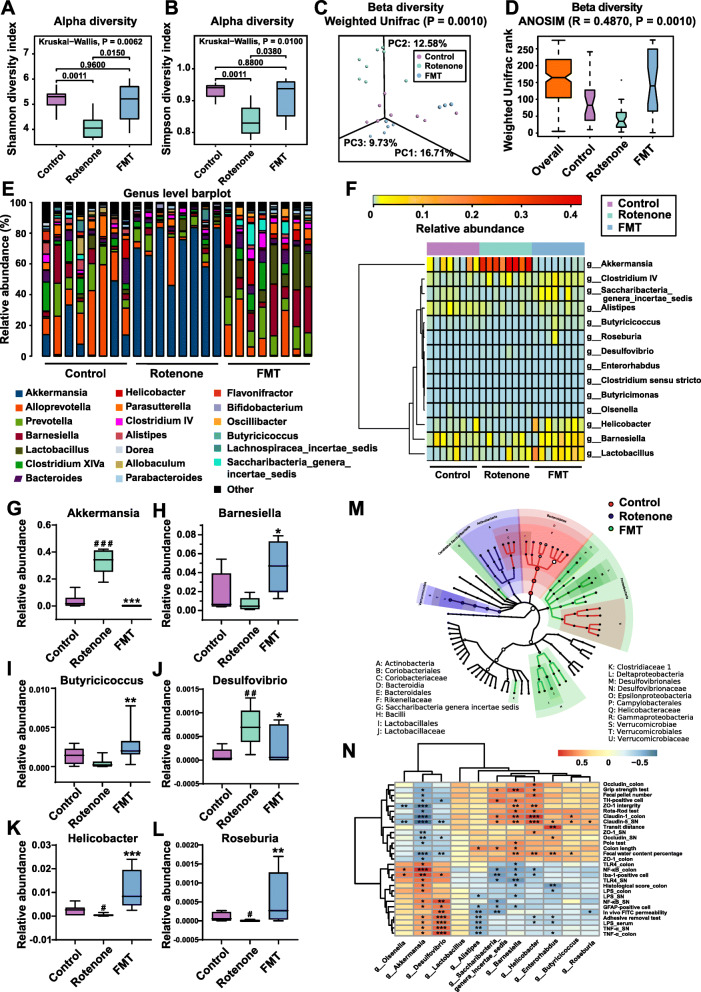
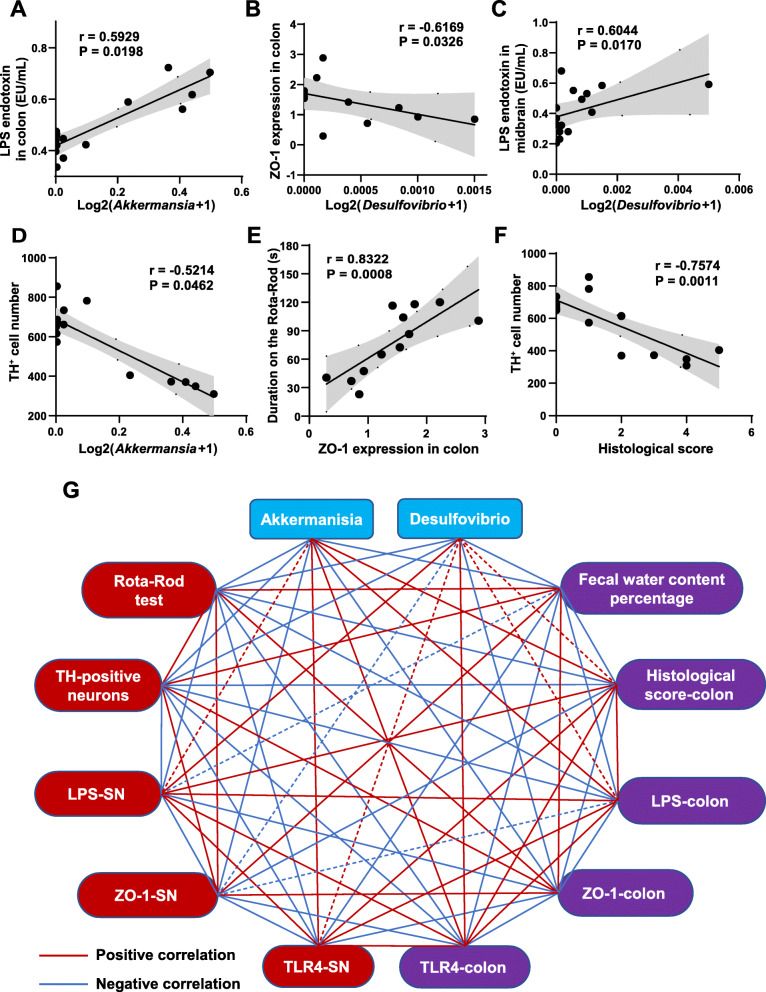
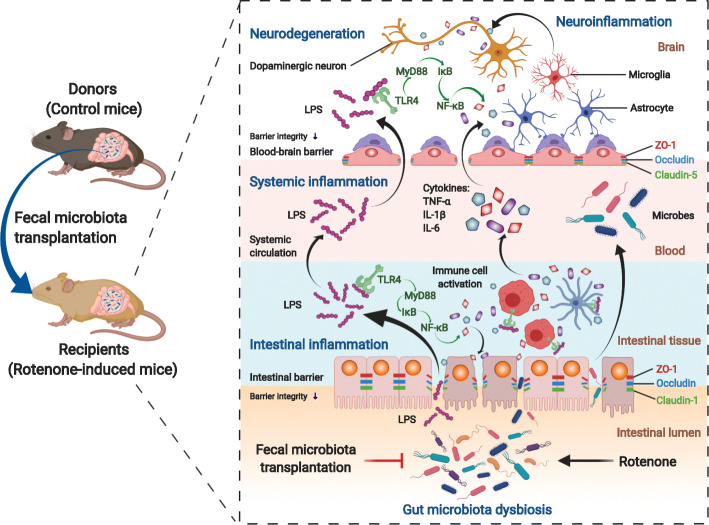
Background: Parkinson’s disease (PD) is a prevalent neurodegenerative disorder, displaying not only well-known motor deficits but also gastrointestinal dysfunctions. Consistently, it has been increasingly evident that gut microbiota affects the communication between the gut and the brain in PD pathogenesis, known as the microbiota-gut-brain axis. As an approach to re-establishing a normal microbiota community, fecal microbiota transplantation (FMT) has exerted beneficial effects on PD in recent studies. Here, in this study, we established a chronic rotenone-induced PD mouse model to evaluate the protective effects of FMT treatment on PD and to explore the underlying mechanisms, which also proves the involvement of gut microbiota dysbiosis in PD pathogenesis via the microbiota-gut-brain axis. Results: We demonstrated that gut microbiota dysbiosis induced by rotenone administration caused gastrointestinal function impairment and poor behavioral performances in the PD mice. Moreover, 16S RNA sequencing identified the increase of bacterial genera Akkermansia and Desulfovibrio in fecal samples of rotenone-induced mice. By contrast, FMT treatment remarkably restored the gut microbial community, thus ameliorating the gastrointestinal dysfunctions and the motor deficits of the PD mice. Further experiments revealed that FMT administration alleviated intestinal inflammation and barrier destruction, thus reducing the levels of systemic inflammation. Subsequently, FMT treatment attenuated blood-brain barrier (BBB) impairment and suppressed neuroinflammation in the substantia nigra (SN), which further decreased the damage of dopaminergic neurons. Additional mechanistic investigation discovered that FMT treatment reduced lipopolysaccharide (LPS) levels in the colon, the serum, and the SN, thereafter suppressing the TLR4/MyD88/NF-κB signaling pathway and its downstream pro-inflammatory products both in the SN and the colon. Conclusions: Our current study demonstrates that FMT treatment can correct the gut microbiota dysbiosis and ameliorate the rotenone-induced PD mouse model, in which suppression of the inflammation mediated by the LPS-TLR4 signaling pathway both in the gut and the brain possibly plays a significant role. Further, we prove that rotenone-induced microbiota dysbiosis is involved in the genesis of PD via the microbiota-gut-brain axis.
Overview
The claims and statistics of this paper haven’t been checked yet.
Run the check — free, no account needed. It reads the open-access text and checks the sources it cites.
Integrity signals
Registry
Cites
Statistics
Figures
Verification
Claims the paper makes
The claims and statistics of this paper haven’t been checked yet.
Run the check — free, no account needed. It reads the open-access text and checks the sources it cites.
Claims other papers make about this one
Each is checked against this paper’s own text: does it say what the citing paper says it does?
In the citing paper
“FMT from normal control mice into neurotoxin-induced PD mice could protect dopaminergic neurons by suppressing the TLR4 inflammatory pathway [18, 19]”
From Healthy Human Fecal Microbiota Transplantation into Mice Attenuates MPTP-Induced Neurotoxicity via AMPK/SOD2 Pathway (2023) · cites this paper as [19]
In the citing paper
“Consistently, previous studies have demonstrated that FMT from healthy control mice relieved motor impairments in MPTP/rotenone-induced PD mice [18, 19].”
From Healthy Human Fecal Microbiota Transplantation into Mice Attenuates MPTP-Induced Neurotoxicity via AMPK/SOD2 Pathway (2023) · cites this paper as [19]
In the citing paper
“FMT from healthy control mice exerted a neuroprotective effect in neurotoxin-induced PD mice [18, 19]”
From Healthy Human Fecal Microbiota Transplantation into Mice Attenuates MPTP-Induced Neurotoxicity via AMPK/SOD2 Pathway (2023) · cites this paper as [19]
In the citing paper
“Intestinal inflammation is a crucial contributor to PD development [53,54,55,56].”
From Neuroprotective Effects of Bifidobacterium breve CCFM1067 in MPTP-Induced Mouse Models of Parkinson’s Disease (2022) · cites this paper as [54]
In the citing paper
“Tight junction proteins, such as ZO-1 and occludin, contribute significantly to the maintenance of the intestinal barrier, which aids in protecting immune cells underneath the intestinal mucosa from invading infections [54,63,64].”
From Neuroprotective Effects of Bifidobacterium breve CCFM1067 in MPTP-Induced Mouse Models of Parkinson’s Disease (2022) · cites this paper as [54]
In the citing paper
“the feces of patients with PD transplanted in germ-free mice showed severe motor impairments, inflammation, and other pathological symptoms [12].”
From Neuroprotective Effects of Sodium Butyrate by Restoring Gut Microbiota and Inhibiting TLR4 Signaling in Mice with MPTP-Induced Parkinson’s Disease (2023) · cites this paper as [12]
In the citing paper
“Due to increased intestinal permeability, microbial toxins and pro-inflammatory mediators produced as a result of gut dysbiosis can leak into the circulation causing systemic inflammation, in turn destroying the blood–brain barrier and causing neuroinflammation [12,64].”
From Neuroprotective Effects of Sodium Butyrate by Restoring Gut Microbiota and Inhibiting TLR4 Signaling in Mice with MPTP-Induced Parkinson’s Disease (2023) · cites this paper as [12]
In the citing paper
“Concerning PD, consistent preclinical studies and a handful of human case reports have shown that FMT might be exploited to reduce motor and non-motor symptoms, as well as constipation, at least in the short term [40,465,469,470,471,472,473,474,475,476,477] (Table 4).”
From The Interplay between Gut Microbiota and Parkinson’s Disease: Implications on Diagnosis and Treatment (2022) · cites this paper as [470]
In the citing paper
“Moreover, FMT appears to protect from gut inflammation by promoting intestinal barrier integrity and reducing the levels of LPS in the colon, serum, and SN, therefore preventing leaky gut and systemic inflammation [470].”
From The Interplay between Gut Microbiota and Parkinson’s Disease: Implications on Diagnosis and Treatment (2022) · cites this paper as [470]
In the citing paper
“Notably, decreased neuroinflammation following FMT has been reported by numerous preclinical studies [469,470,471,472].”
From The Interplay between Gut Microbiota and Parkinson’s Disease: Implications on Diagnosis and Treatment (2022) · cites this paper as [470]
In the citing paper
“Conversely, fecal matter transplantation from healthy mice to PD recipient mice improved physical performance, ameliorated motor symptoms and reduced dysbiosis in several independent studies [469,470,471,472].”
From The Interplay between Gut Microbiota and Parkinson’s Disease: Implications on Diagnosis and Treatment (2022) · cites this paper as [470]
In the citing paper
“Looking at the GM composition, there is evidence that FMT re-establishes eubiosis by disadvantaging the growth of Desulfovibrio, Akkermansia and Proteobacteria (orders Enterobacteriales and Turicibacteriales), while simultaneously favoring the proliferation of beneficial bacteria such as Bacteroidetes and Actinobacteria phyla, with a particular effect on Blautia and Prevotella species [469,470,472”
From The Interplay between Gut Microbiota and Parkinson’s Disease: Implications on Diagnosis and Treatment (2022) · cites this paper as [470]
In the citing paper
“This beneficial effect should be ascribed to the ability of GM to modulate microglia and astrocyte activation in SN by regulating the TLR4/NF-κB pro-inflammatory pathway and reducing the expression of GSK3β, iNOS and IL-1β, which are implicated in PD pathogenesis and progression [469,470,471,472,478,479,480].”
From The Interplay between Gut Microbiota and Parkinson’s Disease: Implications on Diagnosis and Treatment (2022) · cites this paper as [470]
Self-check
Percentages, sums and reported differences re-computed from the paper’s own numbers.
The self-check needs the paper’s full text.
Citations
Cites
Naive Bayesian Classifier for Rapid Assignment of rRNA Sequences into the New Bacterial Taxonomy
Wang, Q., Garrity, G. M., Tiedje, J. M., & Cole, J. R. (2007) · Applied and Environmental Microbiology · doi:10.1128/aem.00062-07 · Cited by 20,145
UPARSE: highly accurate OTU sequences from microbial amplicon reads
Edgar, R. C. (2013) · Nature Methods · doi:10.1038/nmeth.2604 · Cited by 16,770
Metagenomic biomarker discovery and explanation
Segata, N., Izard, J., Waldron, L., Gevers, D., Miropolsky, L., Garrett, W. S., & Huttenhower, C. (2011) · Genome Biology · doi:10.1186/gb-2011-12-6-r60 · Cited by 16,192
Predictive functional profiling of microbial communities using 16S rRNA marker gene sequences
Langille, M. G. I., Zaneveld, J., Caporaso, J. G., McDonald, D., Knights, D., Reyes, J. A., Clemente, J. C., Burkepile, D. E., Vega Thurber, R. L., Knight, R., et al. (2013) · Nature Biotechnology · doi:10.1038/nbt.2676 · Cited by 9,116
From inflammation to sickness and depression: when the immune system subjugates the brain
Dantzer, R., O'Connor, J. C., Freund, G. G., Johnson, R. W., & Kelley, K. W. (2008) · Nature Reviews Neuroscience · doi:10.1038/nrn2297 · Cited by 7,395
Kalia, L. V., & Lang, A. E. (2015) · The Lancet · doi:10.1016/s0140-6736(14)61393-3 · Cited by 6,184
Parkinson's disease: clinical features and diagnosis
Jankovic, J. (2008) · Journal of Neurology, Neurosurgery & Psychiatry · doi:10.1136/jnnp.2007.131045 · Cited by 5,720
Ribosomal Database Project: data and tools for high throughput rRNA analysis
Cole, J. R., Wang, Q., Fish, J. A., Chai, B., McGarrell, D. M., Sun, Y., Brown, C. T., Porras‐Alfaro, A., Kuske, C. R., & Tiedje, J. M. (2013) · Nucleic Acids Research · doi:10.1093/nar/gkt1244 · Cited by 4,480
Gut microbiota regulate motor deficits and neuroinflammation in a model of Parkinson's disease
Sampson, T. R., Debelius, J. W., Thron, T., Janssen, S., Shastri, G. G., Ilhan, Z. E., Challis, C., Schretter, C. E., Rocha, S., Gradinaru, V., et al. (2016) · Cell · doi:10.1016/j.cell.2016.11.018 · Cited by 3,622
Toll-Like Receptor Signaling Pathways
Kawasaki, T., & Kawai, T. (2014) · Frontiers in Immunology · doi:10.3389/fimmu.2014.00461 · Cited by 3,245
Cited by
Sorted by citations
Items 201–300 of 617
Shang, M., Ning, J., Zang, C., Ma, J., Yang, Y., Wan, Z., Zhao, J., Jiang, Y., Chen, Q., Dong, Y., et al. (2025) · Acta Pharmaceutica Sinica B · doi:10.1016/j.apsb.2025.02.029 · Cited by 18
Self-citationZhang, Y., Dou, Z., Li, S., Zhang, H., Zeng, S., Zuo, X., Yu, X. H., Zhang, L., Li, Z., Zhu, Q., et al. (2024) · Ultrasonics Sonochemistry · doi:10.1016/j.ultsonch.2024.107200 · Cited by 18
Pang, W., Li, T., Wang, Y.-Y., Song, L., Li, L., Li, X., Qiu, Y., & Yang, Z. (2025) · Frontiers in Cellular and Infection Microbiology · doi:10.3389/fcimb.2025.1528578 · Cited by 16
Xu, Y., Zhao, Y., Liang, L. R., Qu, Y., Yu, C., Zhang, J., Lian, W., & Zhao, Y. C. (2025) · Microbial Pathogenesis · doi:10.1016/j.micpath.2025.107409 · Cited by 16
Sim, M., Hong, S. H., Jung, M. H., Choi, E. Y., Hwang, G., Shin, D.-M., & Kim, C.-S. (2025) · Brain Behavior and Immunity · doi:10.1016/j.bbi.2025.03.032 · Cited by 19
Parkinson Disease and the Gut: A Primer for Gastroenterologists
Sharma, A., Voigt, R. M., Goetz, C. G., & Keshavarzian, A. (2025) · The American Journal of Gastroenterology · doi:10.14309/ajg.0000000000003508 · Cited by 17
Kang, X., Cheng, E., Guo, P., Xi, L., Xiang, C., Xu, S., Zhang, Y., Yang, Y., Zhang, J. J., & Long, H. (2025) · Phytomedicine · doi:10.1016/j.phymed.2025.157009 · Cited by 17
Microbiota metabolites affect sleep as drivers of brain‑gut communication (Review)
Cheng, H. Y., Yang, W., Xu, H., Zhu, W., Gong, A., Yang, X., Li, S., & Xu, H. (2025) · International Journal of Molecular Medicine · doi:10.3892/ijmm.2025.5571 · Cited by 21
Sun, X., Zhang, T., Zhao, Y., Yang, H. K., Li, Y., Sun, X., & Bian, X. (2025) · International Journal of Biological Macromolecules · doi:10.1016/j.ijbiomac.2025.146421 · Cited by 16
Natural products against inflammation and atherosclerosis: Targeting on gut microbiota
Deng, B., Tao, L., & Wang, Y. (2022) · Frontiers in Microbiology · doi:10.3389/fmicb.2022.997056 · Cited by 17
Xiromerisiou, G., Marogianni, C., Androutsopoulou, A., Ntavaroukas, P., Mysiris, D. S., & Papoutsopoulou, S. (2023) · Biology · doi:10.3390/biology12010093 · Cited by 18
Lu, Y., Gao, X., Yang, N., Mohammed, S. A. D., Fu, J., Wang, T., Wang, C., Yuan, C., Lu, F., & Liu, S. (2023) · Heliyon · doi:10.1016/j.heliyon.2023.e18045 · Cited by 17
Gut microbiota-mediated IL-22 alleviates metabolic inflammation
Wang, K., Zhou, M., Si, H., & Ma, J. (2023) · Life Sciences · doi:10.1016/j.lfs.2023.122229 · Cited by 17
Faecal Microbiota Transplantation Alleviates Ferroptosis after Ischaemic Stroke
Wei, J., Wang, G., Lai, M., Zhang, Y., Li, F., Wang, Y., & Tan, Y. (2024) · Neuroscience · doi:10.1016/j.neuroscience.2024.01.021 · Cited by 16
Qi, Y., Dong, Y., Chen, J., Xie, S., Ma, X., Yu, X., Yu, Y., & Wang, Y. (2024) · Experimental Neurology · doi:10.1016/j.expneurol.2024.115001 · Cited by 17
Cao, H., Tian, Q., Chu, L., Wu, L., Gao, H., & Gao, Q. (2024) · Food & Function · doi:10.1039/d4fo01878h · Cited by 16
The role of brain–liver–gut Axis in neurological disorders
Li, P., Xie, L., Yang, W., Feng, S., Mao, W., Ye, L., Cheng, H., Wu, X., & Mao, X. (2025) · Burns & Trauma · doi:10.1093/burnst/tkaf011 · Cited by 16
Gao, X., Ding, J.-E., Xie, J., & Xu, H. (2025) · Acta Pharmacologica Sinica · doi:10.1038/s41401-025-01499-6 · Cited by 16
Hajare, S., & Kulkarni, Y. A. (2025) · Brain Research · doi:10.1016/j.brainres.2025.149975 · Cited by 18
Yang, Y., Wang, Q., Wang, Z., Wang, Y., Liu, B., Zhang, Y., Mao, X., & Sun, H. (2025) · Journal of Lipid Research · doi:10.1016/j.jlr.2025.100944 · Cited by 21
Gut-to-brain spreading of pathology in synucleinopathies: A focus on molecular signalling mediators
Schmitt, V., Masanetz, R. K., Weidenfeller, M., Ebbinghaus, L. S., Süß, P., Rosshart, S. P., von Hörsten, S., Zunke, F., Winkler, J., & Xiang, W. (2023) · Behavioural Brain Research · doi:10.1016/j.bbr.2023.114574 · Cited by 16
Gut microbiota and cerebrovascular diseases: a Mendelian randomization study
Qin, H., Yang, F., Hao, P., & Zhang, X. (2023) · Frontiers in Microbiology · doi:10.3389/fmicb.2023.1228815 · Cited by 15
Regulation of Pain Perception by Microbiota in Parkinson Disease
Manjarres, Z., Calvo, M., & Pacheco, R. (2023) · Pharmacological Reviews · doi:10.1124/pharmrev.122.000674 · Cited by 15
Fecal Microbiota Transplantation Attenuates Frailty via Gut-Muscle Axis in Old Mice
Zhu, M., Huang, Y., Wang, Z., Jin, Z., Cao, J., Zhong, Q., & Xiong, Z. (2024) · Aging and Disease · doi:10.14336/ad.2024.0321 · Cited by 15
Sadowski, K. A., Zając, W., Milanowski, Ł., Koziorowski, D., & Figura, M. (2024) · International Journal of Molecular Sciences · doi:10.3390/ijms25147741 · Cited by 22
Peng, L., Zhang, Z., Li, Q., Song, Z., Yan, C., & Ling, H. (2024) · Heliyon · doi:10.1016/j.heliyon.2024.e39217 · Cited by 18
Ju, T., Zhang, Y., Liu, L., Zhao, X., Li, X., Liu, C., Sun, S., & Wu, L. (2025) · Neural Regeneration Research · doi:10.4103/nrr.nrr-d-24-01419 · Cited by 16
Pan, L., Zhu, J., Wang, S., Zhuang, H., Zhang, S., Huang, Z., Cai, F., Song, Z., Liu, Y., Liu, W., et al. (2025) · EBioMedicine · doi:10.1016/j.ebiom.2025.105829 · Cited by 16
Mehboodi, M., Namdari, M. P., Abdollahi, Z., Mobarezi, Z., Kiani, M., Chamani, F., Khanbabaie, H., Rabiei, S., Maleki, M. H., Sanati, H., et al. (2025) · Microbial Pathogenesis · doi:10.1016/j.micpath.2025.107905 · Cited by 15
Wen, L., Miao, X., Jia, D., Tong, X., Wu, Y., He, Y., & Zheng, F. (2023) · Frontiers in Nutrition · doi:10.3389/fnut.2023.1113099 · Cited by 14
He, Z.-Q., Huan, P.-F., Wang, L., & He, J. (2023) · Neurochemical Research · doi:10.1007/s11064-023-04004-9 · Cited by 15
Nassar, A., Kodi, T., Satarker, S., Gurram, P. C., Fayaz, S. M., & Nampoothiri, M. (2023) · Gene · doi:10.1016/j.gene.2023.147898 · Cited by 15
Ren, L., Liang, H., Li, Z., Yang, X., Zhang, H., Sun, N., Huang, D., Feng, J., Wu, Y., Xiong, L., et al. (2024) · Neuroscience · doi:10.1016/j.neuroscience.2024.01.012 · Cited by 15
Yu, W., Zhu, Z., & Tang, F. (2024) · Molecular Neurobiology · doi:10.1007/s12035-024-04228-y · Cited by 16
He, Y., Zhao, J., Ma, Y., Yan, X., Duan, Y., Zhang, X., Dong, H., Fang, R., Zhang, Y., Li, Q., et al. (2024) · Journal of Neuroinflammation · doi:10.1186/s12974-024-03145-0 · Cited by 15
Zou, S., Li, Y., Zou, Q., Yang, M. S., Li, H., Niu, R., Lai, H., Wang, J., Yang, X., & Zhou, L. (2024) · Frontiers in Microbiology · doi:10.3389/fmicb.2024.1403892 · Cited by 14
Zhang, W., Xie, J., Wang, Z., Zhong, Y., Liu, L., Liu, J., Zhang, W., Pi, Y., Tang, F., Liu, Z., et al. (2025) · Microbiological Research · doi:10.1016/j.micres.2025.128047 · Cited by 17
Chen, M., Zhang, Y., Hou, L., Zhao, Z., Tang, P., Sun, Q., Zhao, J., & Wang, Q. (2025) · npj Parkinson s Disease · doi:10.1038/s41531-025-00892-6 · Cited by 16
Self-citationHuang, J., Wang, X., Zhang, J., Li, Q., Zhang, P., Wu, C., Jia, Y., Su, H., & Sun, X. (2024) · World Allergy Organization Journal · doi:10.1016/j.waojou.2024.100969 · Cited by 13
Guo, M., Gao, H., Wang, Y., & Xiang, Y. (2025) · Frontiers in Neuroscience · doi:10.3389/fnins.2025.1574512 · Cited by 18
TLR2 deficiency is beneficial at the late phase in MPTP-induced Parkinson’ disease mice
He, Y., Zhao, J., Dong, H., Zhang, X., Duan, Y., Ma, Y., Yu, M., Fei, J., & Huang, F. P. (2023) · Life Sciences · doi:10.1016/j.lfs.2023.122171 · Cited by 13
Sui, Y., Feng, X., Ma, Y., Zou, Y., Liu, Y., Huang, J., Zhu, X., & Wang, J. (2024) · CNS Neuroscience & Therapeutics · doi:10.1111/cns.14840 · Cited by 12
Zhang, L., Jiang, Z., Hu, S., Ni, H., Zhao, Y., Tan, X., Yi, L., Na, R., Li, Y., Du, Q., et al. (2024) · Inflammation · doi:10.1007/s10753-024-02133-z · Cited by 15
Feng, M., Zou, Z., Shou, P., Peng, W., Liu, M., & Li, X. (2024) · Frontiers in Aging Neuroscience · doi:10.3389/fnagi.2024.1479343 · Cited by 14
Jiang, S.-T., Wang, M., Gao, L., Zhang, Q., Tang, C., & Dong, Y. (2025) · Journal of Affective Disorders · doi:10.1016/j.jad.2025.03.195 · Cited by 15
Liu, Y., Luo, R., Sun, Z., Zhang, Y., Guo, Y., Chen, Y., Li, L., & Yue, Z. (2025) · Biology · doi:10.3390/biology14050523 · Cited by 12
Ai, P., Xu, S., Yuan, Y., Xu, Z., He, X., Mo, C., Zhang, Y., Yang, X., & Xiao, Q. (2025) · International Journal of Molecular Sciences · doi:10.3390/ijms26115282 · Cited by 14
Wu, B., Tian, X.-Y., Ni, W., Gao, H.-X., Wang, Y.-W., Zhang, L.-H., Li, Y., Lv, Y.-L., Song, Y., Yan, Y., et al. (2025) · Journal of Hazardous Materials · doi:10.1016/j.jhazmat.2025.139287 · Cited by 12
Microglia in the crosstalk between peripheral and central nervous systems in Parkinson’s disease
Li, T., Qiu, T., Jiang, F., Cai, H., & Le, W. (2025) · Translational Neurodegeneration · doi:10.1186/s40035-025-00531-3 · Cited by 15
Emerging nanotherapeutic strategies targeting gut-X axis against diseases
Sun, A., Liu, H., Sun, M., Yang, W., Liu, J., Lin, Y., Shi, X., Sun, J. Y., & Liu, L. (2023) · Biomedicine & Pharmacotherapy · doi:10.1016/j.biopha.2023.115577 · Cited by 13
Feng, Z., Zhang, Y., Lai, Y., Jia, C., Wu, F., & Chen, D. (2024) · Frontiers in Immunology · doi:10.3389/fimmu.2023.1277554 · Cited by 11
Tian, R., Wang, X., Tang, S., Zhao, L., Hao, Y., Li, R., & Zhou, X. (2024) · Biomedicine & Pharmacotherapy · doi:10.1016/j.biopha.2024.116752 · Cited by 12
Peng, Y., Huang, Y., Li, H., Li, C., Wu, Y., Chen, Z., Wang, X., Liao, F., & Miao, C. (2024) · Frontiers in Pharmacology · doi:10.3389/fphar.2024.1422245 · Cited by 12
Zhang, Q., Liu, Y., Tang, R., Kong, S., Lv, D., Li, H., Yang, H., & Lin, L. (2024) · Carbohydrate Polymer Technologies and Applications · doi:10.1016/j.carpta.2024.100567 · Cited by 12
Li, L., Zhao, Y., Yang, W., Fan, Y., Han, L., Sheng, J., Tian, Y., & Gao, X. (2025) · International Journal of Molecular Sciences · doi:10.3390/ijms26052079 · Cited by 12
Zhao, Z., Wang, R., Ge, H., Hou, L., Hatano, T., Hattori, N., Su, H., Wang, Q., & Zhao, J. (2025) · Free Radical Biology and Medicine · doi:10.1016/j.freeradbiomed.2025.02.048 · Cited by 12
Self-citationYan, K., Sun, X., Wang, X., Zheng, J., & Yu, H. (2025) · Nutrients · doi:10.3390/nu17162603 · Cited by 11
Wu, W., Zhong, W., Lin, Z., & Yan, J. (2023) · Clinical and Experimental Nephrology · doi:10.1007/s10157-023-02332-2 · Cited by 10
Overview of the Gut Microbiome
Blackmer‐Raynolds, L., & Sampson, T. R. (2023) · Seminars in Neurology · doi:10.1055/s-0043-1771463 · Cited by 11
Enteric glia as a player of gut-brain interactions during Parkinson’s disease
Thomasi, B. B. D. M., Valdetaro, L., Ricciardi, M. C., de Carvalho, M. G., Tavares, I. F., & Gomes, A. L. T. (2023) · Frontiers in Neuroscience · doi:10.3389/fnins.2023.1281710 · Cited by 12
Gut-directed therapy in Parkinson’s disease
Benvenuti, L., Salvo, C. D., Bellini, G., Seguella, L., Rettura, F., Esposito, G., Antonioli, L., Ceravolo, R., Bernardini, N., Pellegrini, C., et al. (2024) · Frontiers in Pharmacology · doi:10.3389/fphar.2024.1407925 · Cited by 13
Xu, B., Zhang, L., Wu, D., Qi, Z., Cao, J., Li, W., Fan, L., Shi, Y., Wu, Y., & Li, G. (2024) · Food & Function · doi:10.1039/d4fo01032a · Cited by 13
Self-citationPesticides and the Gut Microbiota: Implications for Parkinson’s Disease
Ghosh, N., Sinha, K., & Sil, P. C. (2024) · Chemical Research in Toxicology · doi:10.1021/acs.chemrestox.4c00057 · Cited by 11
Study on the anti-Parkinson's disease activity mechanism and preparation of panaxadiol
Xu, L., Zhang, Z., Feng, Z., Niu, S., Yang, L., Xiao, B., Jin, X., Ma, C., Fan, H., Xiao, S., et al. (2024) · Phytomedicine · doi:10.1016/j.phymed.2024.156296 · Cited by 11
Qiu, Y., Ye, C., Li, Q., Jiang, L.-C., Zhou, C., Fu, H., Li, D., Chen, D., & Shen, F. (2025) · npj Science of Food · doi:10.1038/s41538-025-00473-0 · Cited by 12
Du, L., Ding, X., Zhang, W., Huang, L., Lü, H., Jian, T., Li, J., Gai, Y., Meng, X., Niu, G., et al. (2025) · npj Science of Food · doi:10.1038/s41538-025-00526-4 · Cited by 12
The role of the gut microbiota in neuropsychiatric disorders and therapy
Zhang, F., Ding, K., Zhang, L., Liu, D., Dong, X., Wang, M., Zhou, F.-L., Sun, Y., Zhang, W., Yu, Y., et al. (2025) · Ageing Research Reviews · doi:10.1016/j.arr.2025.102894 · Cited by 11
Wang, Z., Shi, L. S., Li, H., Wei, S., Li, J., & Yuan, L. (2022) · Journal of Agricultural and Food Chemistry · doi:10.1021/acs.jafc.2c04526 · Cited by 11
Gut-oriented disease modifying therapy for Parkinson's disease
Lin, C., Lai, H., & Wu, M. (2022) · Journal of the Formosan Medical Association · doi:10.1016/j.jfma.2022.09.010 · Cited by 11
Liu, Z., Zhao, J., Yang, S., Zhang, Y., Song, L., Wu, N., & Liu, Z. (2022) · Frontiers in Nutrition · doi:10.3389/fnut.2022.836500 · Cited by 11
Jin, X., Wei, J., Min, X., Fan, Y., Yuan, Z., Du, Z., Su, Z., Xun, T., Du, Q., Liang, T., et al. (2025) · iScience · doi:10.1016/j.isci.2025.114185 · Cited by 15
Techaniyom, P., Korsirikoon, C., Rungruang, T., Pakaprot, N., Prombutara, P., Mukda, S., Kettawan, A., & Kettawan, A. (2024) · Food Science & Nutrition · doi:10.1002/fsn3.4265 · Cited by 13
Almheiri, R. T., Hajjar, B. M., Alkhaaldi, S. M. I., Rabeh, N., Aljoudi, S., Abd‐Elrahman, K. S., & Hamdan, H. (2025) · Journal of Translational Medicine · doi:10.1186/s12967-025-06201-2 · Cited by 12
Nagpal, D., Nema, S., Nagpal, S., Pandey, M. M., Kaushik, D. K., & Kathuria, H. (2025) · Antioxidants · doi:10.3390/antiox14091078 · Cited by 13
Aziz, N., Wal, P., Patel, A., & Prajapati, H. (2024) · Naunyn-Schmiedeberg s Archives of Pharmacology · doi:10.1007/s00210-024-03109-4 · Cited by 12
Li, H., Zhang, H., Hua, W., Liu, H., Zhang, B., Dong, H., Liu, J., Zhou, Y., Yang, P., & Jing, M. (2024) · Journal of Stroke and Cerebrovascular Diseases · doi:10.1016/j.jstrokecerebrovasdis.2024.107814 · Cited by 9
Zheng, X., Wang, Y., Zhou, X., Deng, T., Zhao, Y., Fu, Z., Wei, Y., Ma, W., Zhang, S., Guan, W., et al. (2024) · Animal nutrition · doi:10.1016/j.aninu.2024.04.020 · Cited by 9
Shang, M., Ning, J., Zang, C., Ma, J., Yang, Y., Jiang, Y., Chen, Q., Dong, Y., Wang, J., Li, F., et al. (2024) · Acta Pharmaceutica Sinica B · doi:10.1016/j.apsb.2024.10.011 · Cited by 9
Self-citationOyovwi, M. O., Joseph, G. U., Oyekanmi, B. A., Odokuma, E. I., & Ogenma, U. T. (2024) · OBM Neurobiology · doi:10.21926/obm.neurobiol.2404254 · Cited by 10
Li, Y., Zhang, J., Lei, Y., Chang, M., Xu, J., & Tang, S. (2025) · Journal of Ethnopharmacology · doi:10.1016/j.jep.2025.119435 · Cited by 10
Tang, C., Wang, J., Ge, M., Fu, L., Huang, J., Yadav, H., Shi, J., Feng, S., & Wu, F. (2025) · International Immunopharmacology · doi:10.1016/j.intimp.2025.114666 · Cited by 9
An update on the involvement of inflammatory mediators in Parkinson’s disease pathogenesis
Verma, O., Faizan, M., Goswami, S., & Singh, M. P. (2025) · Archives of Toxicology · doi:10.1007/s00204-025-04088-y · Cited by 11
Xu, Y., Mo, Y., Zhou, W., Qin, M., Li, M., Yin, G., Yu, H., Chen, Y., Du, H., Jin, Y., et al. (2025) · Toxicology · doi:10.1016/j.tox.2025.154220 · Cited by 10
Zhang, L., Chen, X., Li, J., Hou, Q., Song, J., Fu, X., Liu, Y., Jin, B., Feng, Y., Zhang, W., et al. (2025) · International Journal of Biological Macromolecules · doi:10.1016/j.ijbiomac.2025.147728 · Cited by 9
Zhao, Z., Chen, J., Liu, Y., Wang, S., Zhao, D., Bai, C., Wu, M., Hu, G., Fu, Y., Fang, L., et al. (2025) · iMeta · doi:10.1002/imt2.70076 · Cited by 9
Self-citationGut Microbiome as a Source of Probiotic Drugs for Parkinson’s Disease
Poluektova, E. U., Stavrovskaya, A. V., Pavlova, A. K., Yunes, R. А., Марсова, М. В., Koshenko, T. A., Illarioshkin, S. N., & Даниленко, В. Н. (2025) · International Journal of Molecular Sciences · doi:10.3390/ijms26199290 · Cited by 13
Faecal microbiota transplant for Parkinson’s disease: promises and future directions
Tan, E. K., Wang, J. D. J., Pettersson, S., Wang, Q., Takahashi, R., Poewe, W. H., Jankovic, J. J., & Rascol, O. (2025) · Brain · doi:10.1093/brain/awaf419 · Cited by 10
Pawlowski, K. D., David, B. T., & Fessler, R. G. (2022) · Journal of Neurotrauma · doi:10.1089/neu.2022.0264 · Cited by 9
Notaristefano, G., Ponziani, F. R., Ranalli, M., Diterlizzi, A., Policriti, M. A., Stella, L., Zompo, F. D., Fianchi, F., Picca, A., Petito, V., et al. (2023) · American Journal of Physiology-Endocrinology and Metabolism · doi:10.1152/ajpendo.00281.2023 · Cited by 9
Chen, X., Wei, J., Zhang, Y., Zhang, Y., & Zhang, T. (2024) · Journal of the Neurological Sciences · doi:10.1016/j.jns.2024.122889 · Cited by 10
Gut microbiota: the indispensable player in neurodegenerative diseases
Li, S., Cai, Y., Wang, S., Luo, L., Zhang, Y., Huang, K., & Guan, X. (2024) · Journal of the Science of Food and Agriculture · doi:10.1002/jsfa.13509 · Cited by 11
Microglia and Microbiome-Gut-Brain Axis
Filho, A. M. C., Gomes, N. S., Lós, D. B., Leite, I. B., Tremblay, M., & Macêdo, D. S. (2024) · Advances in neurobiology · doi:10.1007/978-3-031-55529-9_17 · Cited by 8
Chen, L., Cao, H., Zhang, X., Du, X., Guan, Y., Li, M., Chang, A. K., He, X., Li, X., & Bi, X. (2024) · Food & Function · doi:10.1039/d3fo05278h · Cited by 9
Gut microbiota as a potential therapeutic target for children with cerebral palsy and epilepsy
Wu, H., Huang, C., & Xiong, S. (2024) · Brain and Development · doi:10.1016/j.braindev.2024.09.002 · Cited by 9
Yin, X., Li, G., Ji, F., Wang, M., Gao, Y., Li, F., Wang, Z., Han, G., & Gao, Z. (2024) · Molecular Neurobiology · doi:10.1007/s12035-024-04560-3 · Cited by 9
Self-citationSai, Y., Ge, W., Li, Z., Zhang, Q., Xiao, J., Shan, Y., Ye, W., Liu, H., Liu, S., Ye, F., et al. (2024) · Current Research in Toxicology · doi:10.1016/j.crtox.2024.100212 · Cited by 8
Yang, F., Yan, Q., Wang, Y., Li, Q., Wang, J., Zeng, X., Pi, Y., Zhang, M., & Wei, L. (2025) · Phytomedicine · doi:10.1016/j.phymed.2025.156447 · Cited by 9
Li, B., Liu, M., Du, W., Wang, S., Xu, Z., Zhang, X., Zhang, Y., & Hua, S. (2025) · BMC Veterinary Research · doi:10.1186/s12917-025-04500-w · Cited by 8
Beltrán-Velasco, A. I. (2025) · Metabolites · doi:10.3390/metabo15020128 · Cited by 10
Gut microbiota: A new window for the prevention and treatment of neuropsychiatric disease
Tang, Y., Zhang, Y., Chen, C., Cao, Y., Wang, Q., & Tang, C. (2025) · Journal of Central Nervous System Disease · doi:10.1177/11795735251322450 · Cited by 10
Metadata
- Authors
- Zhao, Z., Ning, J., Bao, X.-Q., Shang, M., Ma, J., Li, G., & Zhang, D.
- Affiliations
- Chinese Academy of Medical Sciences & Peking Union Medical College (CN)
- Corresponding author
- Zhang, Dan
- Venue
- Microbiome
- Published
- 2021-11-17
- Volume
- 9
- Issue
- 1
- Pages
- 226-226
- ISSN
- 2049-2618 (ISSN-L)
- PMC
- PMC8597301
- OpenAlex
- W3211876735
- Cited by
- 616
- References
- 100
- Citations by year
- 2026: 122 · 2025: 179 · 2024: 183 · 2023: 91 · 2022: 39
- FWCI
- 37.52
- Type
- journal article
- Language
- en
- Open access
- gold
- doi.org
- Locations
- Microbiome (publishedVersion, cc-by)
- PubMed Central (publishedVersion, cc-by)
- PubMed (publishedVersion)
- DOAJ (DOAJ: Directory of Open Access Journals) (submittedVersion, cc-by-sa)
- Funders
- National Sciences Foundation of China (81773718, 81630097, 81773589)
- The National Key Research and Development Program of China (SQ2018YFA090025-04)
- CAMS Innovation Fund for Medical Sciences (2016-I2M-3-011)
- The Drug Innovation Major Project (2018ZX09711001-003-020, 2018ZX09711001-003-005, 2018ZX09711001-008-005)
- CAMS The Fundamental Research Funds for the Central Universities (2018RC350002)
- CAMS & PUMC Innovation Fund for Graduate (2019-1007-23)
- Topics
- Health Sciences › Medicine › Clinical Neurology › Parkinson's Disease Mechanisms and Treatments
- Life Sciences › Biochemistry, Genetics and Molecular Biology › Molecular Biology › Gut microbiota and health
- Life Sciences › Neuroscience › Neurology › Neuroinflammation and Neurodegeneration Mechanisms
- Keywords
- Parkinson's disease, fecal microbiota transplantation, microbiota-gut-brain axis, rotenone-induced neurotoxicity, gut dysbiosis, lipopolysaccharide, TLR4/MyD88/NF-κB signaling, neuroinflammation, blood-brain barrier, dopaminergic neuron damage, Akkermansia, Desulfovibrio, intestinal barrier dysfunction, gastrointestinal dysfunction
- MeSH terms
- Gastrointestinal Microbiome, Fecal Microbiota Transplantation, Brain-Gut Axis, Animals, Inflammation, Lipopolysaccharides, Mice, Inbred C57BL, Parkinson Disease, Rotenone, Signal Transduction, Toll-Like Receptor 4, Mice
About these checks
Registry, retraction, Cites and statistics results are computed, not judged, with one exception: a printed reference that no index lists is read once by a model before it counts as a citation error. Claims are extracted by a model and kept only when their quote appears verbatim in the text; each cited source is then checked, with a model’s help, for whether it says what the claim relies on. Those verdicts can be wrong — read the claim’s quote and the cited source before relying on one.
Statistics and arithmetic are recomputed, not judged.
Confidence bands are shown only for fields calibrated on our annotated test set. None is calibrated yet, so no band is shown.
What counts as a claim ›How we measure confidence ›How we check this ›
Are you an author, or do you see a problem with this page? Request a review
