

The DOI matches its Crossref record; 39 of the 39 references it cites were found in a registry or an index; 12 of the 35 sources its claims cite were checked for support.
Using an adaptive learning tool to improve student performance and satisfaction in online and face-to-face education for a more personalized approach
Open accessAbstract
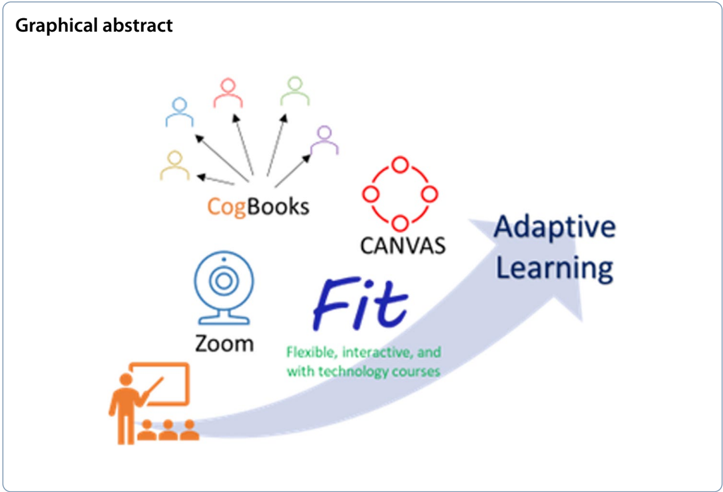
It is becoming increasingly clear that not all students require the same education, and the requirement of personalized education is increasingly in demand. The incorporation of adaptive learning (AL) has increased in recent years. However, research on this subject is still evolving at the university level. In this study, we investigated the impact of integrating an AL tool (CogBooks®) in a university course (statistics for decision making) taught in an innovative online modality called FIT (flexible, interactive, and with technology), in which the course is designed in the CANVAS® platform and uses Zoom® as a means of communication with students. Learning outcomes were compared between the FIT courses with or without AL and between AL strategies in online and face-to-face courses. It was clear that AL improved the students’ achievement regardless of the modality. In addition, we conclude that students achieve better in AL courses in the classroom than in distance courses. Satisfaction surveys favor a preference for FIT courses with AL over classroom classes with AL. Our results suggest that AL is a solid strategy for teaching undergraduate courses. Graphical abstract
Overview
CoChat Summary
TL;DR
This study evaluated integrating the adaptive learning tool CogBooks into a university business statistics course across FIT online and face-to-face modalities. It found that adaptive learning improved student achievement overall, with face-to-face adaptive courses generally producing higher exam and final grades than FIT adaptive courses, while satisfaction tended to favor FIT courses with adaptive learning over classroom adaptive courses.
Key findings
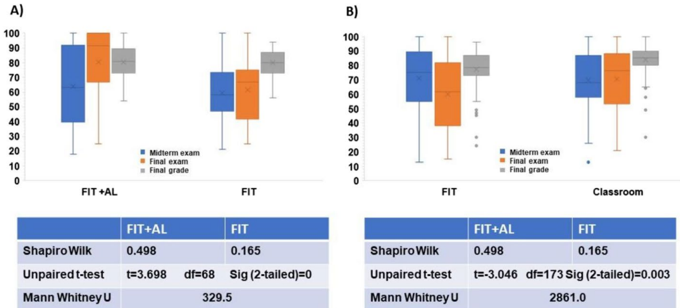
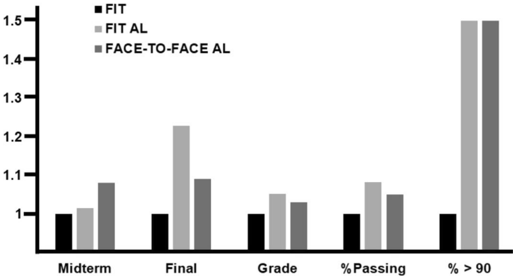
- In August–December Year 1, FIT + AL students had higher average midterm, final exam, and final grades than FIT-only students: 63.9 vs. 59.3, 80.6 vs. 61.4, and 80.3 vs. 79.9, respectively. The FIT + AL group had a lower passing rate (89.2% vs. 97%) but a higher percentage of grades above 90 (24.3% vs. 15.2%).
- In January–May Year 2, face-to-face + AL students outperformed FIT + AL students on final exam average (70.4 vs. 59.8), final grade (83.7 vs. 77.3), passing rate (92.4% vs. 85.7%), and grades above 90 (29.3% vs. 15.5%).
- In another comparison reported in Table 10, face-to-face + AL again exceeded FIT + AL on final exam average (77.9 vs. 71.4), final grade (84.2 vs. 80.8), passing rate (96.1% vs. 90.8%), and grades above 90 (31.8% vs. 18.5%).
- Satisfaction survey results favored FIT courses with AL over FIT courses without AL, and the paper reports that FIT courses with AL were preferred over face-to-face courses with AL.
Methods
- Comparative quantitative design in a single course, “Statistical Methods for Decision Making,” at Tecnologico de Monterrey over three semesters; 24 groups and 530 students total, with voluntary response sampling of instructors and groups.
- Year 1 compared FIT vs. FIT + AL; Year 2 compared FIT + AL vs. face-to-face + AL. The adaptive tool was CogBooks, integrated with CANVAS and Zoom for FIT courses; exams were common multiple-choice midterm and final exams taken in person.
- Analysis used Shapiro-Wilks normality tests, Student’s t-tests and Mann-Whitney U tests, Alpha-Cronbach reliability on final grades (0.779, 0.7694, and 0.8190 across periods), and Student Opinion Survey (SOS) responses on a 0–10 Likert scale, analyzed in SPSS version 25.
Limitations
- The paper states limitations including a study period of only three semesters, focus on a single subject, a private university with a specific student profile and strong educational-technology focus, and the fact that not all instructors taught in all three modalities, so instructor characteristics may influence results.
- The paper also states that students were first-semester students, results may differ for more advanced students, and because all students took the same quizzes and tests, scores can be compared only within the same test and not across different tests or scales.
- Evident from the text: instructor and group assignment was voluntary and only partly randomized, group sizes varied, and SOS response rates were 80–100% rather than complete, which may introduce selection or response bias.
Model-written summary. Check it against the paper before relying on it.
Integrity signals
Registry
Cites
Statistics
Figures

Verification
Claims the paper makes
12 Valid · 0 Not valid · 23 Not checked · 66 Own results and interpretations
The cited sources support only part of this claim — read each source’s verdict below.
In the paper
“Additionally, students who took courses with AL performed better in the following calculus courses”
§ Smart Learning Environments > Introduction
What the sources say
- Partly supportedcites Daines et al., 2016 sourceExperimental — accuracy not yet measured
The Results report that overall Calculus I pass rates rose from 69% to 86% after the adaptive-learning pilot. But students who took the adaptive-learning prerequisites passed Calculus I at about the same rate as those who took the prerequisites before the pilot (79% versus 80%), so the paper does not show that those students performed better. (LLM, conf=0.87)
plainstates a cause- Asserted: passes — The authors put it forward as true.
- Checkable: passes — It can be checked against evidence.
- Load-bearing: passes — The paper’s conclusions depend on it.
- Based: passes — The paper gives a reason why it holds.
- Partly supported
Every source the paper cites for this claim was checked and supports it.
In the paper
“A similar result was obtained by Hwang et al. (2020) when comparing the results of mathematics tests of an experimental group using an AL strategy with the results of a control group.”
§ Smart Learning Environments > Discussion
What the sources say
- Supportedcites Hwang et al., 2020 source
Section 4.2 identifies an experimental group using an adaptive learning system and a control group using a conventional system. Section 5.1 compares their mathematics achievement test scores and reports that experimental group A scored significantly higher than the control group. (LLM, conf=0.94)
plain- Asserted: passes — The authors put it forward as true.
- Checkable: passes — It can be checked against evidence.
- Load-bearing: unclear — It is unclear whether the paper’s conclusions depend on it.
- Based: passes — The paper gives a reason why it holds.
- Supported
A result the paper reports from its own data — it cites no other source for it, so there is none to check. The quote shows it is in the paper.
In the paper
“when the same instructor (in this case, I2) taught the same course during the same semester in two different modalities, FIT and in-person (classroom), both with AL, the opinion of the students was consistently better in the classroom than in the FIT mode.”
§ Smart Learning Environments > Results
plainstates an associationSingle case- Asserted: passes — The authors put it forward as true.
- Checkable: passes — It can be checked against evidence.
- Load-bearing: unclear — It is unclear whether the paper’s conclusions depend on it.
- Based: passes — The paper gives a reason why it holds.
- Rests on 2 assumptions not shown here.
A result the paper reports from its own data — it cites no other source for it, so there is none to check. The quote shows it is in the paper.
In the paper
“the percentage of passers with grades higher than 90/100 is higher in the FIT + AL (24.3%) compared to FIT (15.2%).”
§ Smart Learning Environments > Results
plainstates an association- Asserted: passes — The authors put it forward as true.
- Checkable: passes — It can be checked against evidence.
- Load-bearing: passes — The paper’s conclusions depend on it.
- Based: passes — The paper gives a reason why it holds.
- Rests on an assumption not shown here.
A result the paper reports from its own data — it cites no other source for it, so there is none to check. The quote shows it is in the paper.
In the paper
“Satisfaction surveys favor a preference for FIT courses with AL over classroom classes with AL.”
§ Smart Learning Environments > Abstract
plainstates an association- Asserted: passes — The authors put it forward as true.
- Checkable: passes — It can be checked against evidence.
- Load-bearing: passes — The paper’s conclusions depend on it.
- Based: passes — The paper gives a reason why it holds.
- Rests on an assumption not shown here.
43 more claims
Create a free account to see all 101 claims and every source verdict.
- It may state two separate claims as one. 32
- Probably not a substantial claim. 29
- The quote only partly states this claim. 1
Self-check
Percentages, sums and reported differences re-computed from the paper’s own numbers.
Each contradiction between two passages listed here was confirmed by an independent check.
Rated major: it would touch a result — a value a result rests on, reported and recomputed p-values on opposite sides of the significance level, two passages that conflict with no sign which is right, or a cited work retracted before this paper was published.
In the paper
§ Smart Learning Environments > Discussion
“However, our study suggests that using an AL strategy improves the grades and the percentage of passing, regardless of the mode of delivery.”
§ Smart Learning Environments > Results
“the percentage of students approved (with a grade higher than or equal to 70) in the FIT course (97%) is higher than the FIT + AL course (89.2%)”
Rated major: it would touch a result — a value a result rests on, reported and recomputed p-values on opposite sides of the significance level, two passages that conflict with no sign which is right, or a cited work retracted before this paper was published.
In the paper
§ Smart Learning Environments > Limitations and future work
“| Semester AUG-DIC | FIT | | | FIT + AL | | | | --- | --- | --- | --- | --- | --- | --- | | | *I1 | I2 | AVG | I3 | I4 | AVG |”
§ Smart Learning Environments > Limitations and future work
“| I4 FIT | 8.79 | 9.21 | 8.93 | 9.00 | 9.07 | 8.79 | 8.79 | 0.64 | | I3 FIT | 8.13 | 8.20 | 7.73 | 8.53 | 8.00 | 8.40 | 7.13 | 0.53 | | I2 FIT + AL | 9.59 | 9.53 | 9.76 | 9.76 | 9.76 | 9.71 | 9.65 | 0.82 | | I1 FIT + AL | 9.25 | 9.00 | 9.94 | 9.94 | 9.47 | 9.44 | 9.38 | 0.75 |”
Rated minor: it would not touch a result — a value no result rests on, a p-value that stays on the same side of the significance level, or a conflict that is clerical, resolved elsewhere in the paper, or outside its own findings.
In the paper
§ Smart Learning Environments > Results
“when the same instructor (in this case, I2) taught the same course during the same semester in two different modalities, FIT and in-person (classroom), both with AL, the opinion of the students was consistently better in the classroom than in the FIT mode.”
§ Smart Learning Environments > Limitations and future work
“| I2 classroom AL | 9.46 | 9.39 | 9.64 | 9.36 | 9.61 | 9.50 | 9.39 | 0.56 |”
Citations
Cites
How to Design and Evaluate Research in Education
Fraenkel, J. R., & Wallen, N. E. (1990) · Cited by 14,998
Descriptive statistics and normality tests for statistical data
Gupta, A., Mishra, P., Pandey, C., Singh, U., Sahu, C., & Keshri, A. (2019) · Annals of Cardiac Anaesthesia · doi:10.4103/aca.aca_157_18 · Cited by 2,628 · cited 2×
“These tests were included in our study (Mishra et al., 2019).”
MethodEssentials of Psychological Testing
Urbina, S. (2014) · doi:10.1002/9781394259458 · Cited by 1,845
Literature Review of Information Technology Adoption Models at Firm Level
(2011) · Portuguese National Funding Agency for Science, Research and Technology (RCAAP Project by FCT) · Cited by 1,341
Xie, H., Chu, H.-C., Hwang, G.-J., & Wang, C.-C. (2019) · Computers & Education · doi:10.1016/j.compedu.2019.103599 · Cited by 713 · cited 1×
“There is a lack of quantitative studies that demonstrate a difference in student’s grades and satisfaction when using integrated (sequence and structure) and contextualized AL strategies in higher education (Xie et al., 2019).”
BackgroundPeng, H., Ma, S., & Spector, J. M. (2019) · Smart Learning Environments · doi:10.1186/s40561-019-0089-y · Cited by 548 · cited 2×
“Personalized learning refers to an educational strategy where the objectives, the sequence of the content, the learning pace, and the instruction can vary according to the student’s needs (Peng et al., 2019).”
BackgroundAlamri, H., Lowell, V., Watson, W., & Watson, S. L. (2020) · Journal of Research on Technology in Education · doi:10.1080/15391523.2020.1728449 · Cited by 323 · cited 1×
“To meet each student’s educational needs to improve their knowledge and increase their engagement, personalized learning emerged (Alamri et al., 2020; Walkington & Bernacki, 2020).”
BackgroundMartin, F., Chen, Y., Moore, R. L., & Westine, C. D. (2020) · Educational Technology Research and Development · doi:10.1007/s11423-020-09793-2 · Cited by 306 · cited 1×
“According to Martin et al. (2020), the objective of AL is to generate a unique learning experience taking into account the individual differences of the student, either defined as a process (focusing on how the contents are presented to the student, which is adapted depending on the increase in the…”
BackgroundWalkington, C., & Bernacki, M. L. (2020) · Journal of Research on Technology in Education · doi:10.1080/15391523.2020.1747757 · Cited by 291 · cited 1×
“To meet each student’s educational needs to improve their knowledge and increase their engagement, personalized learning emerged (Alamri et al., 2020; Walkington & Bernacki, 2020).”
BackgroundAlamri, H. A., Watson, S., & Watson, W. (2021) · TechTrends · doi:10.1007/s11528-020-00530-3 · Cited by 285 · cited 2×
“Nowadays, technological developments present an opportunity to generate customized teaching by allowing students to choose their learning path (Alamri et al., 2021).”
Background
Research works printed but not linked: 3
- Dziuban, C., Moskal, P., Johnson, C., & Evans, D. (2017). Adaptive learning: A tale of two context. Current Issues in Emerging eLearning, 4(1), 25–62.
- Savio-Ramos, C. (2015). A Study of the Self-Efficacy of Personalized Learning as a Remediation Tool in Algebra. Ph.D. Dissertation, Arizona State University. Retrieved from https://repository.asu.edu/attachments/162099/content/SavioRamos_asu_0010E_15384.pdf. Accessed12 Jun 2022.
- Vasyliuk, A., & Lytvyn, T. B. V. (2023). Design and Implementation of a Ukrainian-Language Educational Platform for Learning Programming Languages. https://ceur-ws.org/Vol-3426/paper32.pdf. Accessed 28 September 2023.
Cited by
AI‐driven adaptive learning for sustainable educational transformation
Strielkowski, W., Grebennikova, V., Lisovskiy, A., Rakhimova, G., & Vasileva, T. (2025) · Sustainable Development · doi:10.1002/sd.3221 · Cited by 581
Improving the learning-teaching process through adaptive learning strategy
Rincón-Flores, E. G., Castano, L., Solis, S. L. G., Olmos, O., Rodríguez-Hernández, C. F., Lara, L. A. C., & Aldape, P. (2024) · Smart Learning Environments · doi:10.1186/s40561-024-00314-9 · Cited by 231
“…course agreed that they are sound, sufficient, and well-dosed, although both suggested diversifying their presentation, for attending different learning styles, in this sense, Contrino et al. (2024) find that one advantage of CogBooks is to offer students the same content in a variety of ways.”
BackgroundMethodResultInfluentialKhan, S., Mazhar, T., Shahzad, T., Khan, M. A., Rehman, A. U., Saeed, M. M. A., & Hamam, H. (2025) · Discover Sustainability · doi:10.1007/s43621-025-00809-6 · Cited by 152
“Predictive analytics also play a crucial role by identifying at-risk students and offering timely interventions to improve retention rates [24, 25].”
Enhancing academic integrity among students in GenAI Era:A holistic framework
Rasul, T., Nair, S., Kalendra, D., Balaji, M. S., Santini, F. D. O., Ladeira, W. J., Rather, R. A., Yasin, N., Rodriguez, R. V., Kokkalis, P., et al. (2024) · The International Journal of Management Education · doi:10.1016/j.ijme.2024.101041 · Cited by 82
Transforming Education: Adaptive Learning, AI, and Online Platforms for Personalization
Rizvi, I., Bose, C., & Tripathi, N. (2025) · Springer eBooks · doi:10.1007/978-981-96-1721-0_4 · Cited by 49
Metadata
- Authors
- Contrino, M. F., Reyes-Millán, M., Vázquez-Villegas, P., & Membrillo-Hernández, J.
- Affiliations
- Tecnológico de Monterrey (MX)
- Venue
- Smart Learning Environments
- Published
- 2024-02-05
- Volume
- 11
- Issue
- 1
- ISSN
- 2196-7091 (ISSN-L)
- OpenAlex
- W4391537361
- Cited by
- 158
- References
- 39
- Citations by year
- 2026: 71 · 2025: 67 · 2024: 19
- FWCI
- 23.26
- Type
- journal article
- Language
- en
- Open access
- gold
- doi.org
- Licence
- cc-by
- creativecommons.org/licenses/by/4.0 (tdm)
- creativecommons.org/licenses/by/4.0 (vor)
- Locations
- Smart Learning Environments (publishedVersion, cc-by)
- DOAJ (DOAJ: Directory of Open Access Journals) (submittedVersion)
- Topics
- Physical Sciences › Computer Science › Artificial Intelligence › Intelligent Tutoring Systems and Adaptive Learning
- Physical Sciences › Computer Science › Computer Science Applications › Online Learning and Analytics
- Social Sciences › Education › Online and Blended Learning
- Keywords
- adaptive learning, personalized learning, online learning, face-to-face teaching, student satisfaction, learning outcomes, statistics education, Zoom, university teaching, blended learning
About these checks
Registry, retraction, Cites and statistics results are computed, not judged, with one exception: a printed reference that no index lists is read once by a model before it counts as a citation error. Claims are extracted by a model and kept only when their quote appears verbatim in the text; each cited source is then checked, with a model’s help, for whether it says what the claim relies on. Those verdicts can be wrong — read the claim’s quote and the cited source before relying on one.
The claim verdicts this report counts are experimental: their accuracy is not yet measured.
A language model drew the claims from the paper on 2026-10-01, under version 3 of the claim definition (model deepseek-v4.1-flash, prompt extract-v3).
A second model labelled each claim on 2026-10-01 (model jev-1.13-20260917, definition revision gold-guideline-v0.2).
Cited sources are checked with a language model’s help (gpt-6-sol).
Statistics and arithmetic are recomputed, not judged.
Confidence bands are shown only for fields calibrated on our annotated test set. None is calibrated yet, so no band is shown.
What counts as a claim ›How we measure confidence ›How we check this ›
Are you an author, or do you see a problem with this page? Request a review
How to cite
Cite CoChat for the checks on this page, and the paper for its own findings.
- This page
- CoChat. (2026). Citation check: Using an adaptive learning tool to improve student performance and satisfaction in online and face-to-face education for a more personalized approach. https://app.cochat.ai/papers/10.1186/s40561-024-00292-y
- The paper
- Contrino, M. F., Reyes-Millán, M., Vázquez-Villegas, P., & Membrillo-Hernández, J. (2024). Using an adaptive learning tool to improve student performance and satisfaction in online and face-to-face education for a more personalized approach. Smart Learning Environments. https://doi.org/10.1186/s40561-024-00292-y
Data sources
Bibliographic data: Semantic Scholar, OpenAlex, Crossref.
Contains information from the Semantic Scholar Academic Graph Datasets, made available under the ODC Attribution License (ODC-BY 1.0).
Semantic Scholar’s data is described in: Kinney, R., et al. (2023). The Semantic Scholar Open Data Platform. arXiv:2301.10140.
