

The DOI matches its Crossref record; 98 of the 98 references it cites were found in a registry or an index; none of the 174 sources its claims cite is checked for support yet.
Lung hyperinflation in COPD: applying physiology to clinical practice
Open accessAbstract
In chronic obstructive pulmonary disease (COPD), worsening expiratory flow limitation together with alteration in the elastic properties of the lung are associated with progressive lung hyperinflation and gradual decline in the resting inspiratory capacity over time. Dynamic hyperinflation (DH) refers to the variable increase in end-expiratory lung volume (EELV) above the relaxation volume (V R ) of the respiratory system that occurs when expiratory flow limitation is amplified (e.g., during bronchoconstriction and acute exacerbations) or when ventilation is increased in the setting of expiratory flow limitation. During exercise, the combined factors of worsening expiratory flow limitation, increasing respiratory neural drive and breathing pattern alterations dictate the pattern and extent of DH. Acute-on-chronic hyperinflation increases the intrinsic loads on the inspiratory muscles which become functionally weakened. The combined effects of compromised respiratory and integrated cardio-circulatory function due to lung hyperinflation contribute to exercise limitation. In COPD, the resting inspiratory capacity, which indirectly reflects the extent of lung hyperinflation, dictates the limits of tidal volume expansion and thus, peak ventilatory capacity during activity. Moreover, the growing disparity between increased respiratory neural drive and the blunted respiratory muscular/mechanical response due to lung hyperinflation is mechanistically linked to dyspnea during exercise in COPD. From a clinical standpoint, measurement of lung hyperinflation is integral to the assessment of physiological impairment in individuals with COPD and can effectively be targeted for treatment. Moreover, it is now well established that lung volume reduction (deflation) provides a solid mechanistic rationale for observed improvements in dyspnea and exercise tolerance in patients with COPD following bronchodilator therapy.
Overview
CoChat Summary
TL;DR
Lung hyperinflation in COPD arises from expiratory flow limitation and altered lung elastic properties, and it contributes to dyspnea, exercise limitation, and cardio-circulatory impairment. This narrative review argues that measuring and targeting lung hyperinflation—especially via bronchodilator-induced deflation—has important clinical value.
Key findings
- Resting inspiratory capacity (IC) declines as COPD worsens; a 4-year trial reported a mean pre-bronchodilator IC decline of 34–50 mL/year in moderate to very severe COPD, and patients with the lowest baseline IC had the greatest rates of exacerbation and death.
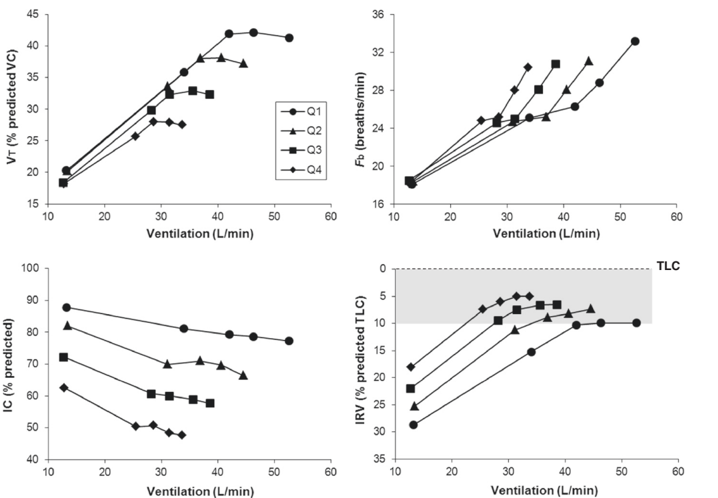
- Dynamic hyperinflation during exercise is common: increases in end-expiratory lung volume above resting values by 0.3–0.6 L occurred in as many as 85% of patients with moderate to severe COPD during cycle exercise.
- Severe hyperinflation, defined as an IC/TLC ratio <25%, is associated with increased cardiovascular mortality, impaired left ventricular filling, and reduced exercise tolerance; intrinsic PEEP may be as high as 6–9 cm H₂O during quiet breathing in stable severe COPD.
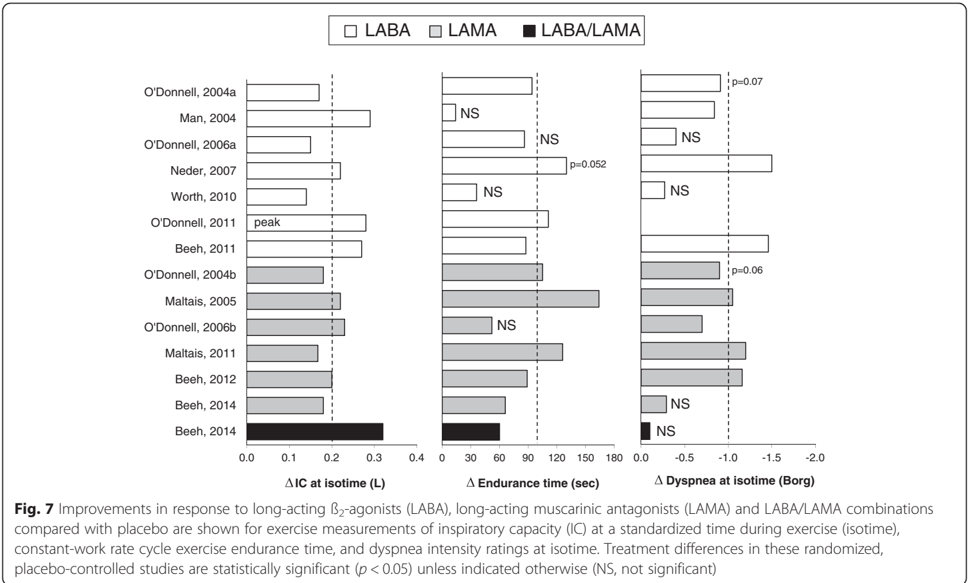
- Inhaled bronchodilators increase resting IC by approximately 0.2–0.4 L or 10–15%, and bronchodilator therapy increases cycle exercise endurance time by about 20% on average, often within the clinically important range of about 100 s.
Methods
- Narrative review of the physiology, clinical consequences, and treatment of lung hyperinflation in COPD.
- No primary sample or new data collection; the paper synthesizes prior studies, including longitudinal, cross-sectional, exercise, imaging, and randomized bronchodilator trials.
- Main analysis is conceptual and mechanistic synthesis, covering definitions, determinants, natural history, respiratory muscle and hemodynamic effects, dynamic hyperinflation during exacerbations and exercise, dyspnea mechanisms, and bronchodilator effects.
Limitations
- The paper states that insufficient longitudinal data are available to precisely chart the natural history of lung hyperinflation in COPD.
- The paper notes that the impact of dynamic hyperinflation on cardiac output and ventilatory/locomotor muscle competition during exercise merits further study, and that information on exercise responses with dual bronchodilator therapy is currently limited.
- Evident from the text: this is a narrative review without a stated systematic search strategy or meta-analysis, so its conclusions depend on selected cited studies, some of which are small or have variable outcome measurements.
Model-written summary. Check it against the paper before relying on it.
Integrity signals
Registry
Cites
Statistics
Figures
Verification
Claims the paper makes
0 Valid · 0 Not valid · 114 Not checked · 26 Own results and interpretations
A check of a cited source is scheduled, or we don’t hold its full text yet; the claim is checked once it runs.
In the paper
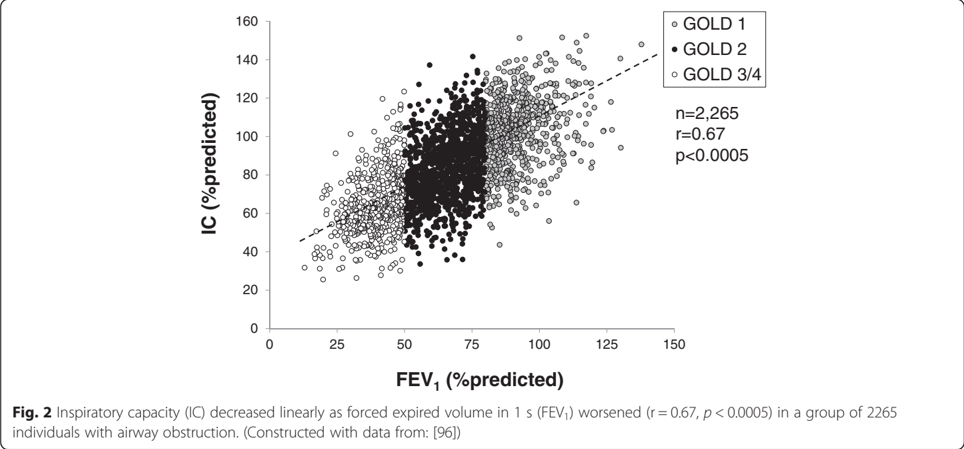
“Inspiratory capacity (IC) decreased linearly as forced expired volume in 1 s (FEV 1 ) worsened (r = 0.67, p < 0.0005) in a group of 2265 individuals with airway obstruction.(Constructed with data from:[96])”
§ Lung hyperinflation in COPD: applying physiology to clinical practice > Summary and clinical relevance
What the sources say
- Not checked yetcites [96] Deesomchok A, Webb KA, Forkert L, Lam YM, Ofir D, Jensen D, et al. Lung hyperinflation and its reversibility in patients with airway obstruction of varying severity. COPD. 2010;7:428–37. source
A check is scheduled.
plainstates an associationn = 2,265- Asserted: passes — The authors put it forward as true.
- Checkable: passes — It can be checked against evidence.
- Load-bearing: passes — The paper’s conclusions depend on it.
- Based: passes — The paper gives a reason why it holds.
- Not checked yet
None of the sources cited for this claim have been checked yet.
In the paper
“Measures of resting lung hyperinflation have been shown to be predictive of respiratory and all-cause mortality”
§ Lung hyperinflation in COPD: applying physiology to clinical practice > Introduction
What the sources say
- Not checked yetcites [3] Casanova C, Cote C, de Torres JP, Aguirre-Jaime A, Marin JM, Pinto-Plata V, et al. Inspiratory-to-total lung capacity ratio predicts mortality in patients with chronic obstructive pulmonary disease. Am J Respir Crit Care Med. 2005;171:591–7. doi:10.1164/rccm.200407-867OC. source
- Not checked yetcites [4] Tantucci C, Donati P, Nicosia F, Bertella E, Redolfi S, De Vecchi M, et al. Inspiratory capacity predicts mortality in patients with chronic obstructive pulmonary disease. Respir Med. 2008;102:613–9. doi:10.1016/j.rmed.2007.11.004. source
boostedstates an association- Asserted: passes — The authors put it forward as true.
- Checkable: passes — It can be checked against evidence.
- Load-bearing: passes — The paper’s conclusions depend on it.
- Based: passes — The paper gives a reason why it holds.
A check of a cited source is scheduled, or we don’t hold its full text yet; the claim is checked once it runs.
In the paper
“Moreover, acute DH is increasingly implicated as a major cause of dyspneathe dominant symptom in patients with chronic airway diseases [7].”
§ Lung hyperinflation in COPD: applying physiology to clinical practice > Introduction
What the sources say
- Not checked yetcites [7] Parshall MB, Schwartzstein RM, Adams L, Banzett RB, Manning HL, Bourbeau J. An official American Thoracic Society statement: update on the mechanisms, assessment, and management of dyspnea. Am J Respir Crit Care Med. 2012;185:435–52. doi:10.1164/rccm.201111-2042ST. source
A check is scheduled.
plainstates a possible cause- Asserted: passes — The authors put it forward as true.
- Checkable: passes — It can be checked against evidence.
- Load-bearing: passes — The paper’s conclusions depend on it.
- Based: passes — The paper gives a reason why it holds.
- Not checked yet
None of the sources cited for this claim have been checked yet.
In the paper
“The increase in TLC in COPD usually reflects the increased lung compliance due to emphysema [10,11]”
§ Lung hyperinflation in COPD: applying physiology to clinical practice > Hyperinflation: definitions and determinants
What the sources say
plainstates a cause- Asserted: passes — The authors put it forward as true.
- Checkable: passes — It can be checked against evidence.
- Load-bearing: unclear — It is unclear whether the paper’s conclusions depend on it.
- Based: passes — The paper gives a reason why it holds.
In the paper
“body plethysmography may overestimate thoracic gas volume in patients with severe and very severe COPD due to incomplete equilibration of mouth and alveolar pressures, heterogeneity of alveolar pressure swings during the panting maneuver, and excessive compliance of the extrathoracic airway [9].”
§ Lung hyperinflation in COPD: applying physiology to clinical practice > Hyperinflation: definitions and determinants
What the sources say
- Not checked yetcites [9] O’Donnell CR, Bankier AA, Stiebellehner L, Reilly JJ, Brown R, Loring SH. Comparison of plethysmographic and helium dilution lung volumes: which is best for COPD? Chest. 2010;137:1108–15. doi:10.1378/chest.09-1504. source
hedgedstates a possible cause- Asserted: passes — The authors put it forward as true.
- Checkable: passes — It can be checked against evidence.
- Load-bearing: unclear — It is unclear whether the paper’s conclusions depend on it.
- Based: passes — The paper gives a reason why it holds.
82 more claims
Create a free account to see all 140 claims and to verify the 171 references still open.
- It may state two separate claims as one. 52
- Probably not a substantial claim. 1
Citations
Cites
Vestbo, J., Hurd, S. S., Agustí, A. G., Jones, P. W., Vogelmeier, C., Anzueto, A., Barnes, P. J., Fabbri, L. M., Martinez, F. J., Nishimura, M., et al. (2013) · American Journal of Respiratory and Critical Care Medicine · doi:10.1164/rccm.201204-0596pp · Cited by 15,983
Parshall, M. B., Schwartzstein, R. M., Adams, L., Banzett, R. B., Manning, H. L., Bourbeau, J., Calverley, P. M., Gift, A. G., Harver, A., Lareau, S. C., et al. (2012) · American Journal of Respiratory and Critical Care Medicine · doi:10.1164/rccm.201111-2042st · Cited by 1,844
Self-citationA 4-Year Trial of Tiotropium in Chronic Obstructive Pulmonary Disease
Tashkin, D. P., Celli, B., Senn, S., Burkhart, D., Kesten, S., Menjoge, S., & Decramer, M. (2008) · New England Journal of Medicine · doi:10.1056/nejmoa0805800 · Cited by 1,604
Dynamic Hyperinflation and Exercise Intolerance in Chronic Obstructive Pulmonary Disease
O'DONNELL, D. E., REVILL, S. M., & WEBB, K. A. (2001) · American Journal of Respiratory and Critical Care Medicine · doi:10.1164/ajrccm.164.5.2012122 · Cited by 1,076
Self-citationEffects of tiotropium on lung hyperinflation, dyspnoea and exercise tolerance in COPD
O'Donnell, D. E., Flüge, T., Gerken, F., Hamilton, A., Webb, K., Aguilaniu, B., Make, B., & Magnussen, H. (2004) · European Respiratory Journal · doi:10.1183/09031936.04.00116004 · Cited by 859
Self-citationPhysiological changes in respiratory function associated with ageing
Janssens, J.-P., Pache, J. C., & Nicod, L. P. (1999) · European Respiratory Journal · doi:10.1034/j.1399-3003.1999.13a36.x · Cited by 801
Physiological changes in respiratory function associated with ageing
Rodriguez-Roisin, R., Burgos, F., Roca, J., Barbera, J., Marrades, R., & Wagner, P. (1999) · European Respiratory Journal · doi:10.1183/09031936.99.14614549 · Cited by 664
Casanova, C., Cote, C., de Torres, J. P., Aguirre-Jaime, A., Marin, J. M., Pinto-Plata, V., & Celli, B. R. (2005) · American Journal of Respiratory and Critical Care Medicine · doi:10.1164/rccm.200407-867oc · Cited by 597
Roussos, C., & Macklem, P. T. (1982) · New England Journal of Medicine · doi:10.1056/nejm198209233071304 · Cited by 538
O'DONNELL, D. E., LAM, M., & WEBB, K. A. (1998) · American Journal of Respiratory and Critical Care Medicine · doi:10.1164/ajrccm.158.5.9804004 · Cited by 532 · cited 3×
“Thus, for any given exercise intensity or _ VE, patients breathe on the more linear portion of the respiratory system’s pressure-volume curve, which delays the onset of neuromechanical dissociation and the attendant dyspnea [60, 78, 79, 90].”
BackgroundSelf-citation
Cited by
Cardiovascular disease and COPD: dangerous liaisons?
Rabe, K. F., Hurst, J. R., & Suissa, S. (2018) · European Respiratory Review · doi:10.1183/16000617.0057-2018 · Cited by 444
Hanania, N. A., & O’Donnell, D. E. (2019) · International Journal of COPD · doi:10.2147/copd.s188141 · Cited by 159
Self-citationHypercapnia in COPD: Causes, Consequences, and Therapy
Csoma, B., Vulpi, M. R., Dragonieri, S., Bentley, A. M., Felton, T., Lázár, Z., & Bikov, A. (2022) · Journal of Clinical Medicine · doi:10.3390/jcm11113180 · Cited by 92
Beeh, K. M., Burgel, P., Franssen, F. M. E., López-Campos, J. L., Loukides, S., Hurst, J. R., Fležar, M., Ulrik, C. S., Marco, F. D., Stolz, D., et al. (2017) · American Journal of Respiratory and Critical Care Medicine · doi:10.1164/rccm.201609-1794ci · Cited by 87
Implications of Cardiopulmonary Risk for the Management of COPD: A Narrative Review
Singh, D., Han, M. K., Hawkins, N. M., Hurst, J. R., Kocks, J. W. H., SKOLNIK, N., Stolz, D., Khoury, J. E., & Gale, C. P. (2024) · Advances in Therapy · doi:10.1007/s12325-024-02855-4 · Cited by 87
Metadata
- Authors
- O’Donnell, D. E., Webb, K. A., & Neder, J. A.
- Affiliations
- Queen's University (CA)
- Corresponding author
- O’Donnell, Denis E.
- Venue
- COPD Research and Practice
- Published
- 2015-09-07
- Volume
- 1
- Issue
- 1
- ISSN
- 2054-9040 (ISSN-L)
- OpenAlex
- W2117521616
- Semantic Scholar
- 89da9539193c4986802a40915b77e5a618a9951d
- Cited by
- 93
- References
- 98
- Citations by year
- 2026: 8 · 2025: 7 · 2024: 12 · 2023: 6 · 2022: 9 · 2021: 6 · 2020: 12 · 2019: 10 · 2018: 11 · 2017: 10 · 2016: 2
- FWCI
- 5.10
- Type
- journal article
- Language
- en
- Open access
- hybrid
- doi.org
- Locations
- COPD Research and Practice (publishedVersion, cc-by)
- Topics
- Health Sciences › Medicine › Pulmonary and Respiratory Medicine › Chronic Obstructive Pulmonary Disease (COPD) Research
- Health Sciences › Medicine › Pulmonary and Respiratory Medicine › Respiratory Support and Mechanisms
- Health Sciences › Medicine › Physiology (medical) › Cardiovascular and exercise physiology
- Keywords
- chronic obstructive pulmonary disease, lung hyperinflation, dynamic hyperinflation, end-expiratory lung volume, expiratory flow limitation, inspiratory capacity, exercise limitation, dyspnea, inspiratory muscle weakness, lung volume reduction, bronchodilator therapy, acute exacerbation, bronchoconstriction
About these checks
Registry, retraction, Cites and statistics results are computed, not judged, with one exception: a printed reference that no index lists is read once by a model before it counts as a citation error. Claims are extracted by a model and kept only when their quote appears verbatim in the text; each cited source is then checked, with a model’s help, for whether it says what the claim relies on. Those verdicts can be wrong — read the claim’s quote and the cited source before relying on one.
A language model drew the claims from the paper on 2026-11-13, under version 3 of the claim definition (model deepseek-v4.1-flash, prompt extract-v3).
A second model labelled each claim on 2026-11-13 (model jev-1.13-20260917, definition revision gold-guideline-v0.2).
Statistics and arithmetic are recomputed, not judged.
Confidence bands are shown only for fields calibrated on our annotated test set. None is calibrated yet, so no band is shown.
What counts as a claim ›How we measure confidence ›How we check this ›
Are you an author, or do you see a problem with this page? Request a review
How to cite
Cite CoChat for the checks on this page, and the paper for its own findings.
- This page
- CoChat. (2026). Citation check: Lung hyperinflation in COPD: applying physiology to clinical practice. https://app.cochat.ai/papers/10.1186/s40749-015-0008-8
- The paper
- O’Donnell, D. E., Webb, K. A., & Neder, J. A. (2015). Lung hyperinflation in COPD: applying physiology to clinical practice. COPD Research and Practice. https://doi.org/10.1186/s40749-015-0008-8
Data sources
Bibliographic data: Semantic Scholar, OpenAlex, Crossref.
Contains information from the Semantic Scholar Academic Graph Datasets, made available under the ODC Attribution License (ODC-BY 1.0).
Semantic Scholar’s data is described in: Kinney, R., et al. (2023). The Semantic Scholar Open Data Platform. arXiv:2301.10140.
