

Logistic regression has similar performance to optimised machine learning algorithms in a clinical setting: application to the discrimination between type 1 and type 2 diabetes in young adults
Open accessThe DOI matches its Crossref record; 67 of the 67 references it cites were found in a registry or an index.
Abstract
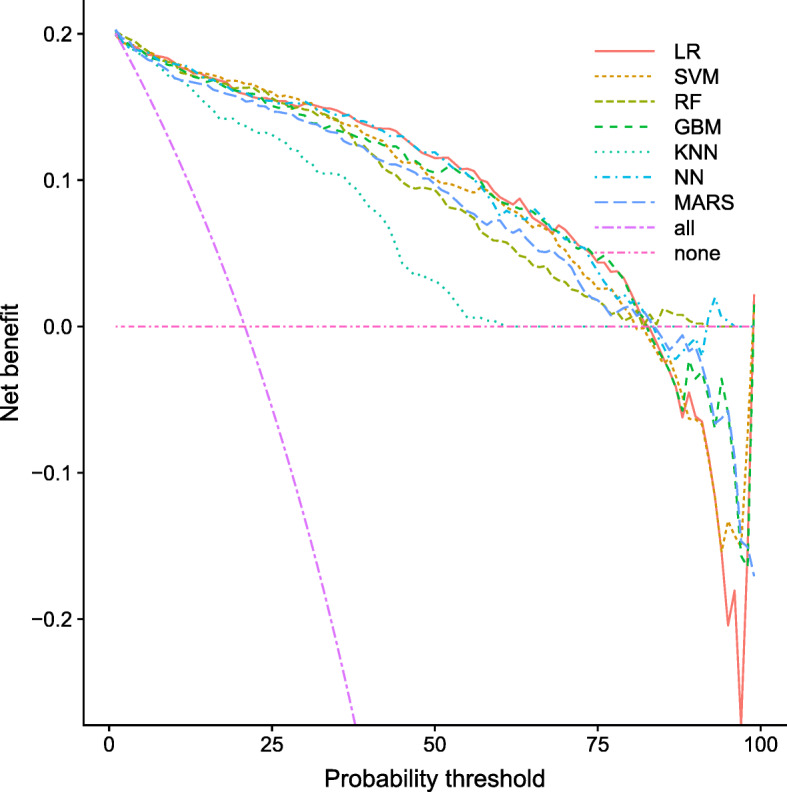
Background: There is much interest in the use of prognostic and diagnostic prediction models in all areas of clinical medicine. The use of machine learning to improve prognostic and diagnostic accuracy in this area has been increasing at the expense of classic statistical models. Previous studies have compared performance between these two approaches but their findings are inconsistent and many have limitations. We aimed to compare the discrimination and calibration of seven models built using logistic regression and optimised machine learning algorithms in a clinical setting, where the number of potential predictors is often limited, and externally validate the models. Methods: We trained models using logistic regression and six commonly used machine learning algorithms to predict if a patient diagnosed with diabetes has type 1 diabetes (versus type 2 diabetes). We used seven predictor variables (age, BMI, GADA islet-autoantibodies, sex, total cholesterol, HDL cholesterol and triglyceride) using a UK cohort of adult participants (aged 18–50 years) with clinically diagnosed diabetes recruited from primary and secondary care ( n = 960, 14% with type 1 diabetes). Discrimination performance (ROC AUC), calibration and decision curve analysis of each approach was compared in a separate external validation dataset ( n = 504, 21% with type 1 diabetes). Results: Average performance obtained in internal validation was similar in all models (ROC AUC ≥ 0.94). In external validation, there were very modest reductions in discrimination with AUC ROC remaining ≥ 0.93 for all methods. Logistic regression had the numerically highest value in external validation (ROC AUC 0.95). Logistic regression had good performance in terms of calibration and decision curve analysis. Neural network and gradient boosting machine had the best calibration performance. Both logistic regression and support vector machine had good decision curve analysis for clinical useful threshold probabilities. Conclusion: Logistic regression performed as well as optimised machine algorithms to classify patients with type 1 and type 2 diabetes. This study highlights the utility of comparing traditional regression modelling to machine learning, particularly when using a small number of well understood, strong predictor variables.
Overview
The claims and statistics of this paper haven’t been checked yet.
Free: it reads the open-access text and checks the first 5 claims that cite a source we can check. Create a free account to check every claim.
Integrity signals
Registry
Cites
Statistics
Figures

Verification
Claims the paper makes
The claims and statistics of this paper haven’t been checked yet.
Free: it reads the open-access text and checks the first 5 claims that cite a source we can check. Create a free account to check every claim.
Claims other papers make about this one
Each is checked against this paper’s own text: does it say what the citing paper says it does?
The cited source says what the claim attributes to it.
In the citing paper
“For example, logistic regression performed similarly to optimised machine learning models for discriminating between type 1 and type 2 diabetes in young adults.103”
From Developing clinical prediction models: a step-by-step guide (2024) · cites this paper as [103]
Self-check
Percentages, sums and reported differences re-computed from the paper’s own numbers.
The self-check needs the paper’s full text.
Citations
Cites
Breiman, L. (2001) · Machine Learning · doi:10.1023/a:1010933404324 · Cited by 133,538
The Nature of Statistical Learning Theory
Vapnik, V. N. (1995) · doi:10.1007/978-1-4757-2440-0 · Cited by 39,138
Greedy function approximation: A gradient boosting machine
Friedman, J. H. (2001) · The Annals of Statistics · doi:10.1214/aos/1013203451 · Cited by 30,731
Modern Applied Statistics with S
Venables, W. N., & Ripley, B. D. (2002) · Statistics and Computing · doi:10.1007/978-0-387-21706-2 · Cited by 24,305
The Elements of Statistical Learning
Hastie, T., Friedman, J., & Tibshirani, R. (2001) · Springer Series in Statistics · doi:10.1007/978-0-387-21606-5 · Cited by 24,162
Classification and Regression by randomForest
Liaw, A. I., & Wiener, M. C. (2007) · Cited by 18,594
Neural networks for pattern recognition
(1994) · Choice Reviews Online · doi:10.5860/choice.31-5500 · Cited by 18,538
No free lunch theorems for optimization
Wolpert, D. H., & Macready, W. G. (1997) · IEEE Transactions on Evolutionary Computation · doi:10.1109/4235.585893 · Cited by 14,237
Neural Networks for Pattern Recognition
Bishop, C. M. (1995) · doi:10.1093/oso/9780198538493.001.0001 · Cited by 12,287
Building Predictive Models in R Using the caret Package
Kuhn, M. (2008) · Journal of Statistical Software · doi:10.18637/jss.v028.i05 · Cited by 8,863
Research works printed but not linked: 3
- Goodfellow I, Bengio Y, Courville A. Deep learning: the MIT press; 2016. p. 800.
- Dasarathy B. Nearest neighbor: pattern classification techniques. Los Alamitos: IEEE Computer Society Press; 1991.
- Fernandez-Delgado M, Cernadas E, Barro S, Amorim D. Do we need hundreds of classifiers to solve real world classification problems? J Mach Learn Res. 2014;15(1):3133–81.
Cited by
2. Classification and Diagnosis of Diabetes: Standards of Medical Care in Diabetes—2022
American Diabetes Association Professional Practice Committee (2022) · Diabetes Care · doi:10.2337/dc22-s002 · Cited by 4,792
2. Classification and Diagnosis of Diabetes: Standards of Medical Care in Diabetes—2021
American Diabetes Association (2021) · Diabetes Care · doi:10.2337/dc21-s002 · Cited by 3,116
2. Classification and Diagnosis of Diabetes:Standards of Care in Diabetes—2023
ElSayed, N. A., Aleppo, G., Aroda, V. R., Bannuru, R. R., Brown, F. M., Bruemmer, D., Collins, B. S., Gaglia, J. L., Hilliard, M. E., Isaacs, D., et al. (2023) · Diabetes Care · doi:10.2337/dc23-s002 · Cited by 2,433
2. Diagnosis and Classification of Diabetes: Standards of Care in Diabetes—2024
American Diabetes Association Professional Practice Committee, ElSayed, N. A., Aleppo, G., Bannuru, R. R., Bruemmer, D., Collins, B. S., Ekhlaspour, L., Gaglia, J. L., Hilliard, M. E., Johnson, E. L., et al. (2024) · Diabetes Care · doi:10.2337/dc24-s002 · Cited by 2,086
2. Diagnosis and classification of diabetes: standards of care in diabetes-2025
American Diabetes Association Professional Practice Committee, ElSayed, N. A., McCoy, R. G., Aleppo, G., Balapattabi, K., Beverly, E. A., Briggs Early, K., Bruemmer, D., Ebekozien, O., Echouffo-Tcheugui, J. B., et al. (2025) · Diabetes Care · doi:10.2337/dc25-s002 · Cited by 1,393
Metadata
- Authors
- Lynam, A. L., Dennis, J. M., Owen, K. R., Oram, R. A., Jones, A. G., Shields, B. M., & Ferrat, L. A.
- Affiliations
- University of Exeter (GB)
- Churchill Hospital (GB)
- Corresponding author
- Ferrat, Lauric A.
- ORCID
- Venue
- Diagnostic and Prognostic Research
- Published
- 2020-06-04
- Volume
- 4
- Issue
- 1
- Pages
- 6-6
- ISSN
- 2397-7523 (ISSN-L)
- PMC
- PMC7318367
- OpenAlex
- W3034154128
- Cited by
- 142
- References
- 67
- Citations by year
- 2026: 15 · 2025: 27 · 2024: 27 · 2023: 19 · 2022: 23 · 2021: 29 · 2020: 2
- FWCI
- 16.03
- Type
- journal article
- Language
- en
- Open access
- gold
- doi.org
- Licence
- cc-by
- creativecommons.org/licenses/by/4.0 (tdm)
- creativecommons.org/licenses/by/4.0 (vor)
- Locations
- Diagnostic and Prognostic Research (publishedVersion, cc-by)
- PubMed Central (publishedVersion, cc-by)
- PubMed (publishedVersion)
- DOAJ (DOAJ: Directory of Open Access Journals) (submittedVersion, cc-by-sa)
- Figshare (submittedVersion, cc-by)
- Open Research Exeter (University of Exeter) (submittedVersion, cc-by)
- Royal Devon and Exeter Research Repository (Royal Devon and Exeter) (submittedVersion, cc-by)
- Zenodo (CERN European Organization for Nuclear Research) (submittedVersion, cc-by)
- Funders
- NIHR Clinician Scientist award (CS-2015-15-018)
- European Community FP7 programme CEED3 (HEALTH-F2-2008-223211)
- UK Medical Research Council (MR/N00633X/)
- National Institute for Health Research (DRF-2010-03-72)
- Diabetes UK Harry Keen Fellowship (16/0005529)
- Topics
- Health Sciences › Health Professions › Health Information Management › Artificial Intelligence in Healthcare
- Physical Sciences › Mathematics › Statistics and Probability › Statistical Methods in Epidemiology
- Life Sciences › Biochemistry, Genetics and Molecular Biology › Genetics › Diabetes and associated disorders
- Keywords
- type 1 diabetes, type 2 diabetes, diabetes classification, logistic regression, machine learning, external validation, model discrimination, model calibration, decision curve analysis, young adults, gradient boosting, artificial neural networks, support vector machine
About these checks
Registry, retraction, Cites and statistics results are computed, not judged, with one exception: a printed reference that no index lists is read once by a model before it counts as a citation error. Claims are extracted by a model and kept only when their quote appears verbatim in the text; each cited source is then checked, with a model’s help, for whether it says what the claim relies on. Those verdicts can be wrong — read the claim’s quote and the cited source before relying on one.
Statistics and arithmetic are recomputed, not judged.
Confidence bands are shown only for fields calibrated on our annotated test set. None is calibrated yet, so no band is shown.
What counts as a claim ›How we measure confidence ›How we check this ›
Are you an author, or do you see a problem with this page? Request a review
How to cite
Cite CoChat for the checks on this page, and the paper for its own findings.
- This page
- CoChat. (2026). Citation check: Logistic regression has similar performance to optimised machine learning algorithms in a clinical setting: application to the discrimination between type 1 and type 2 diabetes in young adults. https://app.cochat.ai/papers/10.1186/s41512-020-00075-2
- The paper
- Lynam, A. L., Dennis, J. M., Owen, K. R., Oram, R. A., Jones, A. G., Shields, B. M., & Ferrat, L. A. (2020). Logistic regression has similar performance to optimised machine learning algorithms in a clinical setting: application to the discrimination between type 1 and type 2 diabetes in young adults. Diagnostic and Prognostic Research. https://doi.org/10.1186/s41512-020-00075-2
Data sources
Bibliographic data: Semantic Scholar, OpenAlex, Crossref.
Contains information from the Semantic Scholar Academic Graph Datasets, made available under the ODC Attribution License (ODC-BY 1.0).
Semantic Scholar’s data is described in: Kinney, R., et al. (2023). The Semantic Scholar Open Data Platform. arXiv:2301.10140.
