

The DOI matches its Crossref record; 40 of the 41 references it cites were found in a registry or an index.
Dysregulated mitophagy and mitochondrial organization in optic atrophy due to OPA1 mutations
Open accessAbstract
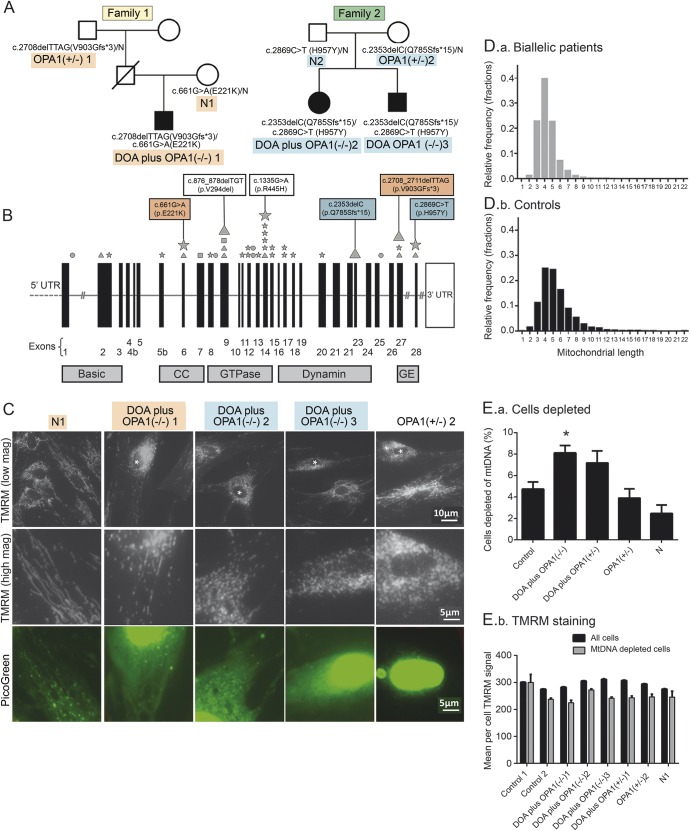
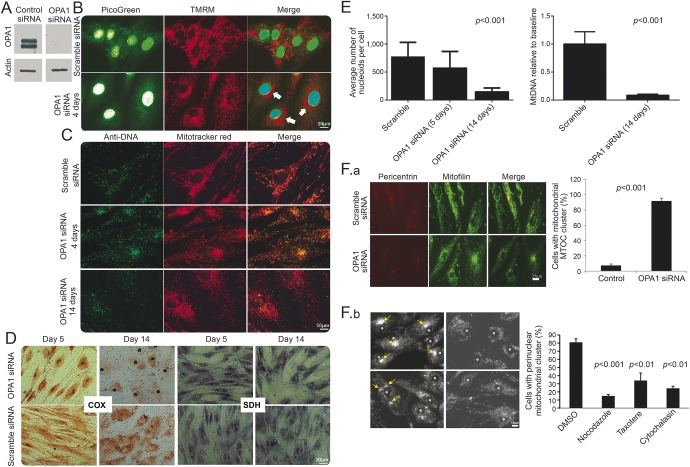
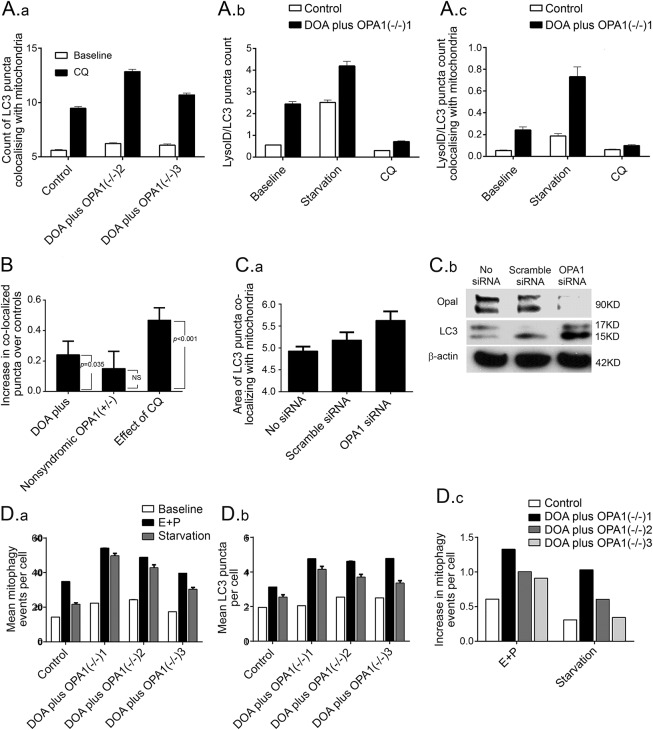
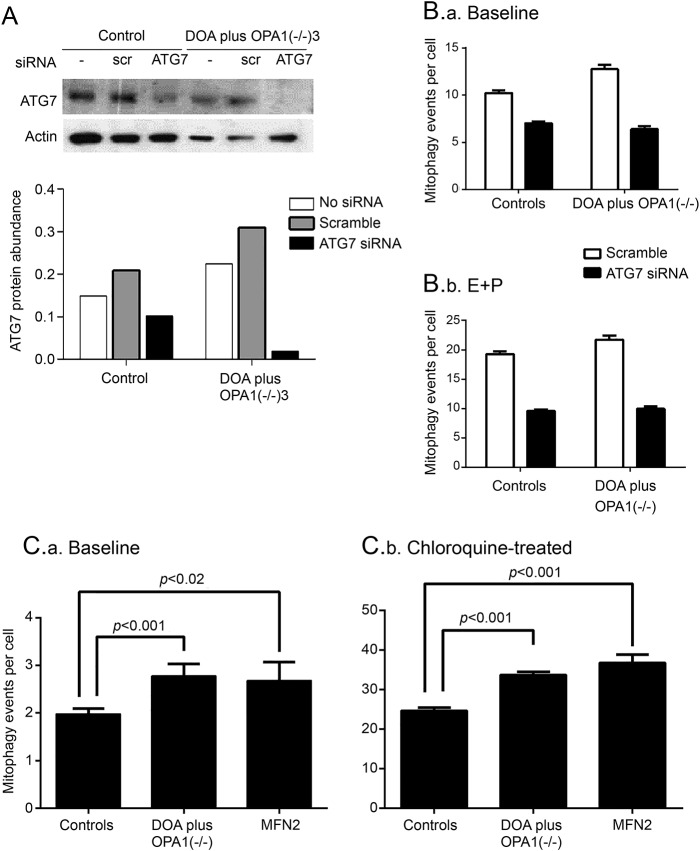
OBJECTIVE: To investigate mitophagy in 5 patients with severe dominantly inherited optic atrophy (DOA), caused by depletion of OPA1 (a protein that is essential for mitochondrial fusion), compared with healthy controls. METHODS: Patients with severe DOA (DOA plus) had peripheral neuropathy, cognitive regression, and epilepsy in addition to loss of vision. We quantified mitophagy in dermal fibroblasts, using 2 high throughput imaging systems, by visualizing colocalization of mitochondrial fragments with engulfing autophagosomes. RESULTS: Fibroblasts from 3 biallelic OPA1(-/-) patients with severe DOA had increased mitochondrial fragmentation and mitochondrial DNA (mtDNA)-depleted cells due to decreased levels of OPA1 protein. Similarly, in siRNA-treated control fibroblasts, profound OPA1 knockdown caused mitochondrial fragmentation, loss of mtDNA, impaired mitochondrial function, and mitochondrial mislocalization. Compared to controls, basal mitophagy (abundance of autophagosomes colocalizing with mitochondria) was increased in (1) biallelic patients, (2) monoallelic patients with DOA plus, and (3) OPA1 siRNA-treated control cultures. Mitophagic flux was also increased. Genetic knockdown of the mitophagy protein ATG7 confirmed this by eliminating differences between patient and control fibroblasts. CONCLUSIONS: We demonstrated increased mitophagy and excessive mitochondrial fragmentation in primary human cultures associated with DOA plus due to biallelic OPA1 mutations. We previously found that increased mitophagy (mitochondrial recycling) was associated with visual loss in another mitochondrial optic neuropathy, Leber hereditary optic neuropathy (LHON). Combined with our LHON findings, this implicates excessive mitochondrial fragmentation, dysregulated mitophagy, and impaired response to energetic stress in the pathogenesis of mitochondrial optic neuropathies, potentially linked with mitochondrial mislocalization and mtDNA depletion.
Overview
The claims and statistics of this paper haven’t been checked yet.
Run the check — free, no account needed. It reads the open-access text and checks the sources it cites.
Integrity signals
Registry
Cites
Statistics
Figures
Verification
Claims the paper makes
The claims and statistics of this paper haven’t been checked yet.
Run the check — free, no account needed. It reads the open-access text and checks the sources it cites.
Claims other papers make about this one
Each is checked against this paper’s own text: does it say what the citing paper says it does?
In the citing paper
“Opa1 deficiency has been reported to induce low mtDNA copy number and nucleoids abundance in human fibroblasts, which suggests that those alterations are not just restricted to muscle cells (Liao et al, 2017).”
From Mitochondrial DNA and TLR9 drive muscle inflammation upon Opa1 deficiency (2018) · cites this paper as Liao et al, 2017
Self-check
Percentages, sums and reported differences re-computed from the paper’s own numbers.
The self-check needs the paper’s full text.
Citations
Cites
Guidelines for the use and interpretation of assays for monitoring autophagy (3rd edition).
Klionsky, D. J., Abdelmohsen, K., Abe, A., Abedin, M. J., Abeliovich, H., Acevedo Arozena, A., Adachi, H., Adams, C. M., Adams, P. D., Adeli, K., et al. (2016) · Autophagy · doi:10.1080/15548627.2015.1100356 · Cited by 5,894
Parkin is recruited selectively to impaired mitochondria and promotes their autophagy
Narendra, D., Tanaka, A., Suen, D.-F., & Youle, R. J. (2008) · The Journal of Cell Biology · doi:10.1083/jcb.200809125 · Cited by 4,026
Fission and selective fusion govern mitochondrial segregation and elimination by autophagy
Twig, G., Elorza, A., Molina, A. J. A., Mohamed, H., Wikstrom, J. D., Walzer, G., Stiles, L., Haigh, S. E., Katz, S., Las, G., et al. (2008) · The EMBO Journal · doi:10.1038/sj.emboj.7601963 · Cited by 3,082
PINK1 Is Selectively Stabilized on Impaired Mitochondria to Activate Parkin
Narendra, D. P., Jin, S. M., Tanaka, A., Suen, D.-F., Gautier, C. A., Shen, J., Cookson, M. R., & Youle, R. J. (2010) · PLoS Biology · doi:10.1371/journal.pbio.1000298 · Cited by 2,944
During autophagy mitochondria elongate, are spared from degradation and sustain cell viability
Gomes, L. C., Benedetto, G. D., & Scorrano, L. (2011) · Nature Cell Biology · doi:10.1038/ncb2220 · Cited by 1,735
Gegg, M. E., Cooper, J. M., Chau, K.-Y., Rojo, M., Schapira, A. H. V., & Taanman, J.-W. (2010) · Human Molecular Genetics · doi:10.1093/hmg/ddq419 · Cited by 910
Lysosomal positioning coordinates cellular nutrient responses
Korolchuk, V. I., Saiki, S., Lichtenberg, M., Siddiqi, F. H., Roberts, E. A., Imarisio, S., Jahreiss, L., Sarkar, S., Futter, M., Menzies, F. M., et al. (2011) · Nature Cell Biology · doi:10.1038/ncb2204 · Cited by 891
Ebneth, A., Godemann, R., Stamer, K., Illenberger, S., Trinczek, B., Mandelkow, E.-M., & Mandelkow, E. (1998) · The Journal of Cell Biology · doi:10.1083/jcb.143.3.777 · Cited by 820
SLP‐2 is required for stress‐induced mitochondrial hyperfusion
Tondera, D., Grandemange, S., Jourdain, A. A., Karbowski, M., Mattenberger, Y., Herzig, S., Cruz, S. D., Clerc, P., Lauria, I., Merkwirth, C., et al. (2009) · The EMBO Journal · doi:10.1038/emboj.2009.89 · Cited by 796
OPA1 mutations induce mitochondrial DNA instability and optic atrophy 'plus' phenotypes
Amati-Bonneau, P., Valentino, M. L., Reynier, P., Gallardo, M. E., Bornstein, B., Boissiere, A., Campos, Y., Rivera, H., de la Aleja, J. G., Carroccia, R., et al. (2008) · Brain · doi:10.1093/brain/awm298 · Cited by 520
Cited by
Sorted by citations
Items 101–102 of 102
SIRT2-dependent SQSTM1 decrotonylation at K100 rescues impaired mitophagy in aged bovine oocytes
Zhao, Z., Shi, J., Zhao, W., Li, W., Zhao, Y., Zhao, Z., Sun, M., & Xu, D. (2026) · Theriogenology · doi:10.1016/j.theriogenology.2026.118240
Autophagy in ocular health and disease: From mechanistic insights to therapeutic perspectives
Wei, B., Lin, Y., Yang, Y., Zhang, C., Gao, S., Zhao, Q., wang, Y., Han, Z., Xu, D., & Wei, L. (2026) · Experimental Eye Research · doi:10.1016/j.exer.2026.111288
Metadata
- Authors
- Liao, C., Ashley, N., Diot, A., Morten, K., Phadwal, K., Williams, A., Fearnley, I., Rosser, L., Lowndes, J., Fratter, C., Ferguson, D. J. P., Vay, L., Quaghebeur, G., Moroni, I., Bianchi, S., Lamperti, C., Downes, S. M., Sitarz, K. S., Flannery, P. J., Carver, J., Dombi, E., East, D., Laura, M., Reilly, M. M., Mortiboys, H., Prevo, R., Campanella, M., Daniels, M. J., Zeviani, M., Yu-Wai-Man, P., Simon, A. K., Votruba, M., & Poulton, J.
- Affiliations
- Author affiliations are provided at the end of the article.
- Corresponding author
- Poulton, Joanna
- ORCID
- Liao, Chunyan
- Ashley, Neil
- Diot, Alan
- Morten, Karl
- Phadwal, Kanchan
- Fearnley, Ian
- Fratter, Carl
- Ferguson, David J.P.
- Moroni, Isabella
- Lamperti, Costanza
- Downes, Susan M.
- Dombi, Eszter
- East, Daniel
- Reilly, Mary M.
- Mortiboys, Heather
- Prevo, Remko
- Campanella, Michelangelo
- Daniels, Matthew J.
- Zeviani, Massimo
- Simon, Anna Katharina
- Votruba, Marcela
- Poulton, Joanna
- Venue
- Neurology
- Published
- 2017-01-10
- Volume
- 88
- Issue
- 2
- Pages
- 131-142
- ISSN
- 0028-3878 (ISSN-L)
- 1526-632X
- PMC
- PMC5224718
- OpenAlex
- W2549272530
- Cited by
- 97
- References
- 41
- Citations by year
- 2026: 9 · 2025: 7 · 2024: 5 · 2023: 5 · 2022: 16 · 2021: 17 · 2020: 15 · 2019: 5 · 2018: 11 · 2017: 7
- FWCI
- 7.19
- Type
- journal article
- Language
- en
- Open access
- hybrid
- doi.org
- Licence
- cc-by
- Locations
- Neurology (publishedVersion, cc-by)
- PubMed Central (publishedVersion, cc-by)
- PubMed (publishedVersion)
- MDC Repository (Max-Delbrueck-Center for Molecular Medicine) (acceptedVersion)
- White Rose Research Online (University of Leeds, The University of Sheffield, University of York) (acceptedVersion)
- ORCA Online Research @Cardiff (Cardiff University) (acceptedVersion)
- RVC Research Online (Royal Veterinary College) (submittedVersion, cc-by)
- Cineca Institutional Research Information System (Tor Vergata University) (submittedVersion)
- DIGITAL.CSIC (Spanish National Research Council (CSIC)) (submittedVersion, cc-by)
- UCL Discovery (University College London) (submittedVersion)
- Research Explorer (The University of Manchester) (submittedVersion, cc-by)
- Padua Research Archive (University of Padova) (submittedVersion)
- Funders
- Wellcome Trust (WT098519MA, 098519/Z/12/Z)
- Newlife the Charity for Disabled Children
- Kennedy Trust for Rheumatology Research (KENN161708)
- Cancer Research UK
- National Institute for Health and Care Research
- Parkinson's UK (F1301)
- University of Oxford
- Newcastle University
- Cardiff University
- Instituo Cajal
- Moorfields Eye Hospital NHS Foundation Trust
- Institute for Translational Neuroscience
- Royal Veterinary College
- Medical Research Council (MR/J010448/1)
- Biotechnology and Biological Sciences Research Council (BB/I013695/1, BB/N007042/1)
- Wellcome Trust Centre for Mitochondrial Research
- NIHR Oxford Biomedical Research Centre
- National Institute of Neurological Disorders and Stroke (U54NS065712)
- Topics
- Life Sciences › Biochemistry, Genetics and Molecular Biology › Cell Biology › Autophagy in Disease and Therapy
- Life Sciences › Biochemistry, Genetics and Molecular Biology › Molecular Biology › Mitochondrial Function and Pathology
- Life Sciences › Neuroscience › Cellular and Molecular Neuroscience › Hereditary Neurological Disorders
- Keywords
- mitophagy, OPA1 mutations, optic atrophy, mitochondrial fragmentation, mitochondrial DNA depletion, ATG7, mitochondrial fusion, mitochondrial optic neuropathy, Leber's hereditary optic neuropathy, autophagosomes, dermal fibroblasts
- MeSH terms
- PTEN-Induced Putative Kinase, Antioxidants, Cells, Cultured, Cognition Disorders, DNA Mutational Analysis, DNA, Mitochondrial, Family Health, Female, Fibroblasts, Humans, Male, Mutation, Optic Atrophy, Pedigree, Protein Kinases, Transfection, Ubiquinone, GTP Phosphohydrolases, Mitochondrial Proteins, RNA, Small Interfering, Ubiquitin-Protein Ligases, Membrane Potential, Mitochondrial, Mitophagy
About these checks
Registry, retraction, Cites and statistics results are computed, not judged, with one exception: a printed reference that no index lists is read once by a model before it counts as a citation error. Claims are extracted by a model and kept only when their quote appears verbatim in the text; each cited source is then checked, with a model’s help, for whether it says what the claim relies on. Those verdicts can be wrong — read the claim’s quote and the cited source before relying on one.
Statistics and arithmetic are recomputed, not judged.
Confidence bands are shown only for fields calibrated on our annotated test set. None is calibrated yet, so no band is shown.
What counts as a claim ›How we measure confidence ›How we check this ›
Are you an author, or do you see a problem with this page? Request a review
