

The DOI matches its Crossref record; 8 of the 8 references it cites were found in a registry or an index.
Comprehensive comparison of Pacific Biosciences and Oxford Nanopore Technologies and their applications to transcriptome analysis
Abstract
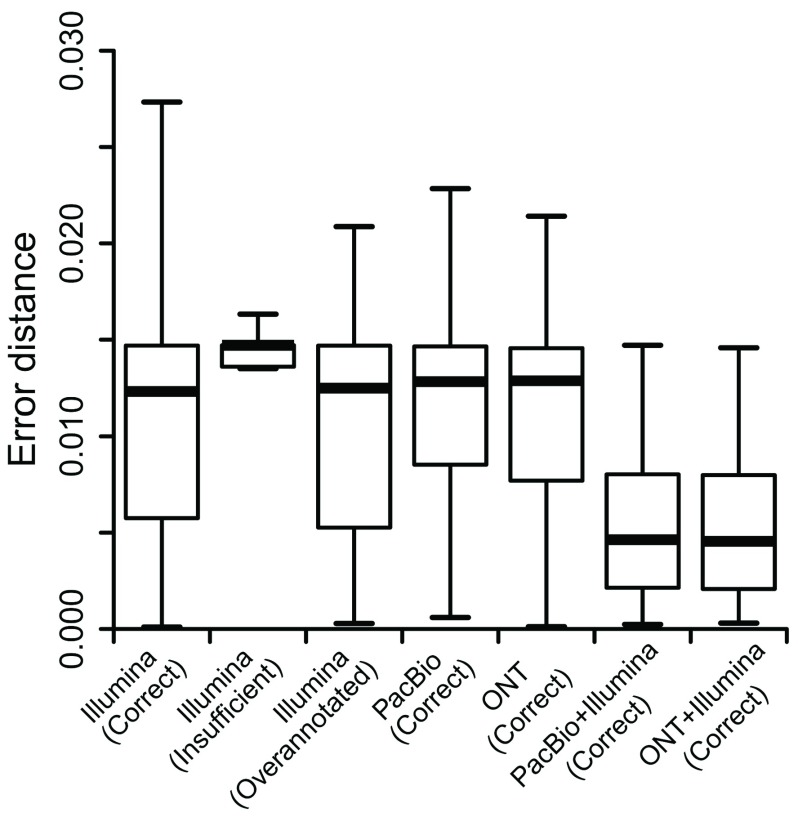
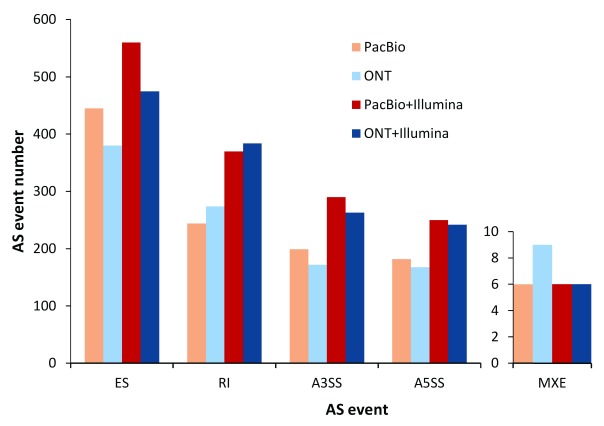
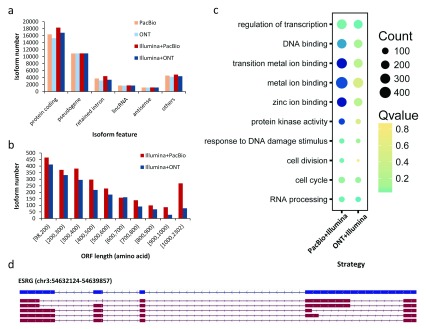
Background: Given the demonstrated utility of Third Generation Sequencing [Pacific Biosciences (PacBio) and Oxford Nanopore Technologies (ONT)] long reads in many studies, a comprehensive analysis and comparison of their data quality and applications is in high demand. Methods: Based on the transcriptome sequencing data from human embryonic stem cells, we analyzed multiple data features of PacBio and ONT, including error pattern, length, mappability and technical improvements over previous platforms. We also evaluated their application to transcriptome analyses, such as isoform identification and quantification and characterization of transcriptome complexity, by comparing the performance of size-selected PacBio, non-size-selected ONT and their corresponding Hybrid-Seq strategies (PacBio+Illumina and ONT+Illumina). Results: PacBio shows overall better data quality, while ONT provides a higher yield. As with data quality, PacBio performs marginally better than ONT in most aspects for both long reads only and Hybrid-Seq strategies in transcriptome analysis. In addition, Hybrid-Seq shows superior performance over long reads only in most transcriptome analyses. Conclusions: Both PacBio and ONT sequencing are suitable for full-length single-molecule transcriptome analysis. As this first use of ONT reads in a Hybrid-Seq analysis has shown, both PacBio and ONT can benefit from a combined Illumina strategy. The tools and analytical methods developed here provide a resource for future applications and evaluations of these rapidly-changing technologies.
Overview
The claims and statistics of this paper haven’t been checked yet.
Run the check — free, no account needed. It reads the open-access text and checks the sources it cites.
Integrity signals
Registry
Cites
Statistics
Figures
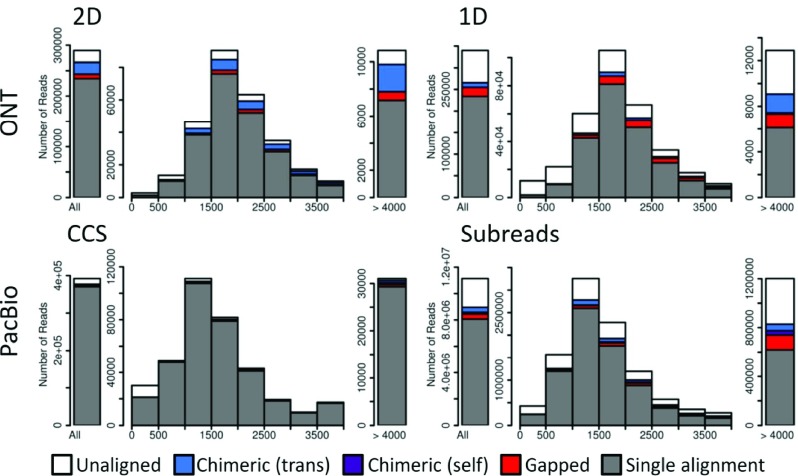
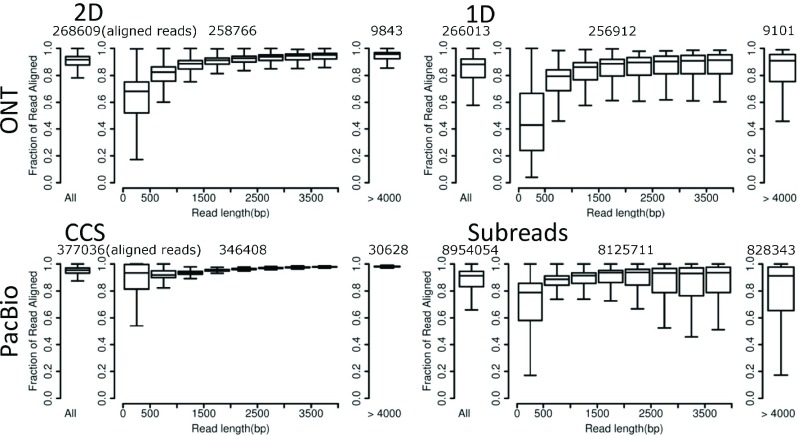
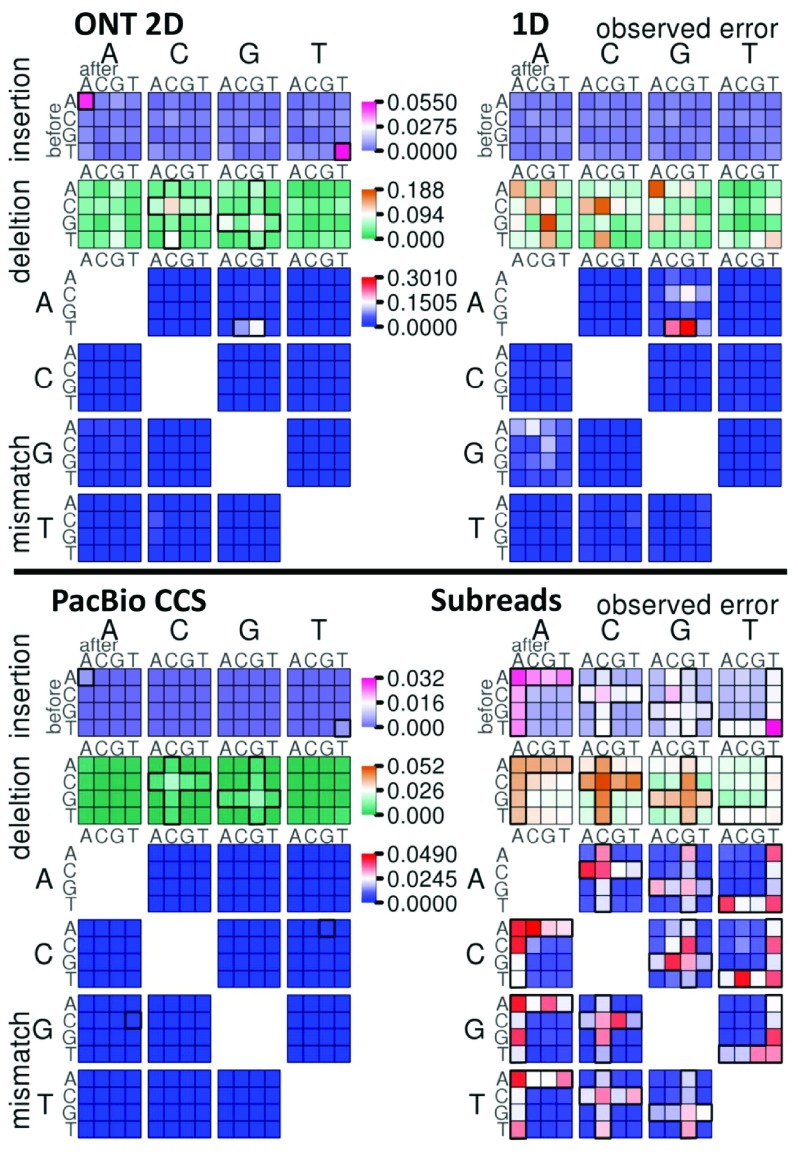
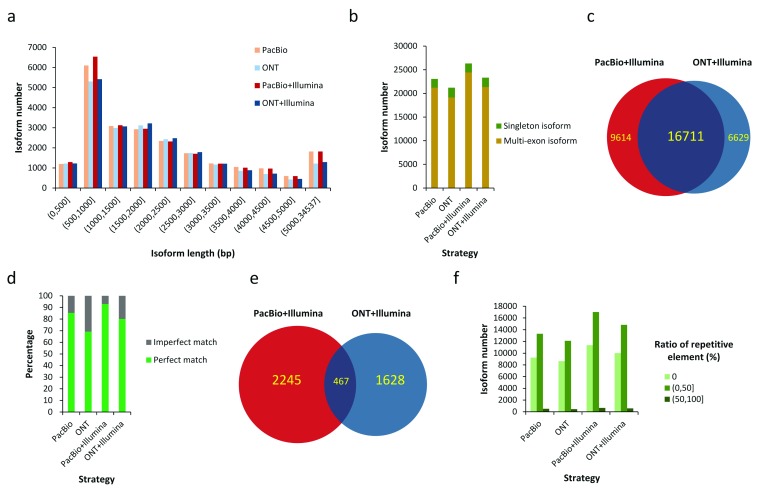
Verification
Claims the paper makes
The claims and statistics of this paper haven’t been checked yet.
Run the check — free, no account needed. It reads the open-access text and checks the sources it cites.
Claims other papers make about this one
Each is checked against this paper’s own text: does it say what the citing paper says it does?
In the citing paper
“Both platforms, however, have high single-pass error-rates (11–15% for PacBio (47), similar for Nanopore (48)).”
From Tandem repeats lead to sequence assembly errors and impose multi-level challenges for genome and protein databases (2019) · cites this paper as [48]
Self-check
Percentages, sums and reported differences re-computed from the paper’s own numbers.
The self-check needs the paper’s full text.
Citations
Cites
Cutadapt removes adapter sequences from high-throughput sequencing reads
Martin, M. (2011) · EMBnet.journal · doi:10.14806/ej.17.1.200 · Cited by 33,889
Alternative splicing and evolution: diversification, exon definition and function
Keren, H., Lev-Maor, G., & Ast, G. (2010) · Nature Reviews Genetics · doi:10.1038/nrg2776 · Cited by 1,082
Coupling mRNA processing with transcription in time and space
Bentley, D. L. (2014) · Nature Reviews Genetics · doi:10.1038/nrg3662 · Cited by 828
A single-molecule long-read survey of the human transcriptome
Sharon, D., Tilgner, H., Grubert, F., & Snyder, M. (2013) · Nature Biotechnology · doi:10.1038/nbt.2705 · Cited by 701
Cartography of neurexin alternative splicing mapped by single-molecule long-read mRNA sequencing
Treutlein, B., Gokce, O., Quake, S. R., & Südhof, T. C. (2014) · Proceedings of the National Academy of Sciences · doi:10.1073/pnas.1403244111 · Cited by 348
Characterization of the human ESC transcriptome by hybrid sequencing
Au, K. F., Sebastiano, V., Afshar, P. T., Durruthy, J. D., Lee, L., Williams, B. A., van Bakel, H., Schadt, E. E., Reijo-Pera, R. A., Underwood, J. G., et al. (2013) · Proceedings of the National Academy of Sciences · doi:10.1073/pnas.1320101110 · Cited by 341
Self-citationImproving PacBio Long Read Accuracy by Short Read Alignment
Au, K. F., Underwood, J. G., Lee, L., & Wong, W. H. (2012) · PLoS ONE · doi:10.1371/journal.pone.0046679 · Cited by 335
Self-citationSebastiano, V., Zhen, H. H., Haddad, B., Bashkirova, E., Melo, S. P., Wang, P., Leung, T. L., Siprashvili, Z., Tichy, A., Li, J., et al. (2014) · Science Translational Medicine · doi:10.1126/scitranslmed.3009540 · Cited by 213
Self-citation
Research works printed but not linked: 40
- A McCarthy, 2010, Third generation DNA sequencing: pacific biosciences' single molecule real time technology., Chem Biol., 17, 675-6, 10.1016/j.chembiol.2010.07.004 · DOI
- T Laver, 2015, Assessing the performance of the Oxford Nanopore Technologies MinION., Biomol Detect Quantif., 3, 1-8, 10.1016/j.bdq.2015.02.001 · DOI
- A Rhoads, 2015, PacBio Sequencing and Its Applications., Genomics Proteomics Bioinformatics., 13, 278-89, 10.1016/j.gpb.2015.08.002 · DOI · Paper page
- H Lu, 2016, Oxford Nanopore MinION Sequencing and Genome Assembly., Genomics Proteomics Bioinformatics., 14, 265-79, 10.1016/j.gpb.2016.05.004 · DOI
- J Reuter, 2015, High-throughput sequencing technologies., Mol Cell., 58, 586-97, 10.1016/j.molcel.2015.05.004 · DOI
- E van Dijk, 2014, Ten years of next-generation sequencing technology., Trends Genet., 30, 418-26, 10.1016/j.tig.2014.07.001 · DOI
- L Liu, 2012, Comparison of next-generation sequencing systems., J Biomed Biotechnol., 2012, 10.1155/2012/251364 · DOI
- R McCoy, 2014, Illumina TruSeq synthetic long-reads empower de novo assembly and resolve complex, highly-repetitive transposable elements., PLoS One., 9, e106689, 10.1371/journal.pone.0106689 · DOI
- G Zheng, 2016, Haplotyping germline and cancer genomes with high-throughput linked-read sequencing., Nat Biotechnol., 34, 303-11, 10.1038/nbt.3432 · DOI
- M Pendleton, 2015, Assembly and diploid architecture of an individual human genome via single-molecule technologies., Nat Methods., 12, 780-6, 10.1038/nmeth.3454 · DOI
- J Weirather, 2015, Characterization of fusion genes and the significantly expressed fusion isoforms in breast cancer by hybrid sequencing., Nucleic Acids Res., 43, e116, 10.1093/nar/gkv562 · DOI · Paper page
- B Deonovic, 2016, IDP-ASE: haplotyping and quantifying allele-specific expression at the gene and gene isoform level by hybrid sequencing., Nucleic Acids Res., 10.1093/nar/gkw1076 · DOI
- C Ip, 2015, MinION Analysis and Reference Consortium: Phase 1 data release and analysis [version 1; referees: 2 approved]., F1000Res., 4, 1075, 10.12688/f1000research.7201.1 · DOI
- J Quick, 2014, A reference bacterial genome dataset generated on the MinIONTM portable single-molecule nanopore sequencer., Gigascience., 3, 22, 10.1186/2047-217X-3-22 · DOI
- Z Feng, 2013, Detecting DNA modifications from SMRT sequencing data by modeling sequence context dependence of polymerase kinetic., PLoS Comput Biol., 9, e1002935, 10.1371/journal.pcbi.1002935 · DOI
- S Koren, 2012, Hybrid error correction and de novo assembly of single-molecule sequencing reads., Nat Biotechnol., 30, 693-700, 10.1038/nbt.2280 · DOI
- L Salmela, 2014, LoRDEC: accurate and efficient long read error correction., Bioinformatics., 30, 3506-14, 10.1093/bioinformatics/btu538 · DOI
- G Tevz, 2016, Identification of a novel fusion transcript between human relaxin-1 (RLN1) and human relaxin-2 (RLN2) in prostate cancer., Mol Cell Endocrinol., 420, 159-68, 10.1016/j.mce.2015.10.011 · DOI
- H Tilgner, 2014, Defining a personal, allele-specific, and single-molecule long-read transcriptome., Proc Natl Acad Sci U S A., 111, 9869-74, 10.1073/pnas.1400447111 · DOI · Paper page
- S Abdel-Ghany, 2016, A survey of the sorghum transcriptome using single-molecule long reads., Nat Commun., 7, 11706, 10.1038/ncomms11706 · DOI
- A Minoche, 2015, Exploiting single-molecule transcript sequencing for eukaryotic gene prediction., Genome Biol., 16, 184, 10.1186/s13059-015-0729-7 · DOI
- S Thomas, 2014, Long-read sequencing of chicken transcripts and identification of new transcript isoforms., PLoS One., 9, e94650, 10.1371/journal.pone.0094650 · DOI
- Z Xu, 2015, Full-length transcriptome sequences and splice variants obtained by a combination of sequencing platforms applied to different root tissues of Salvia miltiorrhiza and tanshinone biosynthesis., Plant J., 82, 951-61, 10.1111/tpj.12865 · DOI
- L Shi, 2016, Long-read sequencing and de novo assembly of a Chinese genome., Nat Commun., 7, 12065, 10.1038/ncomms12065 · DOI
- S Gordon, 2015, Widespread Polycistronic Transcripts in Fungi Revealed by Single-Molecule mRNA Sequencing., PLoS One., 10, e0132628, 10.1371/journal.pone.0132628 · DOI
- P Larsen, 2014, The utility of PacBio circular consensus sequencing for characterizing complex gene families in non-model organisms., BMC Genomics., 15, 720, 10.1186/1471-2164-15-720 · DOI
- W Zhang, 2014, PacBio sequencing of gene families - a case study with wheat gluten genes., Gene., 533, 541-6, 10.1016/j.gene.2013.10.009 · DOI
- M Bolisetty, 2015, Determining exon connectivity in complex mRNAs by nanopore sequencing., Genome Biol., 16, 204, 10.1186/s13059-015-0777-z · DOI
- S Oikonomopoulos, 2016, Benchmarking of the Oxford Nanopore MinION sequencing for quantitative and qualitative assessment of cDNA populations., Sci Rep., 6, 31602, 10.1038/srep31602 · DOI
- V Sebastiano, 2011, In situ genetic correction of the sickle cell anemia mutation in human induced pluripotent stem cells using engineered zinc finger nucleases., Stem Cells., 29, 1717-26, 10.1002/stem.718 · DOI
- S Lamble, 2013, Improved workflows for high throughput library preparation using the transposome-based Nextera system., BMC Biotechnol., 13, 104, 10.1186/1472-6750-13-104 · DOI
- S Picelli, 2014, Full-length RNA-seq from single cells using Smart-seq2., Nat Protoc., 9, 171-81, 10.1038/nprot.2014.006 · DOI · Paper page
- W Kent, 2002, The human genome browser at UCSC., Genome Res., 12, 996-1006, 10.1101/gr.229102 · DOI · Paper page
- T Wu, 2005, GMAP: a genomic mapping and alignment program for mRNA and EST sequences., Bioinformatics., 21, 1859-75, 10.1093/bioinformatics/bti310 · DOI · Paper page
- M Pertea, 2015, StringTie enables improved reconstruction of a transcriptome from RNA-seq reads., Nat Biotechnol., 33, 290-5, 10.1038/nbt.3122 · DOI
- W Huang da, 2009, Systematic and integrative analysis of large gene lists using DAVID bioinformatics resources., Nat Protoc., 4, 44-57, 10.1038/nprot.2008.211 · DOI · Paper page
- E Loomis, 2013, Sequencing the unsequenceable: expanded CGG-repeat alleles of the fragile X gene., Genome Res., 23, 121-8, 10.1101/gr.141705.112 · DOI
- R Elkon, 2013, Alternative cleavage and polyadenylation: extent, regulation and function., Nat Rev Genet., 14, 496-506, 10.1038/nrg3482 · DOI
- J Wang, 2014, Primate-specific endogenous retrovirus-driven transcription defines naive-like stem cells., Nature., 516, 405-9, 10.1038/nature13804 · DOI
- S Goodwin, 2015, Oxford Nanopore sequencing, hybrid error correction, and de novo assembly of a eukaryotic genome., Genome Res., 25, 1750-6, 10.1101/gr.191395.115 · DOI
Cited by
Sorted by citations
Opportunities and challenges in long-read sequencing data analysis
Amarasinghe, S. L., Su, S., Dong, X., Zappia, L., Ritchie, M. E., & Gouil, Q. (2020) · Genome Biology · doi:10.1186/s13059-020-1935-5 · Cited by 2,530
Byrne, A., Beaudin, A. E., Olsen, H. E., Jain, M., Cole, C., Palmer, T., DuBois, R. M., Forsberg, E. C., Akeson, M., & Vollmers, C. (2017) · Nature Communications · doi:10.1038/ncomms16027 · Cited by 379
Tørresen, O. K., Star, B., Mier, P., Andrade-Navarro, M. A., Bateman, A., Jarnot, P., Gruca, A., Grynberg, M., Kajava, A. V., Promponas, V. J., et al. (2019) · Nucleic Acids Research · doi:10.1093/nar/gkz841 · Cited by 347
Paulk, N. K., Pekrun, K., Zhu, E., Nygaard, S., Li, B., Xu, J., Chu, K., Leborgne, C., Dane, A. P., Haft, A., et al. (2018) · Molecular Therapy · doi:10.1016/j.ymthe.2017.09.021 · Cited by 161
Information-Theoretic Foundations of DNA Data Storage
Shomorony, I., & Heckel, R. (2022) · Foundations and Trends® in Communications and Information Theory · doi:10.1561/0100000117 · Cited by 62
Metadata
- Authors
- Weirather, J. L., de Cesare, M., Wang, Y., Piazza, P., Sebastiano, V., Wang, X.-J., Buck, D., & Au, K. F.
- Venue
- F1000Research
- Publisher
- F1000 Research Ltd
- Published
- 2017-06-19
- Volume
- 6
- Pages
- 100
- ISSN
- 2046-1402
- PMC
- PMC5553090
- Cited by
- 418
- References
- 8
- Language
- en
- Funders
- National Human Genome Research Institute (R01HG008759)
- National Natural Science Foundation of China (91540204)
- University of Iowa
- Multidisciplinary Lung Research Career Development Program (T32HL007638)
About these checks
Registry, retraction, Cites and statistics results are computed, not judged, with one exception: a printed reference that no index lists is read once by a model before it counts as a citation error. Claims are extracted by a model and kept only when their quote appears verbatim in the text; each cited source is then checked, with a model’s help, for whether it says what the claim relies on. Those verdicts can be wrong — read the claim’s quote and the cited source before relying on one.
Statistics and arithmetic are recomputed, not judged.
Confidence bands are shown only for fields calibrated on our annotated test set. None is calibrated yet, so no band is shown.
What counts as a claim ›How we measure confidence ›How we check this ›
Are you an author, or do you see a problem with this page? Request a review
