

The DOI matches its Crossref record; 120 of the 121 references it cites were found in a registry or an index.
The Navigation Guide—Evidence-Based Medicine Meets Environmental Health: Systematic Review of Nonhuman Evidence for PFOA Effects on Fetal Growth
Open accessAbstract
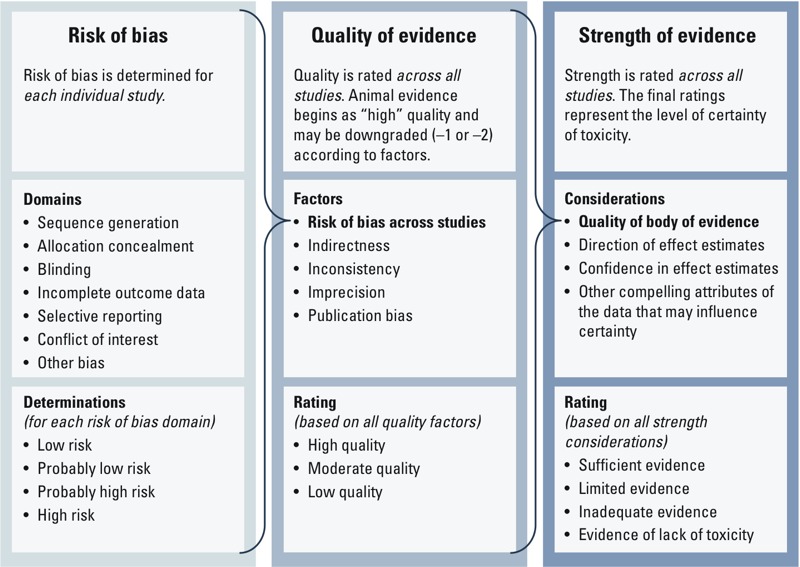
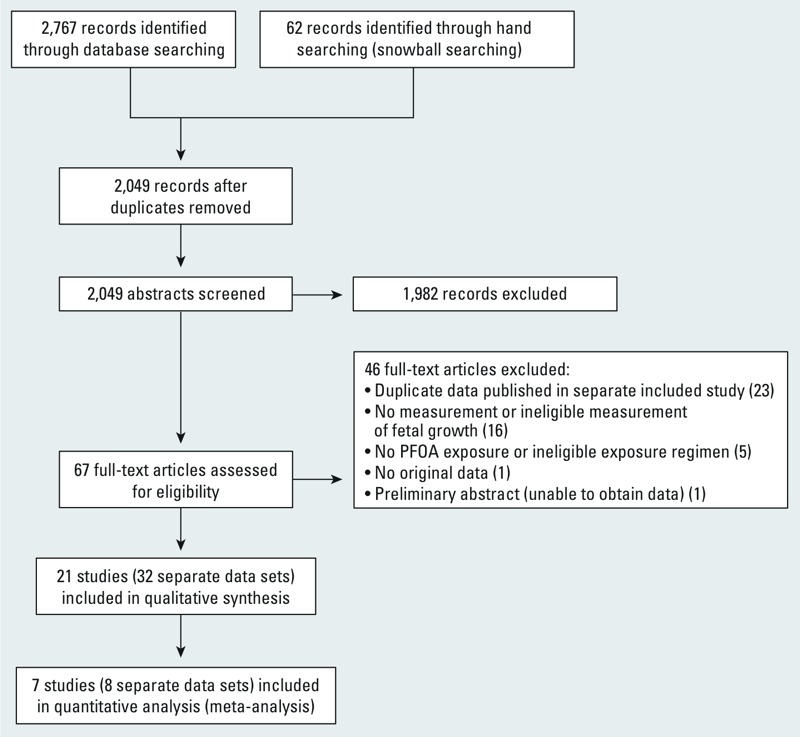
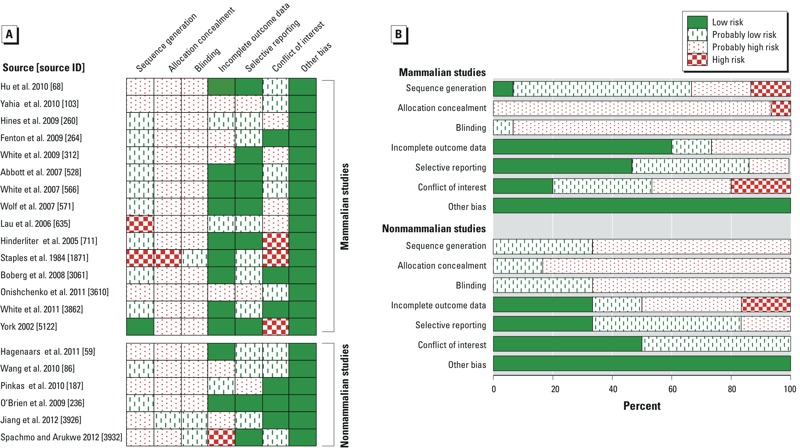
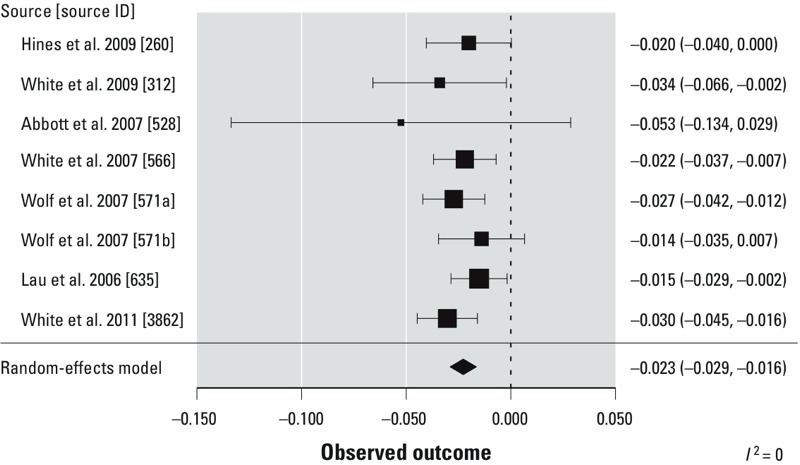
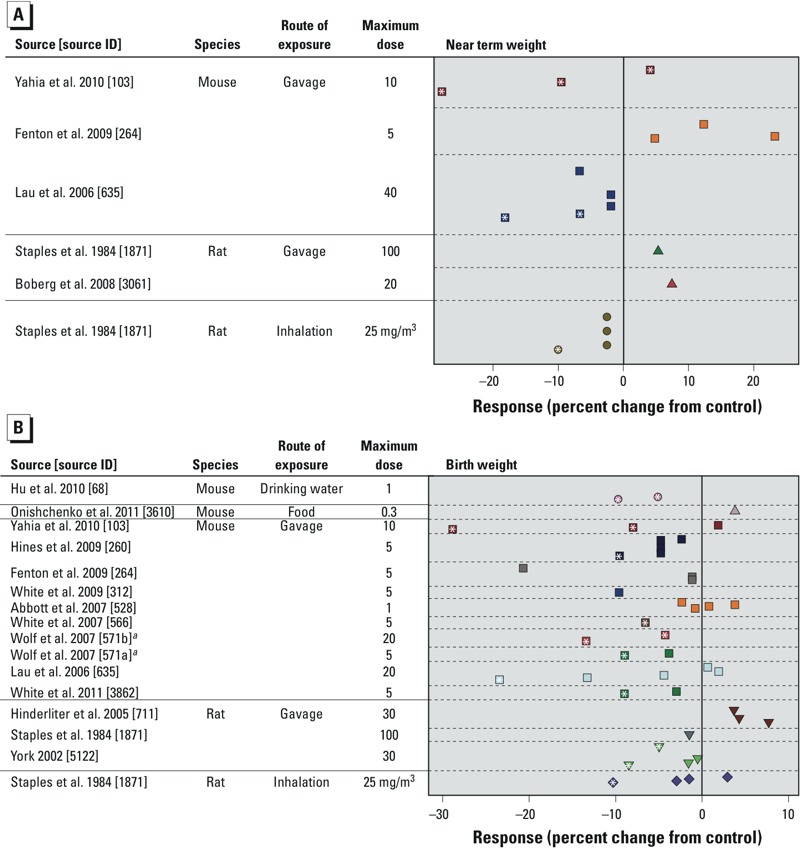
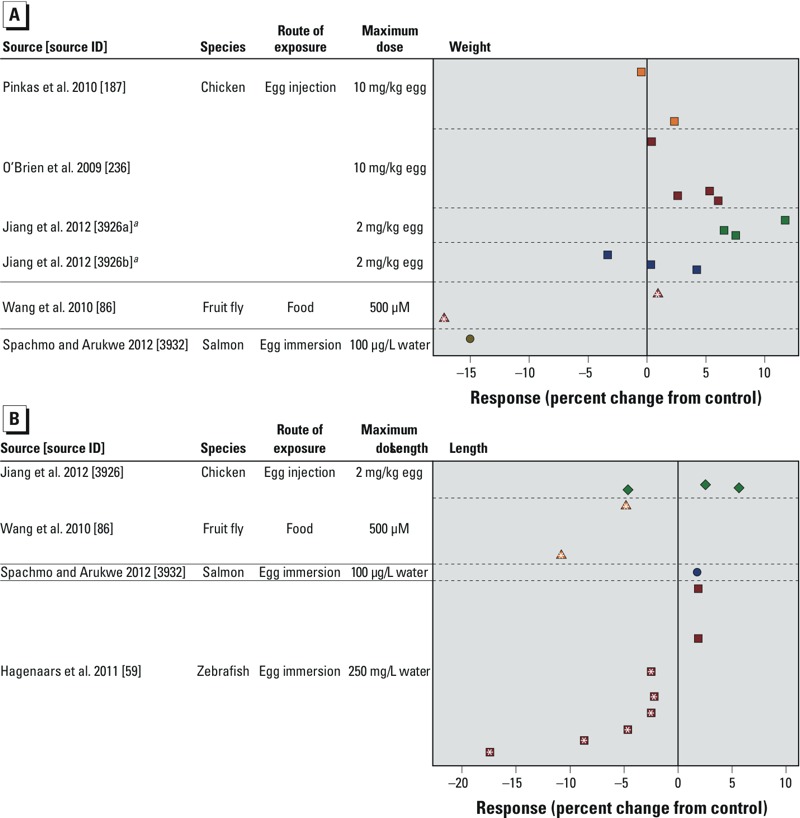
Abstract Background: In contrast to current methods of expert-based narrative review, the Navigation Guide is a systematic and transparent method for synthesizing environmental health research from multiple evidence streams. The Navigation Guide was developed to effectively and efficiently translate the available scientific evidence into timely prevention-oriented action. Objectives: We applied the Navigation Guide systematic review method to answer the question “Does fetal developmental exposure to perfluorooctanoic acid (PFOA) or its salts affect fetal growth in animals ?” and to rate the strength of the experimental animal evidence. Methods: We conducted a comprehensive search of the literature, applied prespecified criteria to the search results to identify relevant studies, extracted data from studies, obtained additional information from study authors, conducted meta-analyses, and rated the overall quality and strength of the evidence. Results: Twenty-one studies met the inclusion criteria. From the meta-analysis of eight mouse gavage data sets, we estimated that exposure of pregnant mice to increasing concentrations of PFOA was associated with a change in mean pup birth weight of –0.023 g (95% CI: –0.029, –0.016) per 1-unit increase in dose (milligrams per kilogram body weight per day). The evidence, consisting of 15 mammalian and 6 nonmammalian studies, was rated as “moderate” and “low” quality, respectively. Conclusion: Based on this first application of the Navigation Guide methodology, we found sufficient evidence that fetal developmental exposure to PFOA reduces fetal growth in animals. Citation: Koustas E, Lam J, Sutton P, Johnson PI, Atchley DS, Sen S, Robinson KA, Axelrad DA, Woodruff TJ. 2014. The Navigation Guide—evidence-based medicine meets environmental health: systematic review of nonhuman evidence for PFOA effects on fetal growth. Environ Health Perspect 122:1015–1027; http://dx.doi.org/10.1289/ehp.1307177
Overview
The claims and statistics of this paper haven’t been checked yet.
Run the check — free, no account needed. It reads the open-access text and checks the sources it cites.
Integrity signals
Registry
Cites
Statistics
Figures
Verification
Claims the paper makes
The claims and statistics of this paper haven’t been checked yet.
Run the check — free, no account needed. It reads the open-access text and checks the sources it cites.
Claims other papers make about this one
Each is checked against this paper’s own text: does it say what the citing paper says it does?
The source backs part of the claim, not all of it — or backs it for a different population, condition or comparison.
In the citing paper
“In utero exposure to per- and polyfluoroalkyl substances (PFAS), which are recognized developmental toxicants, potentially leads to decreased anthropometric measures in infants at birth.”
From Associations between in utero exposure of per- and polyfluoroalkyl substances (PFAS) mixture and anthropometry measures at birth (2025) · cites this paper as Koustas et al., 2014
Experimental — accuracy not yet measuredThe cited source says what the claim attributes to it.
In the citing paper
“such methods have only recently been developed and utilized in environmental health sciences [23–30].”
From A Systematic Review and Meta-Analysis of Multiple Airborne Pollutants and Autism Spectrum Disorder (2016) · cites this paper as [24]
In the citing paper
“This observation is consistent with our previous systematic reviews, [24, 27, 28, 30]”
From A Systematic Review and Meta-Analysis of Multiple Airborne Pollutants and Autism Spectrum Disorder (2016) · cites this paper as [24]
Self-check
Percentages, sums and reported differences re-computed from the paper’s own numbers.
The self-check needs the paper’s full text.
Citations
Cites
Measuring inconsistency in meta-analyses
Higgins, J. P. T., Thompson, S. G., Deeks, J. J., & Altman, D. G. (2003) · BMJ · doi:10.1136/bmj.327.7414.557 · Cited by 63,139
Meta-analysis in clinical trials
DerSimonian, R., & Laird, N. (1986) · Controlled Clinical Trials · doi:10.1016/0197-2456(86)90046-2 · Cited by 39,552
Cochrane Handbook for Systematic Reviews of Interventions: Cochrane Book Series
(2008) · doi:10.1002/9780470712184 · Cited by 25,048
von Elm, E., Altman, D. G., Egger, M., Pocock, S. J., Gøtzsche, P. C., Vandenbroucke, J. P., & Initiative, F. T. S. (2007) · PLoS Medicine · doi:10.1371/journal.pmed.0040296 · Cited by 23,020
Conducting Meta-Analyses in R with the metafor Package
Viechtbauer, W. (2010) · Journal of Statistical Software · doi:10.18637/jss.v036.i03 · Cited by 20,464
von Elm, E., Altman, D. G., Egger, M., Pocock, S. J., Gøtzsche, P. C., Vandenbroucke, J. P., & Initiative, F. T. S. (2007) · Annals of Internal Medicine · doi:10.7326/0003-4819-147-8-200710160-00010 · Cited by 17,796
(2014) · Medical Entomology and Zoology · Cited by 17,633
GRADE guidelines: 3. Rating the quality of evidence
Balshem, H., Helfand, M., Schünemann, H. J., Oxman, A. D., Kunz, R., Brozek, J., Vist, G. E., Falck-Ytter, Y., Meerpohl, J., & Norris, S. (2011) · Journal of Clinical Epidemiology · doi:10.1016/j.jclinepi.2010.07.015 · Cited by 8,285
Sterne, J. A. C., Sutton, A. J., Ioannidis, J. P. A., Terrin, N., Jones, D. R., Lau, J., Carpenter, J., Rucker, G., Harbord, R. M., Schmid, C. H., et al. (2011) · BMJ · doi:10.1136/bmj.d4002 · Cited by 7,709
(2008) · Cited by 3,790
Research works printed but not linked: 1
- Higgins JPT, Deeks JJ, eds. 2011. Chapter 7: Selecting studies and collecting data. In: Cochrane Handbook for Systematic Reviews of Interventions, Version 5.1.0 (Higgins JPT, Green S, eds).Available: http://www.cochrane-handbook.org [accessed 7 February 2013].
Cited by
Sorted by citations
Items 201–300 of 349
Papadopoulou, E., Poothong, S., Koekkoek, J. C., Lucattini, L., Padilla‐Sánchez, J. A., Haugen, M. A., Herzke, D., Valdersnes, S., Maage, A., Cousins, I. T., et al. (2017) · Environmental Research · doi:10.1016/j.envres.2017.06.011 · Cited by 39
Hu, C., Qiao, J.-C., Gui, S., Xu, K., Dzhambov, A. M., & Zhang, X.-J. (2023) · Environmental Research · doi:10.1016/j.envres.2023.116064 · Cited by 35
Frangione, B., Birk, S., Benzouak, T., Rodríguez-Villamizar, L. A., Karim, F. A., Dugandzic, R. M., & Villeneuve, P. J. (2023) · International Journal of Obesity · doi:10.1038/s41366-023-01401-6 · Cited by 38
Alkhalawi, E., Kasper-Sonnenberg, M., Wilhelm, M., Völkel, W., & Wittsiepe, J. (2016) · Journal of Toxicology and Environmental Health · doi:10.1080/15287394.2016.1219552 · Cited by 34
Pasqual, E., de Basea, M. B., López-Vicente, M., Thierry-Chef, I., & Cardis, E. (2020) · Environment International · doi:10.1016/j.envint.2019.105371 · Cited by 36
Godderis, L., Boonen, E., Martimbianco, A. L. C., Delvaux, E., Ivanov, I. D., Lambrechts, M., Latorraca, C. O., Leppink, N., Pega, F., Prüss‐Üstün, A., et al. (2018) · Environment International · doi:10.1016/j.envint.2018.07.025 · Cited by 34
Development of an Evidence-Based Risk Assessment Framework
Krewski, D. R. (2022) · ALTEX · doi:10.14573/altex.2004041 · Cited by 41
Critical review of long-term ozone exposure and asthma development
Zu, K., Shi, L., Prueitt, R. L., Liu, X., & Goodman, J. E. (2018) · Inhalation Toxicology · doi:10.1080/08958378.2018.1455772 · Cited by 32
Rugel, E. J., & Brauer, M. D. (2020) · Environmental Research · doi:10.1016/j.envres.2020.109388 · Cited by 34
Eaves, L. A., Choi, G., Hall, E. R. M., Sillé, F., Fry, R., Buckley, J. P., & Keil, A. (2023) · Environmental Health Perspectives · doi:10.1289/ehp11872 · Cited by 27
Using GRADE to respond to health questions with different levels of urgency
Thayer, K. A., & Schünemann, H. J. (2016) · Environment International · doi:10.1016/j.envint.2016.03.027 · Cited by 31
Karystianis, G., Thayer, K., Wolfe, M., & Tsafnat, G. (2017) · Journal of Biomedical Informatics · doi:10.1016/j.jbi.2017.04.004 · Cited by 31
VanNoy, B., Lam, J., & Zota, A. R. (2018) · Current Environmental Health Reports · doi:10.1007/s40572-018-0194-z · Cited by 33
Self-citationMarks, K. J., Howards, P. P., Smarr, M. M., Flanders, W. D., Northstone, K., Daniel, J. H., Sjödin, A., Calafat, A. M., & Hartman, T. J. (2021) · Epidemiology · doi:10.1097/ede.0000000000001351 · Cited by 30
Using systematic reviews for hazard and risk assessment of endocrine disrupting chemicals
Beronius, A., & Vandenberg, L. N. (2015) · Reviews in Endocrine and Metabolic Disorders · doi:10.1007/s11154-016-9334-7 · Cited by 33
Pega, F., Chartres, N., Guha, N., Modenese, A., Morgan, R. L., Martinez-Silveira, M. S., & LOOMIS, D. P. (2020) · Environment International · doi:10.1016/j.envint.2020.106089 · Cited by 34
Forsthuber, M., Widhalm, R., Granitzer, S., Kaiser, A.-M., Moshammer, H., Hengstschläger, M., Dolznig, H., & Gundacker, C. (2021) · Environmental Pollution · doi:10.1016/j.envpol.2021.118543 · Cited by 28
Children's environmental health based on birth cohort studies of Asia
Tsai, M., Chen, M., Lin, C., Ng, S., Hsieh, C., Liu, C.-Y., Hsieh, W., & Chen, P. (2017) · The Science of The Total Environment · doi:10.1016/j.scitotenv.2017.07.081 · Cited by 30
Pinney, S. M., Windham, G. C., Xie, C., Herrick, R., Calafat, A. M., McWhorter, K. L., Fassler, C. S., Hiatt, R. A., Kushi, L. H., & Biro, F. M. (2019) · International Journal of Hygiene and Environmental Health · doi:10.1016/j.ijheh.2019.07.002 · Cited by 28
Public health evaluation of PFAS exposures and breastfeeding: a systematic literature review
Hoadley, L., Watters, M. T., Rogers, R. D., Werner, L., Markiewicz, K. V., Forrester, T., & McLanahan, E. D. (2023) · Toxicological Sciences · doi:10.1093/toxsci/kfad053 · Cited by 30
Zheng, T., Kelsey, K., Zhu, C., Pennell, K. D., Yao, Q., Manz, K. E., Zheng, Y. F., Braun, J. M., Liu, Y., Papandonatos, G., et al. (2024) · Environmental Research · doi:10.1016/j.envres.2023.117010 · Cited by 28
Environmental contaminants and child’s growth
Kadawathagedara, M., de Lauzon‐Guillain, B., & Botton, J. (2018) · Journal of Developmental Origins of Health and Disease · doi:10.1017/s2040174418000995 · Cited by 30
Yao, Q., Gao, Y., Zhang, Y., Qin, K., Liew, Z., & Tian, Y. (2021) · Chemosphere · doi:10.1016/j.chemosphere.2021.131521 · Cited by 28
Gestational triclosan exposure and infant birth weight: A systematic review and meta-analysis
Patti, M. A., Henderson, N. B., Gajjar, P., Eliot, M., Jackson-Browne, M. S., & Braun, J. M. (2021) · Environment International · doi:10.1016/j.envint.2021.106854 · Cited by 27
Sheehan, M. C., Lam, J., Navas‐Acién, A., & Chang, H. H. (2016) · Environment International · doi:10.1016/j.envint.2016.02.016 · Cited by 28
Self-citationLOOMIS, D. P., Dzhambov, A. M., Momen, N. C., Chartres, N., Descatha, A., Guha, N., Kang, S.-K., Modenese, A., Morgan, R. L., Ahn, S., et al. (2022) · Environment International · doi:10.1016/j.envint.2022.107565 · Cited by 36
Elgarahy, A. M., Eloffy, M. G., Saber, A. N., Abouzid, M., Rashad, E., Ghorab, M. A., El‐Sherif, D. M., & Elwakeel, K. Z. (2024) · Environmental Monitoring and Assessment · doi:10.1007/s10661-024-13334-2 · Cited by 28
More, S. J., Bambidis, V., Benford, D., Bragard, C., Hernández, A. F., Bennekou, S. H., Koutsoumanis, K., Machera, K. A., Naegeli, H., Nielsen, S. S., et al. (2020) · EFSA Journal · doi:10.2903/j.efsa.2020.6221 · Cited by 26
Dangudubiyyam, S. V., Mishra, J. S., Zhao, H., & Kumar, S. (2020) · Reproductive Toxicology · doi:10.1016/j.reprotox.2020.09.008 · Cited by 27
Chen, Z., Teng, Y., Huang, L., Mi, N., Li, C., Ling, J., Gu, C., & Jin, X. (2021) · Chemical Engineering Journal · doi:10.1016/j.cej.2021.130436 · Cited by 26
Wilson, T. N., Nambiema, A., Porro, B., Descatha, A., Aublet‐Cuvelier, A., Evanoff, B., & Roquelaure, Y. (2022) · Journal of Occupational Rehabilitation · doi:10.1007/s10926-022-10052-9 · Cited by 28
Ayodele, A. E., & Obeng-Gyasi, E. (2024) · Cancers · doi:10.3390/cancers16050983 · Cited by 29
Development and child health in a world of synthetic chemicals
Wager, J. L., & Thompson, J. A. (2024) · Pediatric Research · doi:10.1038/s41390-024-03547-z · Cited by 29
Household low pile carpet usage was associated with increased serum PFAS concentrations in 2005–2006
Zhu, Y., Ro, A. E., & Bartell, S. M. (2021) · Environmental Research · doi:10.1016/j.envres.2021.110758 · Cited by 25
Ultra-processed food (UPF) intake in pregnancy and maternal and neonatal outcomes
Avraham, S. B., Kohn, E., Tepper, S., Lubetzky, R., Mandel, D., Berkovitch, M., & Shahar, D. R. (2023) · European Journal of Nutrition · doi:10.1007/s00394-022-03072-x · Cited by 27
Papadopoulou, E., Botton, J., Caspersen, I. H., Alexander, J., Eggesbø, M. Å., Haugen, M. A., Iszatt, N., Jacobsson, B., Knutsen, H. K., Meltzer, H. M., et al. (2021) · International Journal of Epidemiology · doi:10.1093/ije/dyab035 · Cited by 24
Hall, A. M., Fleury, E. S., Papandonatos, G. D., Buckley, J. P., Cecil, K. M., Chen, A., Lanphear, B. P., Yolton, K. A., Walker, D. I., Pennell, K. D., et al. (2023) · Environmental Science & Technology · doi:10.1021/acs.est.3c07515 · Cited by 24
Zamfir, M., Gerstner, D., Walser, S., Bünger, J., Eikmann, T., Heinze, S., Kolk, A., Nowak, D., Raulf, M., Sagunski, H., et al. (2019) · International Journal of Hygiene and Environmental Health · doi:10.1016/j.ijheh.2018.11.004 · Cited by 19
Scinicariello, F., Buser, M. C., Abadin, H. G., & Attanasio, R. (2020) · Environmental Research · doi:10.1016/j.envres.2020.109518 · Cited by 24
Effects of Per- and Polyfluoroalkylated Substances on Female Reproduction
González-Alvarez, M. E., Antwi-Boasiako, C., & Keating, A. F. (2024) · Toxics · doi:10.3390/toxics12070455 · Cited by 26
Assessing risk of bias in toxicological studies in the era of artificial intelligence
Härtung, T., Hoffmann, S., & Whaley, P. (2025) · Archives of Toxicology · doi:10.1007/s00204-025-03978-5 · Cited by 28
Fujii, Y., Harada, K. H., Haraguchi, K., & Koizumi, A. (2017) · Chemosphere · doi:10.1016/j.chemosphere.2017.02.073 · Cited by 23
Kowald, C., Brorman, E., Shankar, S., Klemashevich, C. L., Staack, D., & Pillai, S. D. (2020) · Radiation Physics and Chemistry · doi:10.1016/j.radphyschem.2020.109323 · Cited by 22
Negri, E., Bravi, F., Catalani, S., Guercio, V., Metruccio, F., Moretto, A., la Vecchia, C., & Apostoli, P. (2020) · Environmental Research · doi:10.1016/j.envres.2020.109305 · Cited by 20
Sgargi, D., Ádám, B., Budnik, L. T., Dinelli, G., Moldovan, H. R., Perry, M. J., Scheepers, P. T. J., Schlünssen, V., Teixeira, J. P., Mandrioli, D., et al. (2020) · Environmental Research · doi:10.1016/j.envres.2020.109470 · Cited by 22
Liu, Y., Liu, K., Zheng, P., Yin, S., Jin, H., Bai, X., Li, Y., Zheng, J., Dai, Y., Zhao, M., et al. (2020) · Environmental Pollution · doi:10.1016/j.envpol.2020.116202 · Cited by 21
Gross, R. S., Ghassabian, A., Vandyousefi, S., Messito, M. J., Gao, C., Kannan, K., & Trasande, L. (2020) · Environmental Pollution · doi:10.1016/j.envpol.2020.115427 · Cited by 21
Udesky, J. O., Dodson, R. E., Perovich, L. J., & Rudel, R. (2019) · Environmental Health · doi:10.1186/s12940-019-0537-8 · Cited by 21
Zhang, Y., Pan, C., Ren, Y., Wang, Z., Luo, J., Ding, G., Vinturache, A., Wang, X., Shi, R., Ouyang, F., et al. (2021) · The Science of The Total Environment · doi:10.1016/j.scitotenv.2021.151303 · Cited by 22
Peterson, A. K., Eckel, S. P., Habre, R., Yang, T., Faham, D., Farzan, S. F., Grubbs, B. H., Kannan, K., Robinson, M., Lerner, D. L., et al. (2022) · Frontiers in Epidemiology · doi:10.3389/fepid.2022.934715 · Cited by 23
Niemiec, S., Kechris, K. J., Pattee, J. W., Yang, I. V., Adgate, J. L., Calafat, A. M., Dabelea, D., & Starling, A. P. (2023) · Environmental Research · doi:10.1016/j.envres.2023.116215 · Cited by 22
Sapari, H., Selamat, M., Isa, M., Ismail, R., & Mahiyuddin, W. R. W. (2022) · JMIR Research Protocols · doi:10.2196/44702 · Cited by 22
Umweltbundesamt (2018) · Bundesgesundheitsblatt - Gesundheitsforschung - Gesundheitsschutz · doi:10.1007/s00103-018-2709-z · Cited by 20
Marks, K. J., Jeddy, Z., Flanders, W. D., Northstone, K., Fraser, A., Calafat, A. M., Kato, K., & Hartman, T. J. (2019) · Reproductive Toxicology · doi:10.1016/j.reprotox.2019.08.003 · Cited by 19
Reviews in environmental health: How systematic are they?
Sutton, P., Chartres, N., Rayasam, S. D. G., Daniels, N., Lam, J., Maghrbi, E., & Woodruff, T. J. (2021) · Environment International · doi:10.1016/j.envint.2021.106473 · Cited by 19
Self-citationMenegatto, M., Lezzi, S., Musolino, M., & Zamperini, A. (2022) · International Journal of Environmental Research and Public Health · doi:10.3390/ijerph192214761 · Cited by 21
Using systematic review in occupational safety and health
Howard, J., Piacentino, J. D., MacMahon, K. L., & Schulte, P. A. (2017) · American Journal of Industrial Medicine · doi:10.1002/ajim.22771 · Cited by 19
Chen, Z., Wang, X., Dong, R., Zhang, Y., Jin, X., & Gu, C. (2022) · Environmental Functional Materials · doi:10.1016/j.efmat.2022.11.002 · Cited by 18
Ellis, L. B., Molina, K., Robbins, C., Freisthler, M. S., Sgargi, D., Mandrioli, D., & Perry, M. J. (2023) · Environmental Health Perspectives · doi:10.1289/ehp12678 · Cited by 20
Lake, E. A., Karras, J., Marks, G. B., & Cowie, C. T. (2025) · PLoS ONE · doi:10.1371/journal.pone.0320048 · Cited by 23
Choi, J., Kim, J., & Lee, H. (2022) · International Journal of Environmental Research and Public Health · doi:10.3390/ijerph191811318 · Cited by 20
Hansmeier, N., Chao, T., Herbstman, J. B., Goldman, L. R., Witter, F. R., & Halden, R. U. (2014) · Journal of Proteome Research · doi:10.1021/pr500990w · Cited by 17
Prenatal exposure to perfluoroalkyl substances and adipocytokines: the HOME Study
Buck, C. O., Eliot, M., Kelsey, K. T., Calafat, A. M., Chen, A., Ehrlich, S. R., Lanphear, B. P., & Braun, J. M. (2018) · Pediatric Research · doi:10.1038/s41390-018-0170-1 · Cited by 16
Christensen, J. V. R., Bangash, K. K., Weihe, P., Grandjean, P., Nielsen, F., Jensen, T. K., & Petersen, M. S. (2021) · Reproductive Toxicology · doi:10.1016/j.reprotox.2021.06.016 · Cited by 16
Kinkade, C. W., Rivera‐Núñez, Z., Thurston, S. W., Kannan, K., Miller, R. K., Brunner, J., Wong, E., Groth, S. W., O’Connor, T. G., & Barrett, E. S. (2023) · Environmental Health · doi:10.1186/s12940-023-01009-3 · Cited by 16
Marks, K. J., Howards, P. P., Smarr, M. M., Flanders, W. D., Northstone, K., Daniel, J. H., Sjödin, A., Calafat, A. M., & Hartman, T. J. (2021) · Early Human Development · doi:10.1016/j.earlhumdev.2021.105450 · Cited by 16
Avanasi, R., Shin, H.-M., Vieira, V., & Bartell, S. (2016) · Environmental Research · doi:10.1016/j.envres.2016.01.011 · Cited by 15
Zhu, B. L., Sheng, N., & Dai, J. (2023) · The Science of The Total Environment · doi:10.1016/j.scitotenv.2023.169151 · Cited by 17
Hong, S., Kang, B. S., Kim, O., Won, S., Kim, H. S., Wie, J., Shin, J., Choi, S., Yun, S.-J., Kim, Y. H., et al. (2024) · Frontiers in Public Health · doi:10.3389/fpubh.2024.1351786 · Cited by 12
LaKind, J. S., Anthony, L. G., & Goodman, M. G. (2017) · Journal of Toxicology and Environmental Health Part B · doi:10.1080/10937404.2017.1370847 · Cited by 15
Marí-Bauset, S., Donat‐Vargas, C., González, A. L., Marí-Sanchis, A., Peraita‐Costa, I., Llopis-Morales, J., & Morales‐Suárez‐Varela, M. (2018) · Children · doi:10.3390/children5120157 · Cited by 17
More, S. J., Bampidis, V., Benford, D., Bragard, C., Hernández, A. F., Bennekou, S. H., Koutsoumanis, K. P., Lambré, C., Machera, K. A., Mennes, W. C., et al. (2024) · EFSA Journal · doi:10.2903/j.efsa.2024.8866 · Cited by 13
Yim, G., McGee, G., Gallagher, L. G., Baker, E., Jackson, B. P., Calafat, A. M., Botelho, J. C., Gilbert‐Diamond, D., Karagas, M. R., Romano, M. E., et al. (2023) · Chemosphere · doi:10.1016/j.chemosphere.2023.138644 · Cited by 13
Zell-Baran, L. M., Dabelea, D., Norris, J. M., Glueck, D. H., Adgate, J. L., Brown, J. M., Harrall, K. K., Calafat, A. M., & Starling, A. P. (2023) · Environmental Health Perspectives · doi:10.1289/ehp12863 · Cited by 13
Bali, S. K., Hall, K., Massoud, R. I., Almeida, N. M. S., & Wilson, A. K. (2024) · Environmental Science & Technology · doi:10.1021/acs.est.4c03648 · Cited by 13
Urban, J., Wikoff, D., Chappell, G., Harris, C., & Haws, L. (2020) · Toxicology · doi:10.1016/j.tox.2020.152427 · Cited by 12
Gennings, C., Wolk, A., Håkansson, N., Lindh, C. H., & Bornehag, C.-G. (2020) · BMJ Nutrition, Prevention & Health · doi:10.1136/bmjnph-2020-000099 · Cited by 15
(2020) · Bundesgesundheitsblatt - Gesundheitsforschung - Gesundheitsschutz · doi:10.1007/s00103-020-03101-2 · Cited by 12
Malits, J. R., Blustein, J., Trasande, L., & Attinà, T. M. (2017) · International Journal of Hygiene and Environmental Health · doi:10.1016/j.ijheh.2017.11.004 · Cited by 15
Bottini, I., Vecchi, S., Sario, M. D., Bauleo, L., Trentalange, A., Michelozzi, P., & Ancona, C. (2025) · BMC Public Health · doi:10.1186/s12889-025-23150-z · Cited by 18
Li, M., Xu, C.-K., Li, L.-W., Gao, F., Xu, C., Yu, Y., Huang, C., Liu, Y.-N., Shen, X., & Hu, J.-Y. (2025) · Environmental Science and Technology · doi:10.1021/acs.est.5c07230 · Cited by 14
PFAS-contaminated drinking water harms infants
Baluja, R., Guo, B., Howden, W., Langer, A., & Lemoine, D. M. (2025) · Proceedings of the National Academy of Sciences · doi:10.1073/pnas.2509801122 · Cited by 15
Vela-Soria, F., Serrano‐López, L., García-Villanova, J., de Haro, T., Olea, N., & Freire, C. (2020) · Analytical and Bioanalytical Chemistry · doi:10.1007/s00216-020-02924-x · Cited by 13
Avanasi, R., Shin, H.-M., Vieira, V., & Bartell, S. (2016) · Environmental Research · doi:10.1016/j.envres.2016.08.019 · Cited by 12
Wu, M., Wu, Y., Guo, W., Xi, J., Miao, M., Zhao, H., Liang, H., Xue, J., Zhu, H., & Sun, H. (2025) · Environmental Research · doi:10.1016/j.envres.2025.122488 · Cited by 11
Perfluorooctanoic acid induces transcriptomic alterations in second trimester human cytotrophoblasts
Chen, H., Kapidzic, M., Gantar, D., Aksel, S., Levan, J., Abrahamsson, D., Jigmeddagva, U., Basrai, S., San, A., Gaw, S. L., et al. (2023) · Toxicological Sciences · doi:10.1093/toxsci/kfad097 · Cited by 12
Self-citationPacyga, D. C., Papandonatos, G. D., Rosas, L., Whalen, J., Smith, S. C., Park, J.-S., Gardiner, J. C., Braun, J. M., Schantz, S. L., & Strakovsky, R. S. (2024) · International Journal of Hygiene and Environmental Health · doi:10.1016/j.ijheh.2024.114380 · Cited by 11
Incorporation of fetal and child PFOA dosimetry in the derivation of health-based toxicity values
Kieskamp, K. K., Worley, R. R., McLanahan, E. D., & Verner, M.-A. (2018) · Environment International · doi:10.1016/j.envint.2017.12.019 · Cited by 12
Dishaw, L. V., Yost, E. E., Arzuaga, X., Luke, A. M., Kraft, A., Walker, T. D., & Thayer, K. (2020) · Environment International · doi:10.1016/j.envint.2020.105736 · Cited by 11
Association between noise exposure during pregnancy and pregnancy complications: A meta-analysis
Wang, Z., Qian, R., Xiang, W., Sun, L., Xu, M., Zhang, B., Yang, L., Zhu, S., Zeng, L., & Yang, W. (2022) · Frontiers in Psychology · doi:10.3389/fpsyg.2022.1026996 · Cited by 13
Huang, I., Mak, D., Cheung, P., Abraham, M., Clemens, T., & Turner, S. (2019) · Environmental Research · doi:10.1016/j.envres.2019.04.005 · Cited by 9
Stephens, M. L., Akgün-Ölmez, S. G., Hoffmann, S., de Vries, R. B. M., Flick, B., Härtung, T., Lalu, M. M., Maertens, A., Witters, H. E., Wright, R. A., et al. (2019) · Toxicological Sciences · doi:10.1093/toxsci/kfz128 · Cited by 13
Marí-Bauset, S., Peraita-Costa, I., Donat-Vargas, C., Llopis-González, A., Marí-Sanchis, A., Llopis-Morales, J., & Morales Suárez-Varela, M. (2022) · Autism · doi:10.1177/13623613211039950 · Cited by 10
Prenatal metal(loid) exposure and preterm birth: a systematic review of the epidemiologic evidence
Eaves, L. A., Lodge, E. K., Rohin, W. R., Roell, K., Manuck, T. A., & Fry, R. C. (2025) · Journal of Exposure Science and Environmental Epidemiology · doi:10.1038/s41370-025-00744-8 · Cited by 10
Work Exposome and Related Disorders of Firefighters: An Overview of Systematized Reviews
Descatha, A., Dousseau, H., Pitet, S., Magnolini, F., McMillan, N., Mangelsdorf, N., Swan, R., Steve, J.-M., Pourret, D., & Fadel, M. (2025) · Safety and Health at Work · doi:10.1016/j.shaw.2025.04.003 · Cited by 10
The Navigation Guide: Systematic Review for the Environmental Health Sciences
Barrett, J. R. (2014) · Environmental Health Perspectives · doi:10.1289/ehp.122-a283 · Cited by 10
Qian, Y. T., Zhang, Y., Zuh, A. A., & Qiao, W. (2020) · Ecotoxicology and Environmental Safety · doi:10.1016/j.ecoenv.2020.110879 · Cited by 10
Canet, M., Harbron, R. W., Thierry-Chef, I., & Cardis, E. (2022) · Cancer Epidemiology Biomarkers & Prevention · doi:10.1158/1055-9965.epi-22-0393 · Cited by 11
Chemical risk assessment and translation to socio-economic assessments
Chiu, W. A. (2017) · OECD environment working papers · doi:10.1787/a930054b-en · Cited by 10
Kaneko, K., Ito, Y., Ebara, T., Kato, S., Matsuki, T., Tamada, H., Sato, H., Saitoh, S., Sugiura-Ogasawara, M., Yatsuya, H., et al. (2022) · Frontiers in Endocrinology · doi:10.3389/fendo.2022.939366 · Cited by 6
Metadata
- Authors
- Koustas, E., Lam, J., Sutton, P., Johnson, P. I., Atchley, D. S., Sen, S., Robinson, K. A., Axelrad, D. A., & Woodruff, T. J.
- Affiliations
- Environmental Protection Agency (US)
- University of California, San Francisco (US)
- Department of Epidemiology and Biostatistics, University of California, San Francisco, San Francisco, California, USA
- Johns Hopkins University (US)
- Corresponding author
- Koustas, Erica
- Venue
- Environmental Health Perspectives
- Publisher
- American Chemical Society (ACS)
- Published
- 2014-06-25
- Volume
- 122
- Issue
- 10
- Pages
- 1015-1027
- ISSN
- 0091-6765 (ISSN-L)
- 1552-9924
- PMC
- PMC4181920
- OpenAlex
- W1969835924
- Cited by
- 349
- References
- 121
- Citations by year
- 2026: 5 · 2025: 14 · 2024: 14 · 2023: 30 · 2022: 25 · 2021: 41 · 2020: 60 · 2019: 31 · 2018: 30 · 2017: 42 · 2016: 24 · 2015: 22 · 2014: 10
- FWCI
- 3.08
- Type
- journal article
- Language
- en
- Open access
- gold
- doi.org
- Licence
- public-domain
- creativecommons.org/licenses/by/4.0/ (vor, 1283 d)
- Locations
- Environmental Health Perspectives (publishedVersion, public-domain)
- PubMed Central (publishedVersion, public-domain)
- PubMed (publishedVersion)
- eScholarship (California Digital Library) (submittedVersion)
- Funders
- National Institute of Environmental Health Sciences (ES018135, P01ES022841, ES022841, P20ES018135)
- Topics
- Physical Sciences › Environmental Science › Environmental Chemistry › Per- and polyfluoroalkyl substances research
- Physical Sciences › Environmental Science › Health, Toxicology and Mutagenesis › Toxic Organic Pollutants Impact
- Physical Sciences › Environmental Science › Health, Toxicology and Mutagenesis › Effects and risks of endocrine disrupting chemicals
- Keywords
- perfluorooctanoic acid, fetal growth, prenatal exposure, animal studies, birth weight, evidence synthesis, perfluorinated compounds, developmental toxicity
- MeSH terms
- Animals, Birth Weight, Caprylates, Environmental Health, Environmental Pollutants, Female, Fluorocarbons, Pregnancy, Evidence-Based Medicine, Fetal Development, Mice
About these checks
Registry, retraction, Cites and statistics results are computed, not judged, with one exception: a printed reference that no index lists is read once by a model before it counts as a citation error. Claims are extracted by a model and kept only when their quote appears verbatim in the text; each cited source is then checked, with a model’s help, for whether it says what the claim relies on. Those verdicts can be wrong — read the claim’s quote and the cited source before relying on one.
Statistics and arithmetic are recomputed, not judged.
Confidence bands are shown only for fields calibrated on our annotated test set. None is calibrated yet, so no band is shown.
What counts as a claim ›How we measure confidence ›How we check this ›
Are you an author, or do you see a problem with this page? Request a review
