

Speech Rhythms and Multiplexed Oscillatory Sensory Coding in the Human Brain
Open accessThe DOI matches its Crossref record; 77 of the 77 references it cites were found in a registry or an index.
Abstract
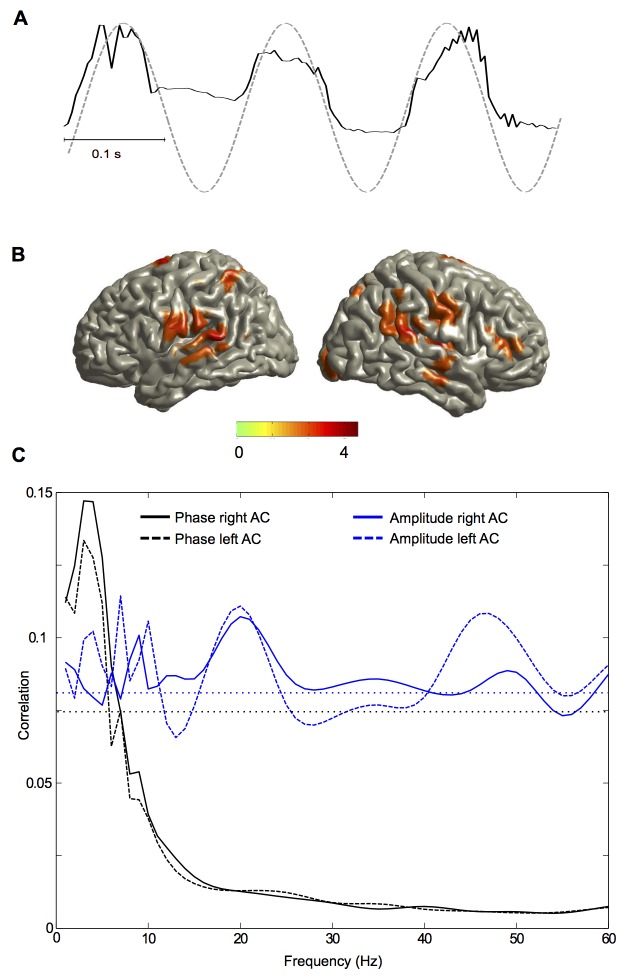
Cortical oscillations are likely candidates for segmentation and coding of continuous speech. Here, we monitored continuous speech processing with magnetoencephalography (MEG) to unravel the principles of speech segmentation and coding. We demonstrate that speech entrains the phase of low-frequency (delta, theta) and the amplitude of high-frequency (gamma) oscillations in the auditory cortex. Phase entrainment is stronger in the right and amplitude entrainment is stronger in the left auditory cortex. Furthermore, edges in the speech envelope phase reset auditory cortex oscillations thereby enhancing their entrainment to speech. This mechanism adapts to the changing physical features of the speech envelope and enables efficient, stimulus-specific speech sampling. Finally, we show that within the auditory cortex, coupling between delta, theta, and gamma oscillations increases following speech edges. Importantly, all couplings (i.e., brain-speech and also within the cortex) attenuate for backward-presented speech, suggesting top-down control. We conclude that segmentation and coding of speech relies on a nested hierarchy of entrained cortical oscillations.
Overview
The claims and statistics of this paper haven’t been checked yet.
Free: it reads the open-access text and checks the first 5 claims that cite a source we can check. Create a free account to check every claim.
Integrity signals
Registry
Cites
Statistics
Figures



Verification
Claims the paper makes
The claims and statistics of this paper haven’t been checked yet.
Free: it reads the open-access text and checks the first 5 claims that cite a source we can check. Create a free account to check every claim.
Claims other papers make about this one
Each is checked against this paper’s own text: does it say what the citing paper says it does?
The source backs part of the claim, not all of it — or backs it for a different population, condition or comparison.
In the citing paper
“Biologically, this may be a description of central pattern generators [110, 117] that underwrite rhythmical activity (e.g., walking and talking) that is characteristic of biological systems [118].”
From The free energy principle made simpler but not too simple (2023) · cites this paper as [117]
Experimental — accuracy not yet measured
Self-check
Percentages, sums and reported differences re-computed from the paper’s own numbers.
The self-check needs the paper’s full text.
Citations
Cites
Controlling the False Discovery Rate: A Practical and Powerful Approach to Multiple Testing
Benjamini, Y., & Hochberg, Y. (1995) · Journal of the Royal Statistical Society Series B: Statistical Methodology · doi:10.1111/j.2517-6161.1995.tb02031.x · Cited by 109,482
Elements of Information Theory
Cover, T. M., & Thomas, J. A. (2001) · Wiley eBooks · doi:10.1002/0471200611 · Cited by 36,808
Brainard, D. H. (1997) · Spatial Vision · doi:10.1163/156856897x00357 · Cited by 19,702
A method for registration of 3-D shapes
Besl, P. J., & McKay, N. D. (1992) · IEEE Transactions on Pattern Analysis and Machine Intelligence · doi:10.1109/34.121791 · Cited by 18,103
Oostenveld, R., Fries, P., Maris, E., & Schoffelen, J.-M. (2011) · Computational Intelligence and Neuroscience · doi:10.1155/2011/156869 · Cited by 10,323
The cortical organization of speech processing
Hickok, G., & Poeppel, D. (2007) · Nature Reviews Neuroscience · doi:10.1038/nrn2113 · Cited by 5,495 · cited 2×
“These results support the asymmetric sampling in time (AST) model [12,14,40] Speech Rhythms and Multiplexed Oscillatory Coding”
BackgroundResultMeasuring phase synchrony in brain signals
Lachaux, J.-P., Rodriguez, E., Martinerie, J., & Varela, F. J. (1999) · Human Brain Mapping · doi:10.1002/(sici)1097-0193(1999)8:4<194::aid-hbm4>3.0.co;2-c · Cited by 3,798
CircStat : A MATLAB Toolbox for Circular Statistics
Berens, P. (2009) · Journal of Statistical Software · doi:10.18637/jss.v031.i10 · Cited by 3,099
High Gamma Power Is Phase-Locked to Theta Oscillations in Human Neocortex
Canolty, R. T., Edwards, E., Dalal, S. S., Soltani, M., Nagarajan, S. S., Kirsch, H. E., Berger, M. S., Barbaro, N. M., & Knight, R. T. (2006) · Science · doi:10.1126/science.1128115 · Cited by 2,650
Spectral Analysis for Physical Applications
Percival, D. B., & Walden, A. T. (1993) · Cambridge University Press eBooks · doi:10.1017/cbo9780511622762 · Cited by 2,161
Cited by
Items 401–500 of 613
Brain Oscillations in Human Communication
Rimmele, J., Groß, J., Molholm, S., & Keitel, A. (2018) · Frontiers research topics · doi:10.3389/978-2-88945-458-7 · Cited by 6
Oganian, Y., Kojima, K., Breska, A., Cai, C., Findlay, A., Chang, E. F., & Nagarajan, S. S. (2020) · bioRxiv (Cold Spring Harbor Laboratory) · doi:10.1101/2020.04.02.022616 · Cited by 8
The neural basis for auditory and audiovisual speech perceptionPreprint
Peelle, J. E. (2019) · PsyArXiv (OSF Preprints) · doi:10.31234/osf.io/39ej7 · Cited by 7
Preisig, B. C., & Meyer, M. E. (2025) · Neuroscience & Biobehavioral Reviews · doi:10.1016/j.neubiorev.2025.106111 · Cited by 8
Osorio, S., & Assaneo, M. F. (2025) · PLoS ONE · doi:10.1371/journal.pone.0320519 · Cited by 7
Biau, E., Wang, D., Park, H., Jensen, O. B., & Hanslmayr, S. (2025) · Journal of Neuroscience · doi:10.1523/jneurosci.1797-24.2025 · Cited by 9
Theta Band (4–8 Hz) Oscillations Reflect Online Processing of Rhythm in Speech Production
Yan, Q., & Zhang, Q. (2022) · Brain Sciences · doi:10.3390/brainsci12121593 · Cited by 6
Celma-Miralles, A., Seeberg, A. B., Haumann, N. T., Vuust, P., & Petersen, B. (2024) · Hearing Research · doi:10.1016/j.heares.2024.109105 · Cited by 7
Parvez, L., Keshavarzi, M., Richards, S., Liberto, G. M. D., & Goswami, U. (2024) · Journal of Speech Language and Hearing Research · doi:10.1044/2024_jslhr-24-00031 · Cited by 7
Endogenous auditory and motor brain rhythms predict individual speech tracking
Lubinus, C., Keitel, A., Obleser, J., Poeppel, D., & Rimmele, J. M. (2026) · PLoS Biology · doi:10.1371/journal.pbio.3003924 · Cited by 7
A systematic review of EEG-based Imagined Speech decoding
Jin, Z., Li, D., & Huang, S. (2025) · Applied Soft Computing · doi:10.1016/j.asoc.2025.113563 · Cited by 9
Neural Entrainment by Speech in Human Auditory Cortex Revealed by Intracranial Recordings
Akkol, S., Mishra, A., Markowitz, N., Espinal, E., Keshishian, M., Mesgarani, N., Schroeder, C., Mehta, A. D., & Bickel, S. (2025) · Progress in Neurobiology · doi:10.1016/j.pneurobio.2025.102823 · Cited by 5
Niesen, M., Bourguignon, M., Bertels, J., Ghinst, M. V., Wens, V., Goldman, S., & Tiège, X. D. (2022) · NeuroImage · doi:10.1016/j.neuroimage.2022.119770 · Cited by 7
Cortical waves and post‐stroke brain stimulation
Bessonov, N., Beuter, A. C., Trofimchuk, S. I., & Volpert, V. A. (2019) · Mathematical Methods in the Applied Sciences · doi:10.1002/mma.5620 · Cited by 6
Schultz, B. G., Biau, E., & Kotz, S. A. (2020) · Journal of Neuroscience Methods · doi:10.1016/j.jneumeth.2020.108830 · Cited by 5
Neural synchronization and intervention in pre‐readers who later on develop dyslexia
Herck, S. V., Economou, M., Bempt, F. V., Glatz, T., Ghesquière, P., Vandermosten, M., & Wouters, J. M. (2022) · European Journal of Neuroscience · doi:10.1111/ejn.15894 · Cited by 11
Human Hippocampal Theta Oscillations: Distinctive Features and Interspecies Commonalities
Jacobs, J., Lega, B. C., & Watrous, A. J. (2017) · Springer eBooks · doi:10.1007/978-3-319-50406-3_2 · Cited by 7
Dynamics of functional networks for syllable and word-level processingPreprint
Rimmele, J. M., Sun, Y., Michalareas, G., Ghitza, O., & Poeppel, D. (2019) · bioRxiv (Cold Spring Harbor Laboratory) · doi:10.1101/584375 · Cited by 6
Studying rhythm processing in speech through the lens of auditory-motor synchronization
Luo, L., & Lu, L. (2023) · Frontiers in Neuroscience · doi:10.3389/fnins.2023.1146298 · Cited by 10
Electromagnetic Field Theories of Consciousness: Opportunities and Obstacles
(2024) · Frontiers research topics · doi:10.3389/978-2-8325-4596-6 · Cited by 5
Cross-Linguistic and Acoustic-Driven Effects on Multiscale Neural Synchrony to Stress Rhythms
He, D., Buder, E. H., & Bidelman, G. M. (2023) · Brain and Language · doi:10.1016/j.bandl.2024.105463 · Cited by 5
Fixed and flexible perceptual rhythms
Kaltenmaier, A., Davis, M. H., & Press, C. (2025) · Trends in Cognitive Sciences · doi:10.1016/j.tics.2025.05.011 · Cited by 7
Daikoku, T., & Goswami, U. (2026) · Neurobiology of Language · doi:10.1162/nol.a.226 · Cited by 5
Reduced neural speech tracking in adolescents with listening difficulty
Kojima, K., Liu, C., Ehrlich, S. R., Dillon, H., Blankenship, C. M., Zadeh, L. M., Vannest, J. J., Hunter, L. L., Nagarajan, S. S., & Moore, D. R. (2026) · Clinical Neurophysiology · doi:10.1016/j.clinph.2026.2111502 · Cited by 4
Multimodal acoustic-electric trigeminal nerve stimulation modulates conscious perception
Wu, M., Auksztulewicz, R., & Riecke, L. (2023) · NeuroImage · doi:10.1016/j.neuroimage.2023.120476 · Cited by 5
Samoylov, I., Arcara, G., Buyanova, I., Юрьевна, Д. Е., Станиславаовна, П. Д., Sorokin, A. B., Анатольевна, Т. С., Mamokhina, U. A., Касимовна, Д. К., Dragoy, O., et al. (2024) · International Journal of Psychophysiology · doi:10.1016/j.ijpsycho.2024.112405 · Cited by 4
Development of spectro-temporal features of speech in children
Gautam, S., & Singh, L. (2017) · International Journal of Speech Technology · doi:10.1007/s10772-017-9424-2 · Cited by 4
Functional connectivity of stimulus-evoked brain responses to natural speech in post-stroke aphasia
Mehraram, R., Clercq, P. D., Kries, J., Vandermosten, M., & Francart, T. (2024) · Journal of Neural Engineering · doi:10.1088/1741-2552/ad8ef9 · Cited by 6
Dynamics of Periodic Waves in a Neural Field Model
Bessonov, N., Beuter, A. C., Trofimchuk, S. I., & Volpert, V. A. (2020) · Mathematics · doi:10.3390/math8071076 · Cited by 5
Kegler, M., & Reichenbach, T. (2020) · NeuroImage · doi:10.1016/j.neuroimage.2020.117427 · Cited by 4
Multimodal evidence for predictive coding in sentence oral reading
Zhao, B., Zhang, G., Wang, L., & Dang, J. (2023) · Cerebral Cortex · doi:10.1093/cercor/bhad145 · Cited by 4
Lewis, A. (2020) · Language Cognition and Neuroscience · doi:10.1080/23273798.2020.1734640 · Cited by 4
Neural Speech Tracking in Newborns: Prenatal Learning and Contributing FactorsPreprint
Florea, C., Reimann, M., Schmidt, F., Preiß, J., Reisenberger, E., Angerer, M., Ameen, M. S., Heib, D. P. J., Roehm, D., & Schabus, M. (2024) · SSRN Electronic Journal · doi:10.1101/2024.03.18.585222 · Cited by 11
Keshavarzi, M., Moore, B. C. J., & Goswami, U. (2026) · Imaging Neuroscience · doi:10.1162/imag.a.1329 · Cited by 3
Moon, J., & Chau, T. T. (2022) · Speech Communication · doi:10.1016/j.specom.2023.01.007 · Cited by 3
Maturational Constraints on Tracking of Temporal Attention in Infant Language Acquisition
Snijders, T. M., & Menn, K. H. (2026) · Cambridge University Press eBooks · doi:10.1017/9781009295888.044 · Cited by 4
The impact of speaker accent on discourse processing: A frequency investigation
Thomas, T., Martin, C. D., & Caffarra, S. (2024) · Brain and Language · doi:10.1016/j.bandl.2024.105509 · Cited by 3
Phase-amplitude coupling within MEG data can identify eloquent cortex
Das, S., Tyner, K., & Gliske, S. (2025) · Journal of Neural Engineering · doi:10.1088/1741-2552/add37c · Cited by 3
Su, Z., Zhou, X., & Wang, L. (2023) · Cerebral Cortex · doi:10.1093/cercor/bhad240 · Cited by 3
Tune, S., & Obleser, J. (2023) · eLife · doi:10.7554/elife.92079 · Cited by 3
van der Heijden, K., Patel, P., Bickel, S., Herrero, J. L., Mehta, A. D., & Mesgarani, N. (2025) · Journal of Neuroscience · doi:10.1523/jneurosci.0754-25.2025 · Cited by 4
Mandke, K. N., & Rocha, S. (2026) · Cambridge University Press eBooks · doi:10.1017/9781009295888.043 · Cited by 4
Enhancing Intensity Differences in EEG Cross-Frequency Coupling Maps for Dyslexia Detection
Castillo-Barnés, D., Ortíz, A., Stabile, P., Gallego-Molina, N. J., Figueiredo, P., & Luque, J. L. (2024) · Lecture notes in computer science · doi:10.1007/978-3-031-61140-7_6 · Cited by 3
Dual-stream accounts bridge the gap between monkey audition and human language processing
Garrod, S., & Pickering, M. J. (2016) · Physics of Life Reviews · doi:10.1016/j.plrev.2016.01.008 · Cited by 3
Self-citationKandylaki, K. D., & Kotz, S. A. (2020) · Language Cognition and Neuroscience · doi:10.1080/23273798.2020.1757729 · Cited by 6
Rapela, J. (2017) · arXiv (Cornell University) · doi:10.48550/arxiv.1705.01615 · Cited by 3
Distracting Linguistic Information Impairs Neural Tracking of Attended SpeechPreprint
Dai, B., McQueen, J. M., Terporten, R., Peter Hagoort, A., & Kösem, A. (2018) · bioRxiv (Cold Spring Harbor Laboratory) · doi:10.1101/364042 · Cited by 3
Bourguignon, M., Molinaro, N., Lizarazu, M., Taulu, S., Jousmäki, V., Lallier, M., Carreiras, M., & Tiège, X. D. (2019) · bioRxiv (Cold Spring Harbor Laboratory) · doi:10.1101/744151 · Cited by 3
Daikoku, T., & Goswami, U. (2020) · bioRxiv (Cold Spring Harbor Laboratory) · doi:10.1101/2020.08.18.255117 · Cited by 4
Corcoran, A. W., Perera, R., Koroma, M., Kouider, S., Hohwy, J., & Andrillon, T. (2021) · bioRxiv (Cold Spring Harbor Laboratory) · doi:10.1101/2021.09.06.459160 · Cited by 3
Oderbolz, C., Sauppe, S., & Meyer, M. E. (2024) · bioRxiv (Cold Spring Harbor Laboratory) · doi:10.1101/2024.01.22.576636 · Cited by 3
Bahmer, A., Rimmele, J. M., & Gupta, D. S. (2024) · Frontiers in Computational Neuroscience · doi:10.3389/fncom.2024.1452001 · Cited by 3
Expertise Modulates Neural Stimulus-Tracking
Brookshire, G., Mangelsdorf, H. H., Sava‐Segal, C., Reis, K. S., Nusbaum, H. C., Goldin-Meadow, S., & Casasanto, D. J. (2021) · eNeuro · doi:10.1523/eneuro.0065-21.2021 · Cited by 4
Iverson, P., & Song, J. (2024) · eNeuro · doi:10.1523/eneuro.0507-23.2024 · Cited by 2
Daeglau, M., Otten, J., Grimm, G., Mirkovic, B., Hohmann, V., & Debener, S. (2025) · Frontiers in Human Neuroscience · doi:10.3389/fnhum.2025.1560558 · Cited by 6
Rong, P., & Liston, E. (2025) · Journal of Speech Language and Hearing Research · doi:10.1044/2025_jslhr-24-00286 · Cited by 3
Batterink, L. J., Liu, Y., Westerkamp, G. C., Citarella, J., Siekierski, P., Voorhees, L., Ethridge, L. E., Smith, E. G., Elmaghraby, R., Erickson, C. A., et al. (2026) · Autism Research · doi:10.1002/aur.70312 · Cited by 4
Tillmann, B., Goswami, U., & Moghimi, S. (2025) · Annals of the New York Academy of Sciences · doi:10.1111/nyas.70161 · Cited by 4
Effects of speech periodicity and speech rate on auditory-motor coupling during speech comprehension
Kwon, S., Lubinus, C., Kell, C. A., Keitel, A., & Rimmele, J. M. (2026) · Communications Biology · doi:10.1038/s42003-025-09481-y · Cited by 3
Closed-loop modulation of sleep in children undergoing intracranial recordings
Wong, S. M., Li, V., Mithani, K., Warsi, N. M., Suresh, H., Coleman, S. C., Arski, O. N., Massicotte, C., Sharma, R., Weil, A. G., et al. (2026) · Cell Reports Medicine · doi:10.1016/j.xcrm.2025.102538 · Cited by 7
Region-Specific Endogenous Brain Rhythms and Their Role for Speech and Language
Rimmele, J. M., & Keitel, A. (2026) · Cambridge University Press eBooks · doi:10.1017/9781009295888.005 · Cited by 2
Baus, C., Millan, I., Chen, X. J., & Blanco-Elorrieta, E. (2024) · Neurobiology of Language · doi:10.1162/nol_a_00141 · Cited by 4
Lo, C. Y., Dubinsky, E., Wright-Whyte, K., Zara, M., Singh, G., & Russo, F. (2024) · Quarterly Journal of Experimental Psychology · doi:10.1177/17470218241311204 · Cited by 2
Wang, L., & Chen, F. (2025) · Hearing Research · doi:10.1016/j.heares.2025.109298 · Cited by 2
Fiveash, A., Falk, S., & Tillmann, B. (2021) · Attention Perception & Psychophysics · doi:10.3758/s13414-021-02251-y · Cited by 7
Benz, K. R., Hauswald, A., Suess, N., Gehmacher, Q., Demarchi, G., Schmidt, F., Herzog, G., Rösch, S., & Weisz, N. (2025) · eNeuro · doi:10.1523/eneuro.0055-25.2025 · Cited by 6
Binaural Temporal Fine Structure Sensitivity for Children With Developmental Dyslexia
Flanagan, S. A., Moore, B. C. J., Wilson, A. M., Gabrielczyk, F. C., Macfarlane, A., Mandke, K. N., & Goswami, U. (2025) · Journal of Speech Language and Hearing Research · doi:10.1044/2025_jslhr-24-00543 · Cited by 3
Daikoku, T. (2025) · Lecture notes in computer science · doi:10.1007/978-3-032-02042-0_1 · Cited by 2
Oscillations and Synchrony in Attention
Keitel, C., Thut, G., & Groß, J. (2020) · Springer eBooks · doi:10.1007/978-1-0716-0653-7_3 · Cited by 2
Self-citationHari, R., & Puce, A. (2017) · Oxford University Press eBooks · doi:10.1093/med/9780190497774.003.0018 · Cited by 2
Evaluation of phase-locking to parameterized speech envelopes
David, W., Gransier, R., & Wouters, J. M. (2022) · Frontiers in Neurology · doi:10.3389/fneur.2022.852030 · Cited by 3
Complexity of STG signals and linguistic rhythm: a methodological study for EEG data
Pereira, S. S., Özer, E. E., & Sebastián‐Gallés, N. (2024) · Cerebral Cortex · doi:10.1093/cercor/bhad549 · Cited by 3
7. Executive Functioning and Self-Regulation
Hallam, S., & Himonides, E. (2022) · Open Book Publishers · doi:10.11647/obp.0292.07 · Cited by 2
Toward a comprehensive understanding of EEG and its analysesPreprint
da Rocha, A. F. (2020) · bioRxiv (Cold Spring Harbor Laboratory) · doi:10.1101/2020.02.14.948968 · Cited by 2
Interpretability of statistical approaches in speech and language neurosciencePreprint
Bouton, S., Chambon, V., Golestani, N., Formisano, E., Proix, T., & Giraud, A. (2019) · PsyArXiv (OSF Preprints) · doi:10.31234/osf.io/8vwcs · Cited by 2
Rhone, A. E., Farris‐Trimble, A., Nourski, K. V., Kawasaki, H., Howard, M. A., & McMurray, B. (2022) · PsyArXiv (OSF Preprints) · doi:10.31234/osf.io/bd6eh · Cited by 2
NIT: an open-source tool for information theoretic analysis of neural population dataPreprint
Maffulli, R., Casal, M. A., Celotto, M., Zucca, S., Safaai, H., Fellin, T., & Panzeri, S. (2022) · bioRxiv (Cold Spring Harbor Laboratory) · doi:10.1101/2022.12.11.519966 · Cited by 4
Self-citationAnastasopoulou, I., Cheyne, D., Lieshout, P. H. H. M. V., Ballard, K. J., Wilson, P. H., & Johnson, B. W. (2023) · bioRxiv (Cold Spring Harbor Laboratory) · doi:10.1101/2023.09.30.560288 · Cited by 3
Infants’ neural tracking of rhythm in spoken nursery rhymes relates to their vocabulary sizePreprint
Hahn, L. E., & Snijders, T. M. (2023) · doi:10.31234/osf.io/scnxq · Cited by 2
Speech and music recruit frequency-specific distributed and overlapping cortical networksPreprint
Rietmolen, N. T., Mercier, M. R., Trébuchon, A., Morillon, B., & Schön, D. (2024) · eLife · doi:10.7554/elife.94509.2 · Cited by 6
López‐Madrona, V. J., Giroud, J., Mercier, M. R., Lancia, L., Giordano, B. L., Trébuchon, A., Poeppel, D., Giraud, A., Arnal, L. H., & Morillon, B. (2025) · eLife · doi:10.1101/2025.10.22.683926 · Cited by 6
Habersetzer, T., Steuer, S., Radeloff, A., & Meyer, B. T. (2025) · Scientific Data · doi:10.1038/s41597-025-06397-4 · Cited by 6
Allostasis and uncertainty: An active inference perspective
Corcoran, A. W. (2021) · Figshare · doi:10.26180/16570770 · Cited by 3
Neural oscillatory dynamics of spoken word recognition
Strauß, A. (2015) · Cited by 2
Auditory temporal processing deficits in developmental dyslexia
Wang, R., & Bi, H. (2021) · Advances in Psychological Science · doi:10.3724/sp.j.1042.2021.01231 · Cited by 1
Sampling without Vision: Auditory Performance Fluctuates in Congenitally Blind Individuals
Khasis, E., Re, D., Kusnir, F., Bhat, A., & Landau, A. N. (2025) · Journal of Cognitive Neuroscience · doi:10.1162/jocn_a_02339 · Cited by 1
Tamura, S., & Okamoto, H. (2025) · Neuropsychologia · doi:10.1016/j.neuropsychologia.2025.109199 · Cited by 1
Kalashnikova, M., Burnham, D. K., & Goswami, U. (2025) · Brain Sciences · doi:10.3390/brainsci15091012 · Cited by 1
Cortical tracking reveals disrupted syntactic processing dynamics in aphasia
Rafferty, M. B., Saltuklaroglu, T., Paek, E. J., Reilly, K. J., Bowers, A., Stone, T. C., Jenson, D. E., Albornoz, A. H., & Casenhiser, D. M. (2026) · Cortex · doi:10.1016/j.cortex.2026.06.024 · Cited by 3
4. Literacy and Related Language Skills
Hallam, S., & Himonides, E. (2022) · Open Book Publishers · doi:10.11647/obp.0292.04 · Cited by 1
12. Re-Engagement and Motivation
Hallam, S., & Himonides, E. (2022) · Open Book Publishers · doi:10.11647/obp.0292.12 · Cited by 1
Children’s cortical speech tracking in face-to-face and online video communication
Sivridag, F., Schürholz, J., Hoehl, S., & Mani, N. (2025) · Scientific Reports · doi:10.1038/s41598-025-04778-8 · Cited by 1
Time Slows Down in the Future: Aging and the Brain Rhythms of Language
Murphy, E. (2025) · Topics in Cognitive Science · doi:10.1111/tops.70019 · Cited by 2
Atypical Lateralization to Amplitude Modulation in Chinese Adults With Reading Difficulty History
Jia, Y., Zhao, Y., Liu, J., He, Y., Tang, J., & Zhao, J. (2025) · Ear and Hearing · doi:10.1097/aud.0000000000001733 · Cited by 1
Zheng, X., Araújo, J., Busson, Q., & Goswami, U. (2026) · European Journal of Neuroscience · doi:10.1111/ejn.70709 · Cited by 1
Linguistic structure and language familiarity sharpen phoneme encoding in the brain
Tezcan, F., ten Oever, S., Bai, F., Rietmolen, N. T., & Martin, A. E. (2026) · Communications Biology · doi:10.1038/s42003-026-09865-8 · Cited by 3
Makki, A. S., Hemington, K. S., Rogachov, A., Cheng, J. C., Bosma, R. L., Osborne, N. R., El‐Sayed, R., Inman, R. D., Dunkley, B. T., & Davis, K. D. (2026) · Journal of Neurophysiology · doi:10.1152/jn.00492.2025 · Cited by 1
Pupil- and gaze dynamics track emotion content in naturalistic speech
Alpay, S. Ş., Keitel, C., Timmerman, R. H., & Keitel, A. (2026) · Scientific Reports · doi:10.1038/s41598-026-57256-0 · Cited by 1
Keshavarzi, M., Richards, S., Feltham, G., Parvez, L., & Goswami, U. (2026) · Brain and Language · doi:10.1016/j.bandl.2026.105797 · Cited by 4
Rautu, I.-S., Bourguignon, M., Wens, V., Jousmäki, V., Bertels, J., & Tiège, X. D. (2026) · Imaging Neuroscience · doi:10.1162/imag.a.1305 · Cited by 1
Metadata
- Authors
- Gross, J., Hoogenboom, N., Thut, G., Schyns, P., Panzeri, S., Belin, P., & Garrod, S.
- Affiliations
- University of Glasgow (GB)
- Heinrich Heine University Düsseldorf (DE)
- Italian Institute of Technology (IT)
- Corresponding author
- Gross, Joachim
- Venue
- PLoS Biology
- Publisher
- Public Library of Science (PLoS)
- Published
- 2013-12-31
- Volume
- 11
- Issue
- 12
- Pages
- e1001752
- ISSN
- 1544-9173 (ISSN-L)
- 1545-7885
- PMC
- PMC3876971
- OpenAlex
- W2029130465
- Cited by
- 643
- References
- 77
- Citations by year
- 2026: 45 · 2025: 50 · 2024: 52 · 2023: 59 · 2022: 80 · 2021: 57 · 2020: 62 · 2019: 56 · 2018: 50 · 2017: 37 · 2016: 45 · 2015: 39 · 2014: 10 · 2013: 1
- FWCI
- 17.37
- Type
- journal article
- Language
- en
- Open access
- gold
- doi.org
- Licence
- Locations
- PLoS Biology (publishedVersion, cc-by)
- PubMed Central (publishedVersion, cc-by)
- PubMed (publishedVersion)
- ENLIGHTEN (Jurnal Bimbingan dan Konseling Islam) (acceptedVersion)
- HAL (submittedVersion, cc-by)
- DOAJ (DOAJ: Directory of Open Access Journals) (submittedVersion, cc-by-sa)
- Figshare (submittedVersion, cc-by)
- Funders
- Wellcome Trust (098433/Z/12/Z, 091928, 098434, 098433, 98434)
- Agence Nationale de la Recherche (ANR-11-IDEX-0001)
- Medical Research Council (MC_G1001214)
- Economic and Social Research Council (ES/E020933/1, RES-060-25-0010)
- Topics
- Life Sciences › Neuroscience › Cognitive Neuroscience › Neural dynamics and brain function
- Life Sciences › Neuroscience › Cognitive Neuroscience › Neuroscience and Music Perception
- Life Sciences › Neuroscience › Cognitive Neuroscience › Neurobiology of Language and Bilingualism
- Keywords
- speech segmentation, speech coding, cortical oscillations, phase entrainment, auditory cortex, delta oscillations, theta oscillations, gamma oscillations, speech envelope, top-down control, hemispheric lateralization
- MeSH terms
- Adult, Auditory Cortex, Brain, Female, Humans, Functional Laterality, Magnetic Resonance Imaging, Male, Speech, Speech Perception, Magnetoencephalography, Young Adult, Functional Neuroimaging
About these checks
Registry, retraction, Cites and statistics results are computed, not judged, with one exception: a printed reference that no index lists is read once by a model before it counts as a citation error. Claims are extracted by a model and kept only when their quote appears verbatim in the text; each cited source is then checked, with a model’s help, for whether it says what the claim relies on. Those verdicts can be wrong — read the claim’s quote and the cited source before relying on one.
Statistics and arithmetic are recomputed, not judged.
Confidence bands are shown only for fields calibrated on our annotated test set. None is calibrated yet, so no band is shown.
What counts as a claim ›How we measure confidence ›How we check this ›
Are you an author, or do you see a problem with this page? Request a review
Data sources
Bibliographic data: Semantic Scholar, OpenAlex, Crossref.
Contains information from the Semantic Scholar Academic Graph Datasets, made available under the ODC Attribution License (ODC-BY 1.0).
Semantic Scholar’s data is described in: Kinney, R., et al. (2023). The Semantic Scholar Open Data Platform. arXiv:2301.10140.
