

The DOI matches its Crossref record; 70 of the 70 references it cites were found in a registry or an index; none of the 54 sources its claims cite is checked for support yet.
Nascent RHOH acts as a molecular brake on actomyosin-mediated effector functions of inflammatory neutrophils
Open accessAbstract
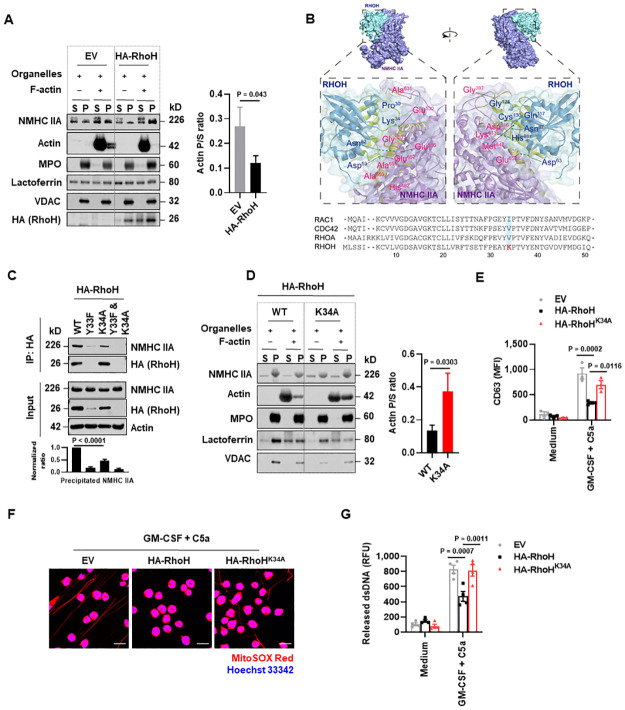
In contrast to molecular changes associated with increased inflammatory responses, little is known about intracellular counter-regulatory mechanisms that control signaling cascades associated with functional responses of neutrophils. Active RHO GTPases are typically considered as effector proteins that elicit cellular responses. Strikingly, we show here that RHOH, although being constitutively GTP-bound, limits neutrophil degranulation and the formation of neutrophil extracellular traps (NETs). Mechanistically, RHOH is induced under inflammatory conditions and binds to non-muscle myosin heavy chain IIA (NMHC IIA) in activated neutrophils in order to inhibit the transport of mitochondria and granules along actin filaments, which is partially reverted upon disruption of the interaction with NMHC IIA by introducing a mutation in RhoH at lysine 34 (RhoH K34A). In parallel, RHOH inhibits actin polymerization presumably by modulating RAC1 activity. In vivo studies using Rhoh-/- mice, demonstrate an increased antibacterial defense capability against Escherichia coli (E. coli). Collectively, our data reveal a previously undefined role of RHOH as a molecular brake for actomyosin-mediated neutrophil effector functions, which represents an intracellular regulatory axis involved in controlling the strength of an antibacterial inflammatory response.
Overview
CoChat Summary
Written by AI from the paper’s full text.
TL;DR
RHOH is induced in neutrophils by inflammatory signals and acts as a molecular brake on degranulation and NET formation by binding NMHC IIA and inhibiting actomyosin-dependent organelle transport and Rac1-driven actin polymerization. Rhoh-/- mice show enhanced NET formation and E. coli killing in experimental peritonitis.
Key findings
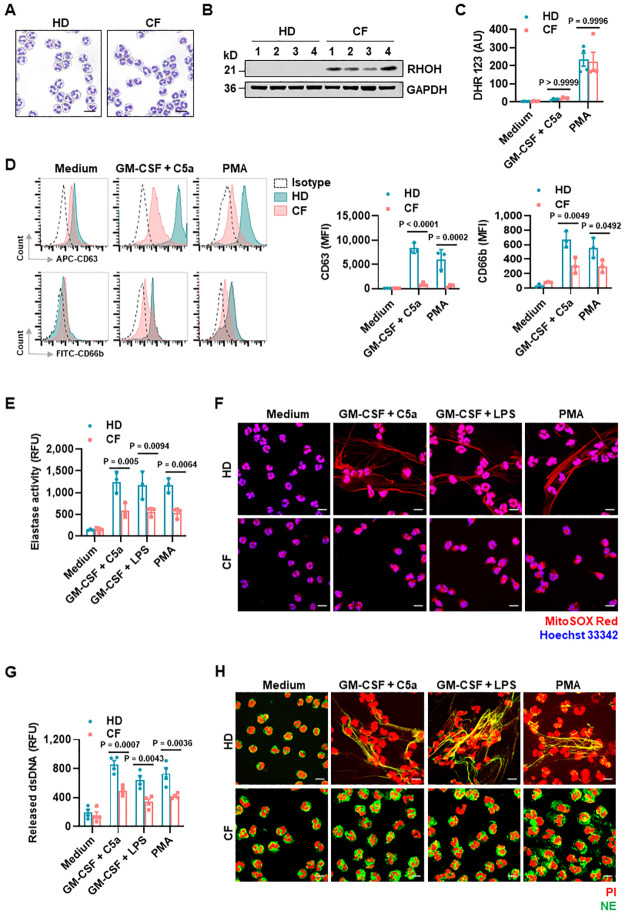
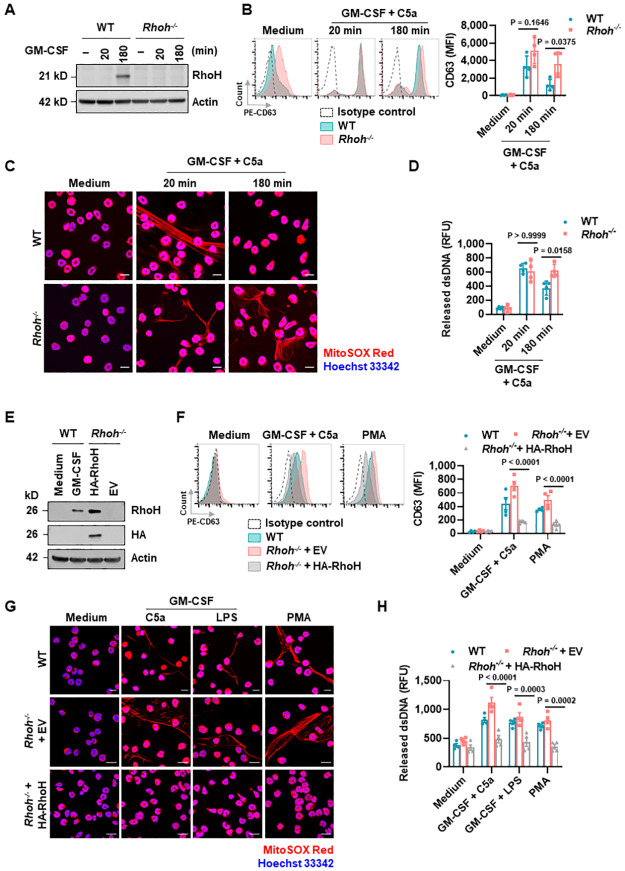
- RHOH expression is barely detectable in freshly isolated human and mouse neutrophils but is up-regulated by GM-CSF in less than 3 h; high RHOH is also detected in neutrophils from COVID-19 patients and mouse tumor-infiltrating neutrophils by scRNA-seq. CF neutrophils show high RHOH, impaired degranulation (reduced CD63/CD66b and elastase activity), and no detectable NETs/dsDNA release.
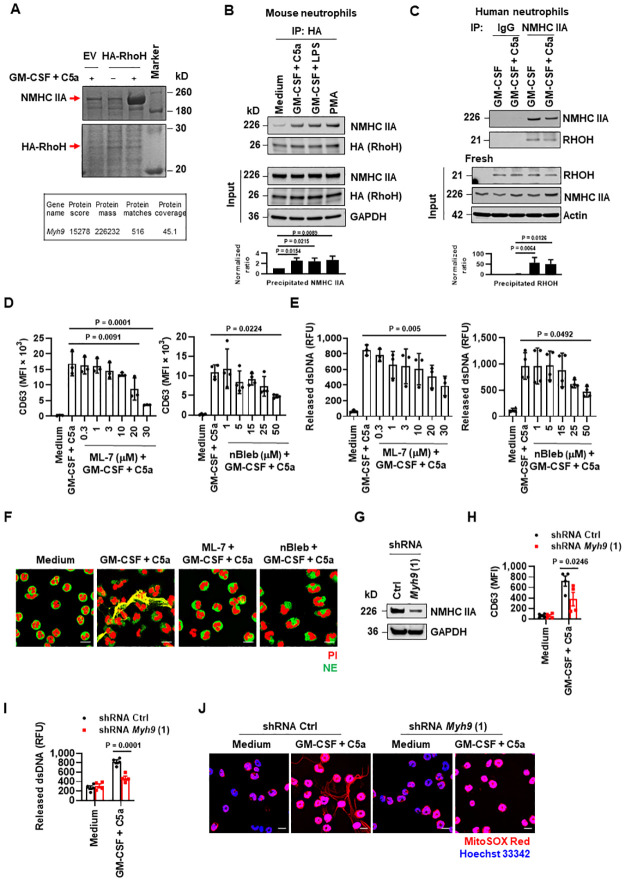
- RhoH interacts with non-muscle myosin heavy chain IIA (NMHC IIA; Myh9/myosin-9) in activated mouse and human neutrophils; mass spectrometry identified NMHC IIA with 45.1% coverage. The RhoH K34A mutation decreases this interaction, restores granule/mitochondria binding to F-actin, and partially rescues degranulation and dsDNA release.
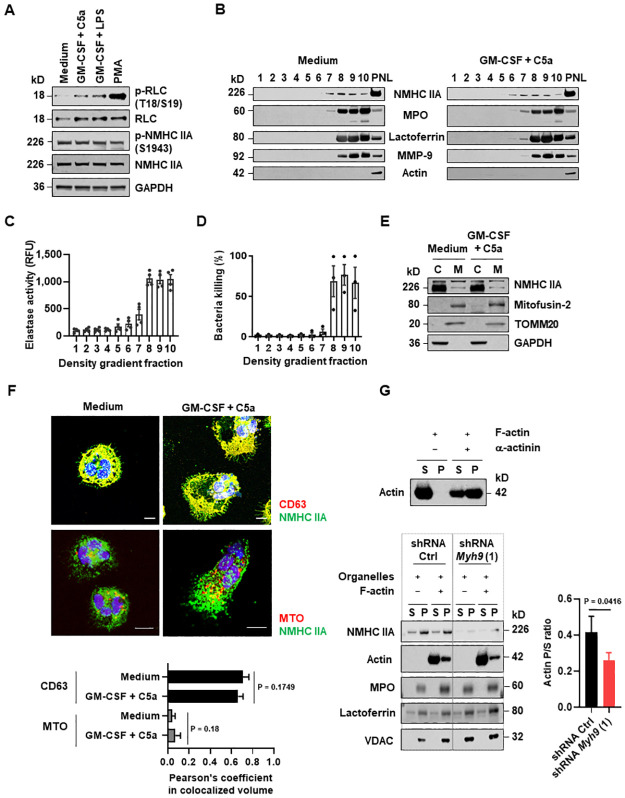
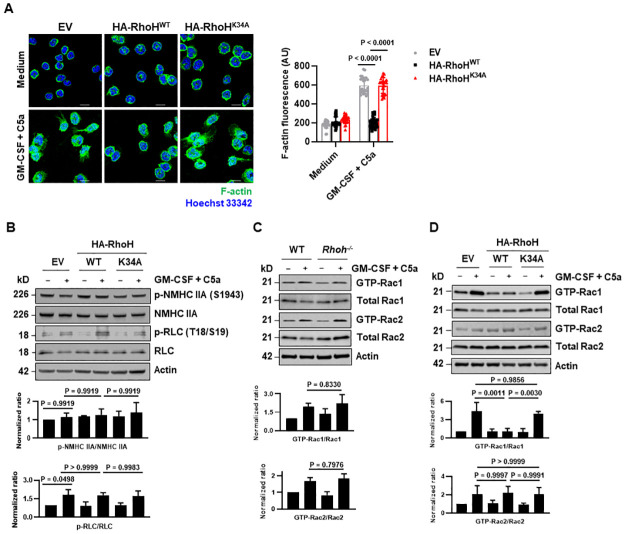
- RhoH overexpression reduces F-actin formation and Rac1 activity, but not Rac2, Cdc42, or RhoA activation; K34A abolishes the Rac1 inhibition. RhoH does not affect myosin IIA phosphorylation at T18/S19 or S1943.
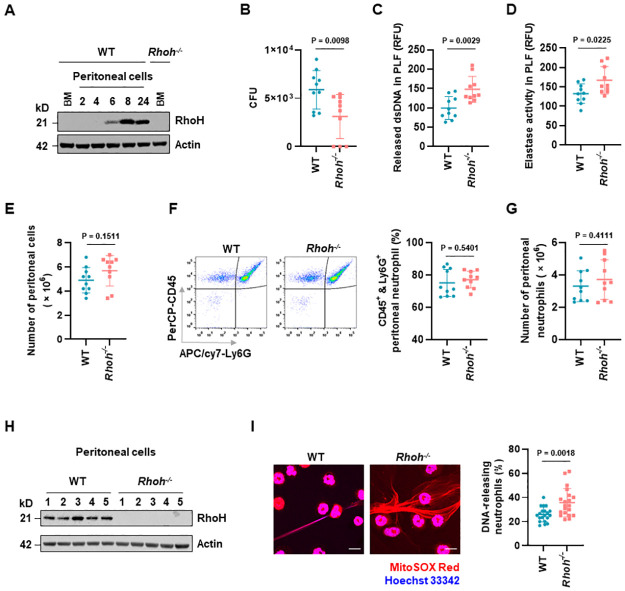
- In E. coli-induced peritonitis, Rhoh-/- mice had significantly reduced bacterial loads at 8 h, higher dsDNA and neutrophil elastase in peritoneal lavage fluid, and enhanced NET formation, with no significant difference in absolute neutrophil numbers; n = 10 per group unless mentioned otherwise.
Methods
- Human blood neutrophils from healthy donors and CF patients, mouse bone marrow neutrophils from WT and Rhoh-/- mice, and SCF-dependent HoxB8-immortalized myeloid progenitors reconstituted with HA-RhoH WT, K34A, Y33F, or double mutants, or Myh9 shRNA. Functional assays included flow cytometry for degranulation and ROS, PicoGreen dsDNA quantification, confocal microscopy for NETs/F-actin/microtubules, immunoblotting, co-immunoprecipitation, mass spectrometry, granule/mitochondria fractionation, actin-binding centrifugation, GTPase pulldown, and molecular docking.
- In vivo model: 50 × 10^6 E. coli-GFP injected intraperitoneally into WT and Rhoh-/- mice; mice sacrificed at 8 h; bacterial burden measured as CFU, peritoneal lavage fluid assayed for dsDNA and NE activity, and peritoneal cells analyzed by flow cytometry and immunoblotting.
- Statistics: data presented as means ± SD; unpaired two-tailed Student t test, one-way or two-way ANOVA as indicated; P < 0.05 considered significant.
Limitations
- Stated: COVID-19 restrictions limited the sample size for CF patient experiments; the molecular mechanism inducing RhoH expression remains unidentified; the mechanism by which RhoH suppresses Rac1 activation is unresolved; the authors cannot rule out NMHC IIA involvement in Rac1 activation; other myosin proteins may participate in organelle translocation.
- Evident from the text: many mechanistic assays rely on HoxB8 overexpression/reconstitution rather than primary human neutrophils, and several human CF comparisons use small sample sizes (n = 3–4 in Fig 1). The in vivo validation uses a single E. coli peritonitis model and a single 8 h time point.
Model-written summary. Check it against the paper before relying on it.
Integrity signals
Registry
Cites
Statistics
Figures
Verification
Claims the paper makes
79 Own result · 27 Own interpretation · 13 Check pending · 11 Own method · 7 No full text of the sources · 6 Not checked yet · 1 No basis given
A result the paper reports from its own data — it cites no other source for it, so there is none to check. The quote shows it is in the paper.
In the paper
“Moreover, following activation, neutrophils treated with CF serum exhibited a dramatic decrease in degranulation (S2B Fig), dsDNA release (S2C Fig), and in the formation of NETs (S2D Fig), as compared with neutrophils treated with HD serum.”
§ Nascent RHOH acts as a molecular brake on actomyosin-mediated effector functions of inflammatory neutrophils > Results > Extrinsic inflammatory signals induce RHOH expression in human neutrophils associated with reduced degranulation and NET formation
boostedstates a cause- Asserted: passes — The authors put it forward as true.
- Checkable: passes — It can be checked against evidence.
- Load-bearing: passes — The paper’s conclusions depend on it.
- Based: passes — The paper gives a reason why it holds.
A result the paper reports from its own data — it cites no other source for it, so there is none to check. The quote shows it is in the paper.
In the paper
“As a consequence, CF neutrophils generated no detectable NETs, as demonstrated by colocalization of extracellular DNA fibers and neutrophil elastase (NE) (Fig 1H).”
§ Nascent RHOH acts as a molecular brake on actomyosin-mediated effector functions of inflammatory neutrophils > Results > Extrinsic inflammatory signals induce RHOH expression in human neutrophils associated with reduced degranulation and NET formation
boosted- Asserted: passes — The authors put it forward as true.
- Checkable: passes — It can be checked against evidence.
- Load-bearing: passes — The paper’s conclusions depend on it.
- Based: passes — The paper gives a reason why it holds.
In the paper
“Consistent with the previous report [43], nBleb treatment caused an increased cell area in resting neutrophils.”
§ Nascent RHOH acts as a molecular brake on actomyosin-mediated effector functions of inflammatory neutrophils > Results > Myosin IIA associates with neutrophil organelles to mediate their binding with actin filaments
What the sources say
- Check pendingcites [43] A Zehrer, 2018, A Fundamental Role of Myh9 for Neutrophil Migration in Innate Immunity, J Immunol source
plainstates a cause- Asserted: passes — The authors put it forward as true.
- Checkable: passes — It can be checked against evidence.
- Load-bearing: unclear — It is unclear whether the paper’s conclusions depend on it.
- Based: passes — The paper gives a reason why it holds.
A result the paper reports from its own data — it cites no other source for it, so there is none to check. The quote shows it is in the paper.
In the paper
“Consistent with the similar amount of phosphorylation at S1943 in neutrophils before and after activation (Fig 4A), the presence of NMHC IIA in granules also did not change upon neutrophil activation (Fig 4B).”
§ Nascent RHOH acts as a molecular brake on actomyosin-mediated effector functions of inflammatory neutrophils > Results > Myosin IIA associates with neutrophil organelles to mediate their binding with actin filaments
plain- Asserted: passes — The authors put it forward as true.
- Checkable: passes — It can be checked against evidence.
- Load-bearing: unclear — It is unclear whether the paper’s conclusions depend on it.
- Based: passes — The paper gives a reason why it holds.
A result the paper reports from its own data — it cites no other source for it, so there is none to check. The quote shows it is in the paper.
In the paper
“Moreover, the Pearson’s coefficient value between the colocalized volume of NMHC IIA and CD63 or MTO indicated similar colocalization in resting and activated neutrophils (Fig 4F).”
§ Nascent RHOH acts as a molecular brake on actomyosin-mediated effector functions of inflammatory neutrophils > Results > Myosin IIA associates with neutrophil organelles to mediate their binding with actin filaments
hedged- Asserted: passes — The authors put it forward as true.
- Checkable: passes — It can be checked against evidence.
- Load-bearing: passes — The paper’s conclusions depend on it.
- Based: passes — The paper gives a reason why it holds.
- It may state two separate claims as one. 33
- The quote only partly states this claim. 3
- Probably not a substantial claim. 31
Create a free account to see these claims.
Create a free account to see these assumptions.
79 more claims
Create a free account to see all 144 claims and to verify the 31 references still open.
Self-check
Percentages, sums and reported differences re-computed from the paper’s own numbers.
Each contradiction between two passages listed here was confirmed by an independent check.
Rated minor: it would not touch a result — a value no result rests on, a p-value that stays on the same side of the significance level, or a conflict that is clerical, resolved elsewhere in the paper, or outside its own findings.
In the paper
§ Nascent RHOH acts as a molecular brake on actomyosin-mediated effector functions of inflammatory neutrophils > Discussion
“we also provide evidence for enhanced RHOH expression in neutrophils from COVID-19 and cancer patients.”
§ Nascent RHOH acts as a molecular brake on actomyosin-mediated effector functions of inflammatory neutrophils > Results > Extrinsic inflammatory signals induce RHOH expression in human neutrophils associated with reduced degranulation and NET formation
“High expression of RHOH is also detected in neutrophils from Coronavirus Disease 2019 (COVID-19) patients [39] and in tumor-infiltrating neutrophils in mice [40]”
Citations
Cites
Cell mechanics and the cytoskeleton
Fletcher, D. A., & Mullins, R. D. (2010) · Nature · doi:10.1038/nature08908 · Cited by 2,989
Non-muscle myosin II takes centre stage in cell adhesion and migration
Vicente‐Manzanares, M., Ma, X., Adelstein, R. S., & Horwitz, A. R. (2009) · Nature Reviews Molecular Cell Biology · doi:10.1038/nrm2786 · Cited by 2,137
Elborn, J. S. (2016) · The Lancet · doi:10.1016/s0140-6736(16)00576-6 · Cited by 1,805
Lood, C., Blanco, L. P., Purmalek, M. M., Carmona-Rivera, C., De Ravin, S. S., Smith, C. K., Malech, H. L., Ledbetter, J. A., Elkon, K. B., & Kaplan, M. J. (2016) · Nature Medicine · doi:10.1038/nm.4027 · Cited by 1,570
Single-Cell Analyses Inform Mechanisms of Myeloid-Targeted Therapies in Colon Cancer
Zhang, L., Li, Z., Skrzypczynska, K. M., Fang, Q., Zhang, W., O’Brien, S. A., He, Y., Wang, L., Zhang, Q., Kim, A., et al. (2020) · Cell · doi:10.1016/j.cell.2020.03.048 · Cited by 1,526
The multifaceted functions of neutrophils
Mayadas, T. N., Cullere, X., & Lowell, C. A. (2014) · Annual Review of Pathology: Mechanisms of Disease · doi:10.1146/annurev-pathol-020712-164023 · Cited by 1,356
Viable neutrophils release mitochondrial DNA to form neutrophil extracellular traps
Yousefi, S., Mihalache, C., Kozlowski, E., Schmid, I., & Simon, H. U. (2009) · Cell Death & Differentiation · doi:10.1038/cdd.2009.96 · Cited by 1,036
Self-citationMechanism of Blebbistatin Inhibition of Myosin II
Kovács, M., Tóth, J. S., Hetényi, C., Málnási‐Csizmadia, A., & Sellers, J. R. (2004) · Journal of Biological Chemistry · doi:10.1074/jbc.m405319200 · Cited by 1,022
Regulating Rho GTPases and their regulators
Hodge, R. G., & Ridley, A. J. (2016) · Nature Reviews Molecular Cell Biology · doi:10.1038/nrm.2016.67 · Cited by 872
COVID-19 immune features revealed by a large-scale single-cell transcriptome atlas
Ren, X., Wen, W., Fan, X., Hou, W., Su, B., Cai, P., Li, J., Liu, Y., Tang, F., Zhang, F., et al. (2021) · Cell · doi:10.1016/j.cell.2021.01.053 · Cited by 865
Cited by
Zhang, S., Sun, Z., Chen, Z., Bi, Y., Wei, S., Mao, Z., Jin, J., Ding, Y., & Wang, W. (2024) · Hepatology · doi:10.1097/hep.0000000000000773 · Cited by 37
Established and emerging roles for mitochondria in neutrophils
Peng, S., Gao, J., Stojkov, D., Yousefi, S., & Simon, H. (2022) · Immunological Reviews · doi:10.1111/imr.13158 · Cited by 37
Self-citationLi, C., Han, Y., Zhao, S., Kang, X., Zheng, Y., Cao, Y., Yan, Y., Shi, L., Wang, X., Lu, T., et al. (2025) · Signal Transduction and Targeted Therapy · doi:10.1038/s41392-025-02477-4 · Cited by 19
Molecular basis and current insights of atypical Rho small GTPase in cancer
Huang, H., Wang, S., Guan, Y., Ren, J., & Liu, X. (2024) · Molecular Biology Reports · doi:10.1007/s11033-023-09140-7 · Cited by 13
Gigon, L., Fettrelet, T., Miholic, M., McLeish, K. R., Yousefi, S., Stojkov, D., & Simon, H. (2023) · Frontiers in Immunology · doi:10.3389/fimmu.2023.1272699 · Cited by 11
Self-citation
Metadata
- Authors
- Peng, S., Stojkov, D., Gao, J., Oberson, K., Latzin, P., Casaulta, C., Yousefi, S., & Simon, H.-U.
- Affiliations
- University of Bern (CH)
- State Key Laboratory of Pharmaceutical Biotechnology (CN)
- Corresponding author
- Simon, Hans-Uwe
- Venue
- PLOS Biology
- Publisher
- Public Library of Science (PLoS)
- Published
- 2022-09-15
- Volume
- 20
- Issue
- 9
- Pages
- e3001794
- ISSN
- 1544-9173 (ISSN-L)
- 1545-7885
- PMC
- PMC9514642
- OpenAlex
- W4295932318
- Semantic Scholar
- d5f73f24cfeba91bccb4c47210f12b9cb46d6bd4
- Cited by
- 15
- References
- 70
- Citations by year
- 2026: 4 · 2025: 6 · 2024: 3 · 2023: 1 · 2022: 1
- FWCI
- 1.03
- Type
- journal article
- Language
- en
- Update notices
- new_version (2022-09-27)
- Open access
- gold
- doi.org
- Licence
- Locations
- PLoS Biology (publishedVersion, cc-by)
- PubMed Central (publishedVersion, cc-by)
- PubMed (publishedVersion)
- Bern Open Repository and Information System (University of Bern) (submittedVersion, cc-by)
- DOAJ (DOAJ: Directory of Open Access Journals) (submittedVersion, cc-by-sa)
- Open Access CRIS of the University of Bern
- Funders
- Schweizerischer Nationalfonds zur Förderung der Wissenschaftlichen Forschung (310030_184816, 31003A_173215)
- Russian Government Program “Recruitment of the Leading Scientists into the Russian Institutions of Higher Education” (075-15-2021-600)
- Topics
- Life Sciences › Immunology and Microbiology › Immunology › Neutrophil, Myeloperoxidase and Oxidative Mechanisms
- Life Sciences › Biochemistry, Genetics and Molecular Biology › Molecular Biology › Protein Kinase Regulation and GTPase Signaling
- Life Sciences › Biochemistry, Genetics and Molecular Biology › Molecular Biology › S100 Proteins and Annexins
- Keywords
- RhoH, Rho GTPases, neutrophils, actomyosin, non-muscle myosin heavy chain IIA, neutrophil degranulation, neutrophil extracellular traps, mitochondrial transport, granule transport, actin polymerization, Rac1, antibacterial defense, Escherichia coli, inflammation
- MeSH terms
- Actins, Actomyosin, Animals, Anti-Bacterial Agents, Cytoskeletal Proteins, Escherichia coli, Guanosine Triphosphate, Lysine, Actin Cytoskeleton, Neutrophils, Transcription Factors, Myosin Heavy Chains, rho GTP-Binding Proteins, Mice
About these checks
Registry, retraction, Cites and statistics results are computed, not judged, with one exception: a printed reference that no index lists is read once by a model before it counts as a citation error. Claims are extracted by a model and kept only when their quote appears verbatim in the text; each cited source is then checked, with a model’s help, for whether it says what the claim relies on. Those verdicts can be wrong — read the claim’s quote and the cited source before relying on one.
A language model drew the claims from the paper on 2026-11-12, under version 3 of the claim definition (model deepseek-v4.1-flash, prompt extract-v3).
A second model labelled each claim on 2026-11-12 (model jev-1.13-20260917, definition revision gold-guideline-v0.2).
Statistics and arithmetic are recomputed, not judged.
Confidence bands are shown only for fields calibrated on our annotated test set. None is calibrated yet, so no band is shown.
What counts as a claim ›How we measure confidence ›How we check this ›
Are you an author, or do you see a problem with this page? Request a review
