

The DOI matches its Crossref record; 49 of the 49 references it cites were found in a registry or an index.
Flexible Cognitive Strategies during Motor Learning
Open accessAbstract
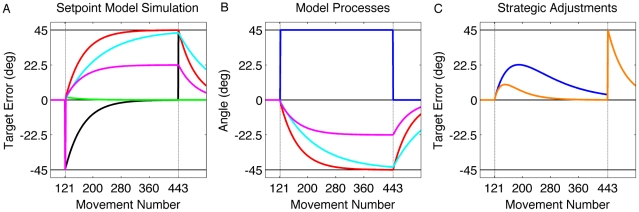
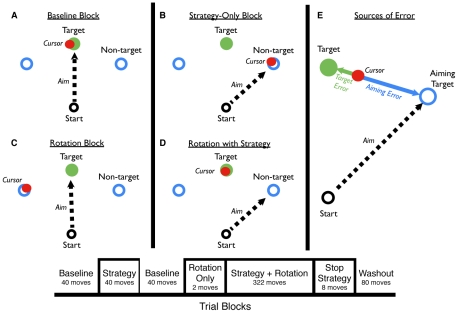
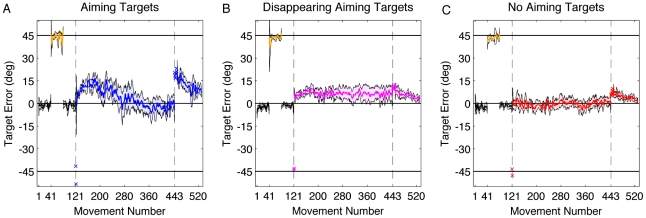
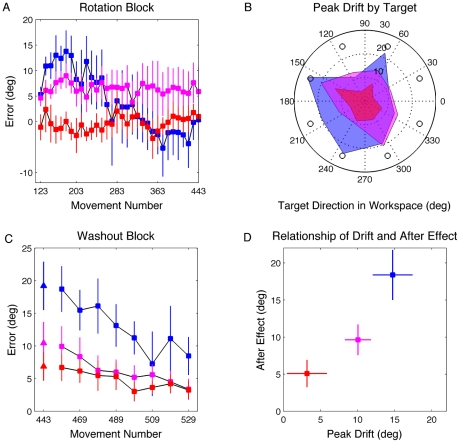
Visuomotor rotation tasks have proven to be a powerful tool to study adaptation of the motor system. While adaptation in such tasks is seemingly automatic and incremental, participants may gain knowledge of the perturbation and invoke a compensatory strategy. When provided with an explicit strategy to counteract a rotation, participants are initially very accurate, even without on-line feedback. Surprisingly, with further testing, the angle of their reaching movements drifts in the direction of the strategy, producing an increase in endpoint errors. This drift is attributed to the gradual adaptation of an internal model that operates independently from the strategy, even at the cost of task accuracy. Here we identify constraints that influence this process, allowing us to explore models of the interaction between strategic and implicit changes during visuomotor adaptation. When the adaptation phase was extended, participants eventually modified their strategy to offset the rise in endpoint errors. Moreover, when we removed visual markers that provided external landmarks to support a strategy, the degree of drift was sharply attenuated. These effects are accounted for by a setpoint state-space model in which a strategy is flexibly adjusted to offset performance errors arising from the implicit adaptation of an internal model. More generally, these results suggest that strategic processes may operate in many studies of visuomotor adaptation, with participants arriving at a synergy between a strategic plan and the effects of sensorimotor adaptation.
Overview
The claims and statistics of this paper haven’t been checked yet.
Run the check — free, no account needed. It reads the open-access text and checks the sources it cites.
Integrity signals
Registry
Cites
Statistics
Figures
Verification
Claims the paper makes
The claims and statistics of this paper haven’t been checked yet.
Run the check — free, no account needed. It reads the open-access text and checks the sources it cites.
Claims other papers make about this one
Each is checked against this paper’s own text: does it say what the citing paper says it does?
The source backs part of the claim, not all of it — or backs it for a different population, condition or comparison.
In the citing paper
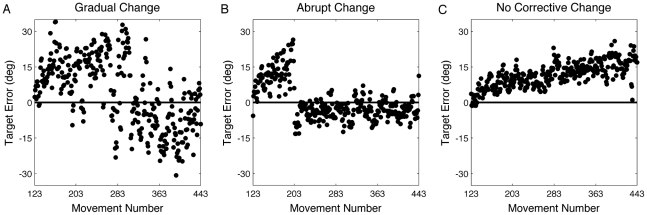
“However, when adaptation is allowed to progress over a large number of trials, task performance errors plateau and then decrease (Taylor and Ivry, 2011; Figure 1C).”
From Cerebellum, Predictions and Errors (2019) · cites this paper as Taylor and Ivry, 2011
Experimental — accuracy not yet measuredThe source backs part of the claim, not all of it — or backs it for a different population, condition or comparison.
In the citing paper
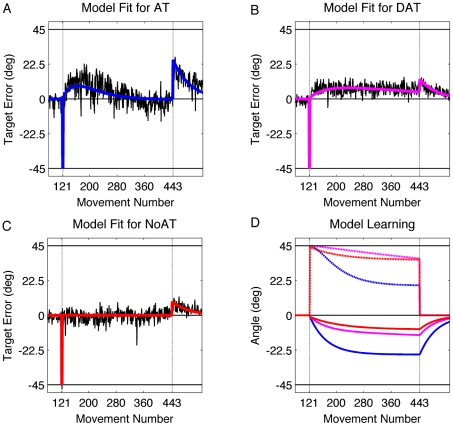
“Recent work has emphasized that controlling and learning self-directed motor behaviors involves both an implicit forward model of the effector and an explicit model of the task (Taylor and Ivry, 2011; Streng et al., 2018b; see Figure 1F).”
From Cerebellum, Predictions and Errors (2019) · cites this paper as Taylor and Ivry, 2011
Experimental — accuracy not yet measured
Self-check
Percentages, sums and reported differences re-computed from the paper’s own numbers.
The self-check needs the paper’s full text.
Citations
Cites
A Simplex Method for Function Minimization
Nelder, J. A., & Mead, R. (1965) · The Computer Journal · doi:10.1093/comjnl/7.4.308 · Cited by 28,905 · cited 1×
“The Nelder–Mead method or simplex method [43], imple-”
MethodReinforcement Learning: An Introduction
Sutton, R. S., & Barto, A. G. (1998) · IEEE Transactions on Neural Networks · doi:10.1109/tnn.1998.712192 · Cited by 27,225 · cited 1×
“An alternative approach to model strategy change could be derived from models of reinforcement learning [34–37].”
MethodReinforcement Learning: An Introduction
Sutton, R. S., & Barto, A. (2005) · IEEE Transactions on Neural Networks · doi:10.1109/tnn.2004.842673 · Cited by 25,268
Humans integrate visual and haptic information in a statistically optimal fashion
Ernst, M. O., & Banks, M. S. (2002) · Nature · doi:10.1038/415429a · Cited by 4,844 · cited 2×
“Several studies have shown that adaptation rates can change when the certainty of sensory information is manipulated [31,32].”
BackgroundAdaptive representation of dynamics during learning of a motor task
Shadmehr, R., & Mussa-Ivaldi, F. (1994) · The Journal of Neuroscience · doi:10.1523/jneurosci.14-05-03208.1994 · Cited by 2,612 · cited 1×
“[5–7] would be hard to verbalize.”
Statistical Analysis of Circular Data.
LANGE, N. D., & Fisher, N. I. (1995) · Journal of the American Statistical Association · doi:10.2307/2291098 · Cited by 2,155
Statistical Analysis of Circular Data
Fisher, N. I. (1993) · Cambridge University Press eBooks · doi:10.1017/cbo9780511564345 · Cited by 1,826 · cited 2×
“To minimize these problems, we used a boostrapping [42] method to estimate peak drift.”
MethodBrogan, W. L. (1971) · International Linear Collider · Cited by 1,206
Interacting adaptive processes with different timescales underlie short-term motor learning
Smith, M. A., Ghazizadeh, A., & Shadmehr, R. (2006) · PLoS Biology · doi:10.1371/journal.pbio.0040179 · Cited by 1,113 · cited 3×
“Thus, the final version of our model is a variant of a two-rate state space model [28], but with the two rates reflecting different error sources.”
BackgroundMethodInfluentialCausal Inference in Multisensory Perception
Körding, K. P., Beierholm, U., Ma, W. J., Quartz, S., Tenenbaum, J. B., & Shams, L. (2007) · PLoS ONE · doi:10.1371/journal.pone.0000943 · Cited by 1,069 · cited 1×
“This may impede drift because participants observe the casual relationship between movement of their hand and the endpoint, cursor feedback [33].”
Background
Cited by
Sorted by citations
Explicit and implicit contributions to learning in a sensorimotor adaptation task
Taylor, J. A., Krakauer, J. W., & Ivry, R. B. (2014) · The Journal of Neuroscience · doi:10.1523/jneurosci.3619-13.2014 · Cited by 768
“Indeed, the saliency of the sensory-prediction error is critical with respect to implicit learning, such that when the landmark is absent participants are still able to employ the strategy to reduce target error but at the cost of reduced implicit learning (Benson et al., 2011; Taylor and Ivry, 2011).”
BackgroundMethodInfluentialSelf-citationKrakauer, J. W., Hadjiosif, A. M., Xu, J., Wong, A. L., & Haith, A. M. (2019) · Comprehensive physiology · doi:10.1002/cphy.c170043 · Cited by 918
Human sensorimotor learning: adaptation, skill, and beyond
Krakauer, J. W., & Mazzoni, P. (2011) · Current Opinion in Neurobiology · doi:10.1016/j.conb.2011.06.012 · Cited by 558
Flexible explicit but rigid implicit learning in a visuomotor adaptation task
Bond, K. M., & Taylor, J. A. (2015) · Journal of Neurophysiology · doi:10.1152/jn.00009.2015 · Cited by 269
“This complex, nonmonotonic behavior can be explained by a dynamic interplay between explicit learning, related to fluctuations in aiming strategies, and implicit learning, related to the training of a forward model (Mazzoni and Krakauer 2006; Taylor and Ivry 2011).”
BackgroundMethodInfluentialSelf-citationCharacteristics of Implicit Sensorimotor Adaptation Revealed by Task-irrelevant Clamped Feedback
Morehead, J. R., Taylor, J. A., Parvin, D. E., & Ivry, R. B. (2017) · Journal of Cognitive Neuroscience · doi:10.1162/jocn_a_01108 · Cited by 284
“This results in interesting interactions between explicit aiming and implicit adaptation, but the dual operation of both processes makes it difficult to characterize their individual features (Taylor, Krakauer, & Ivry, 2014; Taylor & Ivry, 2011).”
BackgroundMethodSelf-citation
Metadata
- Authors
- Taylor, J. A., & Ivry, R. B.
- Affiliations
- University of California, Berkeley (US)
- Corresponding author
- Taylor, Jordan A.
- Ivry, Richard B.
- Venue
- PLoS Computational Biology
- Publisher
- Public Library of Science (PLoS)
- Published
- 2011-03-03
- Volume
- 7
- Issue
- 3
- Pages
- e1001096
- ISSN
- 1553-734X (ISSN-L)
- 1553-7358
- PMC
- PMC3048379
- OpenAlex
- W1989328619
- Cited by
- 352
- References
- 47
- Citations by year
- 2026: 25 · 2025: 28 · 2024: 44 · 2023: 28 · 2022: 26 · 2021: 36 · 2020: 37 · 2019: 25 · 2018: 21 · 2017: 10 · 2016: 10 · 2015: 13 · 2014: 14 · 2013: 14 · 2012: 11
- FWCI
- 7.95
- Type
- journal article
- Language
- en
- Open access
- gold
- doi.org
- Locations
- PLoS Computational Biology (publishedVersion, cc-by)
- Europe PMC (PubMed Central) (publishedVersion, cc-by)
- PubMed Central (publishedVersion, cc-by)
- PubMed (publishedVersion)
- RePEc: Research Papers in Economics (submittedVersion)
- DOAJ (DOAJ: Directory of Open Access Journals) (submittedVersion, cc-by-sa)
- Funders
- National Science Foundation
- National Institute of Neurological Disorders and Stroke (P01NS040813, F32NS064749)
- Eunice Kennedy Shriver National Institute of Child Health and Human Development (R01HD060306)
- Topics
- Life Sciences › Neuroscience › Cognitive Neuroscience › Motor Control and Adaptation
- Life Sciences › Neuroscience › Cognitive Neuroscience › Tactile and Sensory Interactions
- Life Sciences › Neuroscience › Cognitive Neuroscience › Visual perception and processing mechanisms
- Keywords
- visuomotor adaptation, visuomotor rotation, motor learning, compensatory strategies, internal models, state-space model, sensorimotor adaptation, visual landmarks, reaching movements
- MeSH terms
- Algorithms, Cognition, Female, Humans, Learning, Models, Neurological, Motor Skills, Psychomotor Performance, Task Performance and Analysis, Computational Biology, Feedback, Physiological
About these checks
Registry, retraction, Cites and statistics results are computed, not judged, with one exception: a printed reference that no index lists is read once by a model before it counts as a citation error. Claims are extracted by a model and kept only when their quote appears verbatim in the text; each cited source is then checked, with a model’s help, for whether it says what the claim relies on. Those verdicts can be wrong — read the claim’s quote and the cited source before relying on one.
Statistics and arithmetic are recomputed, not judged.
Confidence bands are shown only for fields calibrated on our annotated test set. None is calibrated yet, so no band is shown.
What counts as a claim ›How we measure confidence ›How we check this ›
Are you an author, or do you see a problem with this page? Request a review
