

The DOI matches its Crossref record; 29 of the 29 references it cites were found in a registry or an index.
Assessing Vaccination Sentiments with Online Social Media: Implications for Infectious Disease Dynamics and Control
Open accessAbstract
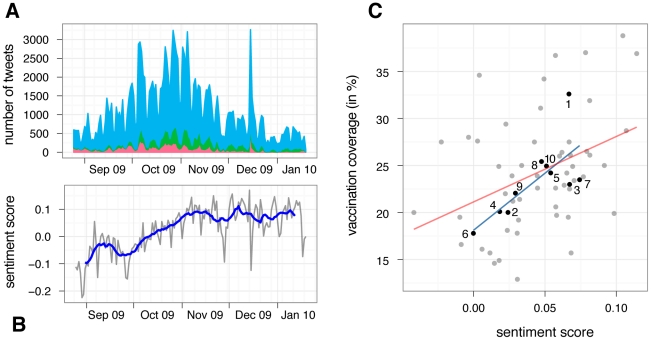
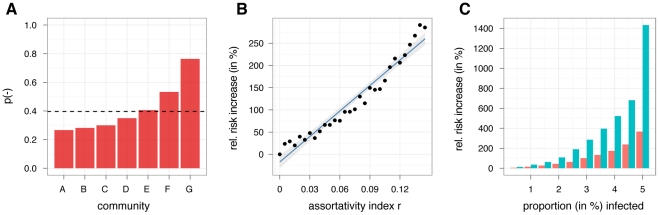
There is great interest in the dynamics of health behaviors in social networks and how they affect collective public health outcomes, but measuring population health behaviors over time and space requires substantial resources. Here, we use publicly available data from 101,853 users of online social media collected over a time period of almost six months to measure the spatio-temporal sentiment towards a new vaccine. We validated our approach by identifying a strong correlation between sentiments expressed online and CDC-estimated vaccination rates by region. Analysis of the network of opinionated users showed that information flows more often between users who share the same sentiments - and less often between users who do not share the same sentiments - than expected by chance alone. We also found that most communities are dominated by either positive or negative sentiments towards the novel vaccine. Simulations of infectious disease transmission show that if clusters of negative vaccine sentiments lead to clusters of unprotected individuals, the likelihood of disease outbreaks is greatly increased. Online social media provide unprecedented access to data allowing for inexpensive and efficient tools to identify target areas for intervention efforts and to evaluate their effectiveness.
Overview
The claims and statistics of this paper haven’t been checked yet.
Run the check — free, no account needed. It reads the open-access text and checks the sources it cites.
Integrity signals
Registry
Cites
Statistics
Figures
Verification
Claims the paper makes
The claims and statistics of this paper haven’t been checked yet.
Run the check — free, no account needed. It reads the open-access text and checks the sources it cites.
Claims other papers make about this one
Each is checked against this paper’s own text: does it say what the citing paper says it does?
In the citing paper
“Previous work around similar disorders suggests that social media use may contribute to an ‘echo-chamber’ effect, where users perceive their values and world-views to be more common than they actually are, due to selectively viewing contributions of other, similarly minded people [5].”
From Instagram use is linked to increased symptoms of orthorexia nervosa. (2017) · cites this paper as [5]
Self-check
Percentages, sums and reported differences re-computed from the paper’s own numbers.
The self-check needs the paper’s full text.
Citations
Cites
Infectious Diseases of Humans: Dynamics and Control
(1992) · Annals of Internal Medicine · doi:10.7326/0003-4819-117-2-174_4 · Cited by 7,819
Actual causes of death in the United States
McGinnis, J. M. (1993) · JAMA: The Journal of the American Medical Association · doi:10.1001/jama.1993.03510180077038 · Cited by 5,480
Actual Causes of Death in the United States, 2000
Mokdad, A. H. (2004) · JAMA · doi:10.1001/jama.291.10.1238 · Cited by 5,211
The Spread of Obesity in a Large Social Network over 32 Years
Christakis, N. A., & Fowler, J. H. (2007) · New England Journal of Medicine · doi:10.1056/nejmsa066082 · Cited by 5,007
Detecting influenza epidemics using search engine query data
Ginsberg, J., Mohebbi, M. H., Patel, R. S., Brammer, L., Smolinski, M. S., & Brilliant, L. (2009) · Nature · doi:10.1038/nature07634 · Cited by 4,295
Natural language processing with Python
Bird, S., Klein, E., & Loper, E. (2009) · CERN Document Server (European Organization for Nuclear Research) · Cited by 3,472
Lazer, D., Pentland, A., Adamic, L., Aral, S., Barabási, A.-L., Brewer, D., Christakis, N., Contractor, N., Fowler, J., Gutmann, M., et al. (2009) · Science · doi:10.1126/science.1167742 · Cited by 3,365
Newman, M. (2002) · Physical review. E, Statistical, nonlinear, and soft matter physics · doi:10.1103/physreve.67.026126 · Cited by 3,130
The spread of behavior in an online social network experiment
Centola, D. (2010) · Science · doi:10.1126/science.1185231 · Cited by 2,692
The collective dynamics of smoking in a large social network
Christakis, N. A., & Fowler, J. H. (2008) · New England Journal of Medicine · doi:10.1056/nejmsa0706154 · Cited by 2,390
Cited by
Sorted by citations
Moorhead, S. A., Hazlett, D. E., Harrison, L., Carroll, J. K., Irwin, A., & Hoving, C. (2013) · Journal of Medical Internet Research · doi:10.2196/jmir.1933 · Cited by 2,517
Systematic Literature Review on the Spread of Health-related Misinformation on Social Media
Wang, Y., McKee, M., Torbica, A., & Stuckler, D. (2019) · Social Science & Medicine · doi:10.1016/j.socscimed.2019.112552 · Cited by 1,806
“, 2015), and consequent behavioural changes (Salathé and Khandelwal, 2011; Wakamiya et al., 2016).”
Increasing Vaccination: Putting Psychological Science Into Action
Brewer, N. T., Chapman, G. B., Rothman, A. J., Leask, J., & Kempe, A. (2017) · Psychological Science in the Public Interest · doi:10.1177/1529100618760521 · Cited by 1,233
Puri, N., Coomes, E. A., Haghbayan, H., & Gunaratne, K. (2020) · Human Vaccines & Immunotherapeutics · doi:10.1080/21645515.2020.1780846 · Cited by 1,229
Statistical physics of vaccination
Wang, Z., Bauch, C. T., Bhattacharyya, S., d’Onofrio, A., Manfredi, P., Perc, M., Perra, N., Salathé, M., & Zhao, D. (2016) · Physics Reports · doi:10.1016/j.physrep.2016.10.006 · Cited by 973
Self-citation
Metadata
- Authors
- Salathé, M., & Khandelwal, S.
- Affiliations
- Pennsylvania State University (US)
- Corresponding author
- Salathé, Marcel
- ORCID
- Salathé, Marcel
- Venue
- PLoS Computational Biology
- Publisher
- Public Library of Science (PLoS)
- Published
- 2011-10-13
- Volume
- 7
- Issue
- 10
- Pages
- e1002199
- ISSN
- 1553-734X (ISSN-L)
- 1553-7358
- PMC
- PMC3192813
- OpenAlex
- W2025330985
- Cited by
- 530
- References
- 29
- Citations by year
- 2026: 5 · 2025: 19 · 2024: 27 · 2023: 30 · 2022: 41 · 2021: 52 · 2020: 53 · 2019: 43 · 2018: 34 · 2017: 44 · 2016: 56 · 2015: 50 · 2014: 35 · 2013: 30 · 2012: 11
- FWCI
- 24.97
- Type
- journal article
- Language
- en
- Open access
- gold
- doi.org
- Locations
- PLoS Computational Biology (publishedVersion, cc-by)
- Europe PMC (PubMed Central) (publishedVersion, cc-by)
- PubMed Central (publishedVersion, cc-by)
- PubMed (publishedVersion)
- arXiv (Cornell University) (submittedVersion)
- DOAJ (DOAJ: Directory of Open Access Journals) (submittedVersion, cc-by-sa)
- Infoscience (Ecole Polytechnique Fédérale de Lausanne) (submittedVersion)
- Infoscience (Ecole Polytechnique Fédérale de Lausanne) (submittedVersion, cc-by-nc-nd)
- arXiv (Cornell University)
- Topics
- Social Sciences › Health › Vaccine Coverage and Hesitancy
- Social Sciences › Sociology and Political Science › Misinformation and Its Impacts
- Physical Sciences › Computer Science › Artificial Intelligence › Sentiment Analysis and Opinion Mining
- Keywords
- vaccine attitudes, social media, vaccination coverage, infectious disease transmission, outbreak, information flow
- MeSH terms
- Attitude to Health, Centers for Disease Control and Prevention, U.S., Disease Outbreaks, Humans, Immunization, United States, Social Media
About these checks
Registry, retraction, Cites and statistics results are computed, not judged, with one exception: a printed reference that no index lists is read once by a model before it counts as a citation error. Claims are extracted by a model and kept only when their quote appears verbatim in the text; each cited source is then checked, with a model’s help, for whether it says what the claim relies on. Those verdicts can be wrong — read the claim’s quote and the cited source before relying on one.
Statistics and arithmetic are recomputed, not judged.
Confidence bands are shown only for fields calibrated on our annotated test set. None is calibrated yet, so no band is shown.
What counts as a claim ›How we measure confidence ›How we check this ›
Are you an author, or do you see a problem with this page? Request a review
