

The DOI matches its Crossref record; 34 of the 34 references it cites were found in a registry or an index.
Reliable B Cell Epitope Predictions: Impacts of Method Development and Improved Benchmarking
Open accessAbstract
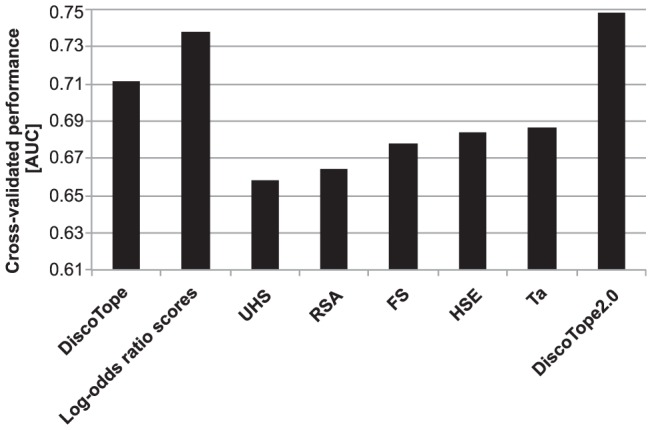
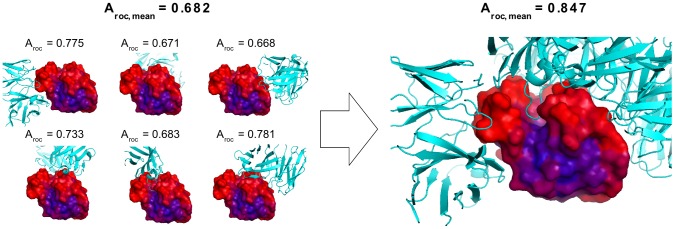
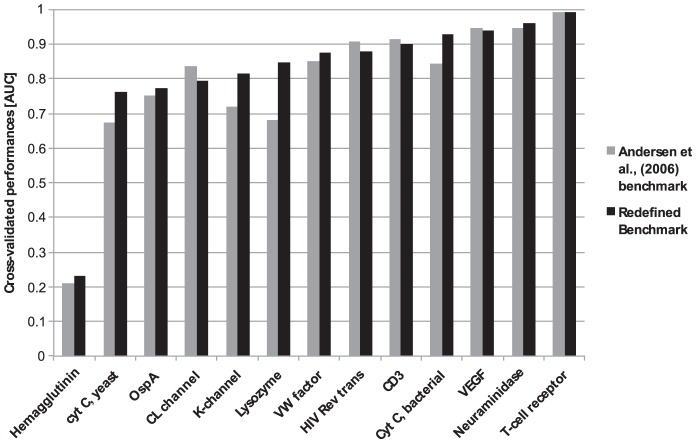
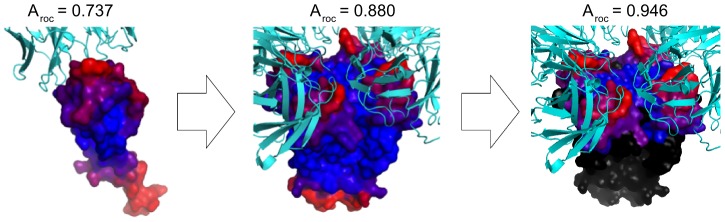
The interaction between antibodies and antigens is one of the most important immune system mechanisms for clearing infectious organisms from the host. Antibodies bind to antigens at sites referred to as B-cell epitopes. Identification of the exact location of B-cell epitopes is essential in several biomedical applications such as; rational vaccine design, development of disease diagnostics and immunotherapeutics. However, experimental mapping of epitopes is resource intensive making in silico methods an appealing complementary approach. To date, the reported performance of methods for in silico mapping of B-cell epitopes has been moderate. Several issues regarding the evaluation data sets may however have led to the performance values being underestimated: Rarely, all potential epitopes have been mapped on an antigen, and antibodies are generally raised against the antigen in a given biological context not against the antigen monomer. Improper dealing with these aspects leads to many artificial false positive predictions and hence to incorrect low performance values. To demonstrate the impact of proper benchmark definitions, we here present an updated version of the DiscoTope method incorporating a novel spatial neighborhood definition and half-sphere exposure as surface measure. Compared to other state-of-the-art prediction methods, Discotope-2.0 displayed improved performance both in cross-validation and in independent evaluations. Using DiscoTope-2.0, we assessed the impact on performance when using proper benchmark definitions. For 13 proteins in the training data set where sufficient biological information was available to make a proper benchmark redefinition, the average AUC performance was improved from 0.791 to 0.824. Similarly, the average AUC performance on an independent evaluation data set improved from 0.712 to 0.727. Our results thus demonstrate that given proper benchmark definitions, B-cell epitope prediction methods achieve highly significant predictive performances suggesting these tools to be a powerful asset in rational epitope discovery. The updated version of DiscoTope is available at www.cbs.dtu.dk/services/DiscoTope-2.0.
Overview
The claims and statistics of this paper haven’t been checked yet.
Run the check — free, no account needed. It reads the open-access text and checks the sources it cites.
Integrity signals
Registry
Cites
Statistics
Figures
Verification
Claims the paper makes
The claims and statistics of this paper haven’t been checked yet.
Run the check — free, no account needed. It reads the open-access text and checks the sources it cites.
Claims other papers make about this one
Each is checked against this paper’s own text: does it say what the citing paper says it does?
In the citing paper
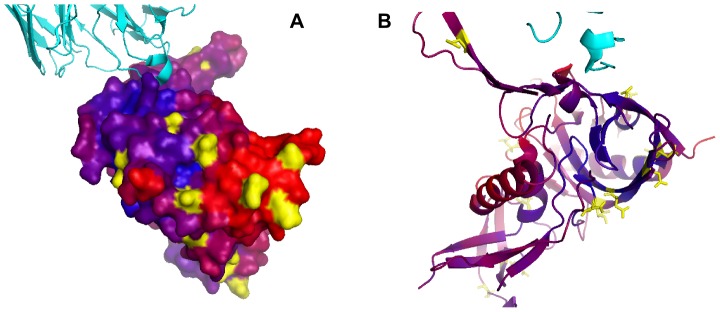
“Accurate delineation of an epitope is an important step in characterizing the function of an antibody [161] (Figure 2B).”
From Computational approaches to therapeutic antibody design: established methods and emerging trends (2020) · cites this paper as [161]
Self-check
Percentages, sums and reported differences re-computed from the paper’s own numbers.
The self-check needs the paper’s full text.
Citations
Cites
Kabsch, W., & Sander, C. (1983) · Biopolymers · doi:10.1002/bip.360221211 · Cited by 15,320
Measuring the Accuracy of Diagnostic Systems
Swets, J. A. (1988) · Science · doi:10.1126/science.3287615 · Cited by 10,058
Prediction of protein antigenic determinants from amino acid sequences.
Hopp, T. P., & Woods, K. R. (1981) · Proceedings of the National Academy of Sciences · doi:10.1073/pnas.78.6.3824 · Cited by 3,726
ElliPro: a new structure-based tool for the prediction of antibody epitopes
Ponomarenko, J. V., Bui, H., Li, W., Fusseder, N., Bourne, P. E., Sette, A., & Peters, B. (2008) · BMC Bioinformatics · doi:10.1186/1471-2105-9-514 · Cited by 1,738
Parker, J. M. R., Guo, D., & Hodges, R. S. (1986) · Biochemistry · doi:10.1021/bi00367a013 · Cited by 1,188
Large-scale validation of methods for cytotoxic T-lymphocyte epitope prediction
Larsen, M. V., Lundegaard, C., Lamberth, K., Buus, S., Lund, O., & Nielsen, M. (2007) · BMC Bioinformatics · doi:10.1186/1471-2105-8-424 · Cited by 973
Self-citationThe antigenic index: a novel algorithm for predicting antigenic determinants
Jameson, B. A., & Wolf, H. (1988) · Computer applications in the biosciences · doi:10.1093/bioinformatics/4.1.181 · Cited by 649
Prediction of residues in discontinuous B‐cell epitopes using protein 3D structures
Andersen, P. H., Nielsen, M., & Lund, O. (2006) · Protein Science · doi:10.1110/ps.062405906 · Cited by 631
Self-citationPrediction of linear B-cell epitopes using amino acid pair antigenicity scale
Chen, J., Liu, H., Yang, J., & Chou, K.-C. (2007) · Amino Acids · doi:10.1007/s00726-006-0485-9 · Cited by 552
Pancera, M., Majeed, S., Ban, Y. A., Chen, L., Huang, C.-C., Kong, L., Kwon, Y. D., Stuckey, J., Zhou, T., Robinson, J. E., et al. (2009) · Proceedings of the National Academy of Sciences · doi:10.1073/pnas.0911004107 · Cited by 339
Structure of influenza hemagglutinin in complex with an inhibitor of membrane fusion
Russell, R. J. M., Kerry, P. S., Stevens, D. J., Steinhauer, D. A., Martin, S. R., Gamblin, S. J., & Skehel, J. J. (2008) · Proceedings of the National Academy of Sciences · doi:10.1073/pnas.0807142105 · Cited by 314
Structural analysis of B-cell epitopes in antibody: protein complexes
Kringelum, J. V., Nielsen, M., Padkjær, S. B., & Lund, O. (2013) · Molecular Immunology · doi:10.1016/j.molimm.2012.06.001 · Cited by 305
Self-citationLocation of ‘continuous’ antigenic determinants in the protruding regions of proteins.
Thornton, J. M., Edwards, M. S., Taylor, W. R., & Barlow, D. J. (1986) · The EMBO Journal · doi:10.1002/j.1460-2075.1986.tb04226.x · Cited by 281
Improved prediction of MHC class I and class II epitopes using a novel Gibbs sampling approach
Nielsen, M., Lundegaard, C., Worning, P., Sylvester‐Hvid, C., Lamberth, K., Buus, S., Brunak, S., & Lund, O. (2004) · Bioinformatics · doi:10.1093/bioinformatics/bth100 · Cited by 279
Self-citationPDB file parser and structure class implemented in Python
Hamelryck, T., & Manderick, B. (2003) · Bioinformatics · doi:10.1093/bioinformatics/btg299 · Cited by 272
Gershoni, J. M., Roitburd‐Berman, A., Siman-Tov, D. D., Freund, N. T., & Weiss, Y. (2007) · BioDrugs · doi:10.2165/00063030-200721030-00002 · Cited by 267
Sweredoski, M. J., & Baldi, P. (2008) · Bioinformatics · doi:10.1093/bioinformatics/btn199 · Cited by 263
Computational characterization of B-cell epitopes
Rubinstein, N. D., Mayrose, I., Dan Halperin, C., Yekutieli, D., Gershoni, J. M., & Pupko, T. (2007) · Molecular Immunology · doi:10.1016/j.molimm.2007.10.016 · Cited by 251
HIV and the chemokine system: 10 years later
Lusso, P. (2006) · The EMBO Journal · doi:10.1038/sj.emboj.7600947 · Cited by 234
Antibody-protein interactions: benchmark datasets and prediction tools evaluation
Ponomarenko, J. V., & Bourne, P. E. (2007) · BMC Structural Biology · doi:10.1186/1472-6807-7-64 · Cited by 226
Epitopia: a web-server for predicting B-cell epitopes
Rubinstein, N. D., Mayrose, I., Martz, E., & Pupko, T. (2009) · BMC Bioinformatics · doi:10.1186/1471-2105-10-287 · Cited by 224
Regenmortel, M. H. V. V. (2009) · Methods in molecular biology · doi:10.1007/978-1-59745-450-6_1 · Cited by 217
Recent advances in B-cell epitope prediction methods
EL‐Manzalawy, Y., & Honavar, V. (2010) · Immunome Research · doi:10.1186/1745-7580-6-s2-s2 · Cited by 203
Irving, M. B., Pan, O. C.-C., & Scott, J. K. (2001) · Current Opinion in Chemical Biology · doi:10.1016/s1367-5931(00)00208-8 · Cited by 181
SEPPA: a computational server for spatial epitope prediction of protein antigens
Sun, J., Wu, D., Xu, T., Wang, X., Xu, X., Tao, L., Li, Y., & Cao, Z. (2009) · Nucleic Acids Research · doi:10.1093/nar/gkp417 · Cited by 172
An amino acid has two sides: A new 2D measure provides a different view of solvent exposure
Hamelryck, T. (2005) · Proteins Structure Function and Bioinformatics · doi:10.1002/prot.20379 · Cited by 166
Liang, S., Zheng, D., Standley, D. M., Yao, B., Zacharias, M., & Zhang, C. (2010) · BMC Bioinformatics · doi:10.1186/1471-2105-11-381 · Cited by 165
A machine-learning approach for predicting B-cell epitopes
Rubinstein, N. D., Mayrose, I., & Pupko, T. (2008) · Molecular Immunology · doi:10.1016/j.molimm.2008.09.009 · Cited by 117
Prediction of antigenic epitopes on protein surfaces by consensus scoring
Liang, S., Zheng, D., Zhang, C., & Zacharias, M. (2009) · BMC Bioinformatics · doi:10.1186/1471-2105-10-302 · Cited by 112
Zhang, W., Xiong, Y., Zhao, M., Zou, H., Ye, X., & Liu, J. (2011) · BMC Bioinformatics · doi:10.1186/1471-2105-12-341 · Cited by 105
SVM-based prediction of linear B-cell epitopes using Bayes Feature Extraction
Wee, L. J., Simarmata, D., Kam, Y., Ng, L. F. P., & Tong, J. C. (2010) · BMC Genomics · doi:10.1186/1471-2164-11-s4-s21 · Cited by 79
Mining for the antibody-antigen interacting associations that predict the B cell epitopes
Zhao, L., & Li, J. (2010) · BMC Structural Biology · doi:10.1186/1472-6807-10-s1-s6 · Cited by 55
Predictions of the secondary structure and antigenicity of human and bovine tropoelastins
Debelle, L., Wei, S. M., Jacob, M., Hornebeck, W., & Alix, A. J. P. (1992) · European Biophysics Journal · doi:10.1007/bf00188344 · Cited by 39
Identification of discontinuous antigenic determinants on proteins based on shape complementarities
Rapberger, R., Lukas, A., & Mayer, B. (2007) · Journal of Molecular Recognition · doi:10.1002/jmr.819 · Cited by 31 · cited 1×
“However, performance of the two methods, and other methods utilizing a vast number of features, still only achieve predictive performance values comparable to much simpler models employing two or three attributes [4][12][18][19][20].”
Method
Cited by
Sorted by citations
BepiPred-2.0: improving sequence-based B-cell epitope prediction using conformational epitopes
Jespersen, M. C., Peters, B., Nielsen, M., & Marcatili, P. (2017) · Nucleic Acids Research · doi:10.1093/nar/gkx346 · Cited by 1,739
Self-citationGenetic Analysis of Human Norovirus Strains in Japan in 2016–2017
Nagasawa, K., Matsushima, Y., Motoya, T., Mizukoshi, F., Ueki, Y., Sakon, N., Murakami, K., Shimizu, T., Okabe, N., Nagata, N., et al. (2018) · Frontiers in Microbiology · doi:10.3389/fmicb.2018.00001 · Cited by 1,258
Grifoni, A., Sidney, J., Zhang, Y., Scheuermann, R. H., Peters, B., & Sette, A. (2020) · Cell Host & Microbe · doi:10.1016/j.chom.2020.03.002 · Cited by 920
The Immune Epitope Database and Analysis Resource in Epitope Discovery and Synthetic Vaccine Design
Fleri, W., Paul, S., Dhanda, S. K., Mahajan, S., Xu, X., Peters, B., & Sette, A. (2017) · Frontiers in Immunology · doi:10.3389/fimmu.2017.00278 · Cited by 501
An overview of bioinformatics tools for epitope prediction: Implications on vaccine development
Soria‐Guerra, R. E., Nieto‐Gómez, R., Govea‐Alonso, D. O., & Rosales‐Mendoza, S. (2014) · Journal of Biomedical Informatics · doi:10.1016/j.jbi.2014.11.003 · Cited by 441
Metadata
- Authors
- Kringelum, J. V., Lundegaard, C., Lund, O., & Nielsen, M.
- Affiliations
- Technical University of Denmark (DK)
- National University of General San Martín (AR)
- Corresponding author
- Nielsen, Morten
- Venue
- PLoS Computational Biology
- Publisher
- Public Library of Science (PLoS)
- Published
- 2012-12-27
- Volume
- 8
- Issue
- 12
- Pages
- e1002829
- ISSN
- 1553-734X (ISSN-L)
- 1553-7358
- PMC
- PMC3531324
- OpenAlex
- W2100316154
- Cited by
- 697
- References
- 34
- Citations by year
- 2026: 34 · 2025: 49 · 2024: 54 · 2023: 65 · 2022: 91 · 2021: 90 · 2020: 91 · 2019: 41 · 2018: 41 · 2017: 41 · 2016: 34 · 2015: 38 · 2014: 21 · 2013: 6 · 2012: 1
- FWCI
- 8.48
- Type
- journal article
- Language
- en
- Open access
- gold
- doi.org
- Locations
- PLoS Computational Biology (publishedVersion, cc-by)
- PubMed Central (publishedVersion, cc-by)
- PubMed (publishedVersion)
- RePEc: Research Papers in Economics (submittedVersion)
- DOAJ (DOAJ: Directory of Open Access Journals) (submittedVersion, cc-by-sa)
- Figshare (submittedVersion, cc-by)
- Technical University of Denmark, DTU Orbit (Technical University of Denmark, DTU) (submittedVersion, other-oa)
- Funders
- European Commission (2007–2013, FP7 2007-2013, FP7/2007, 222773)
- Topics
- Life Sciences › Biochemistry, Genetics and Molecular Biology › Molecular Biology › vaccines and immunoinformatics approaches
- Life Sciences › Biochemistry, Genetics and Molecular Biology › Molecular Biology › Machine Learning in Bioinformatics
- Life Sciences › Biochemistry, Genetics and Molecular Biology › Molecular Biology › Protein Structure and Dynamics
- Keywords
- B-cell epitope prediction, benchmarking, antigen-antibody reaction, surface accessibility, rational vaccine design
- MeSH terms
- Epitopes, B-Lymphocytes, Humans, Models, Molecular, Odds Ratio, Benchmarking
About these checks
Registry, retraction, Cites and statistics results are computed, not judged, with one exception: a printed reference that no index lists is read once by a model before it counts as a citation error. Claims are extracted by a model and kept only when their quote appears verbatim in the text; each cited source is then checked, with a model’s help, for whether it says what the claim relies on. Those verdicts can be wrong — read the claim’s quote and the cited source before relying on one.
Statistics and arithmetic are recomputed, not judged.
Confidence bands are shown only for fields calibrated on our annotated test set. None is calibrated yet, so no band is shown.
What counts as a claim ›How we measure confidence ›How we check this ›
Are you an author, or do you see a problem with this page? Request a review
