

The DOI matches its Crossref record; 54 of the 54 references it cites were found in a registry or an index.
Qualitative Dynamical Modelling Can Formally Explain Mesoderm Specification and Predict Novel Developmental Phenotypes
Abstract
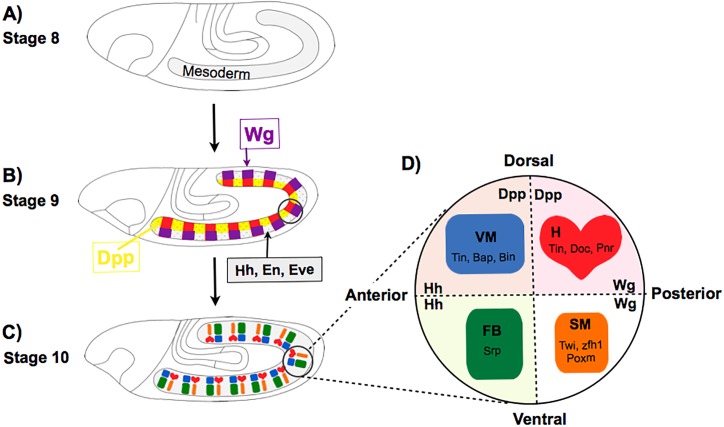
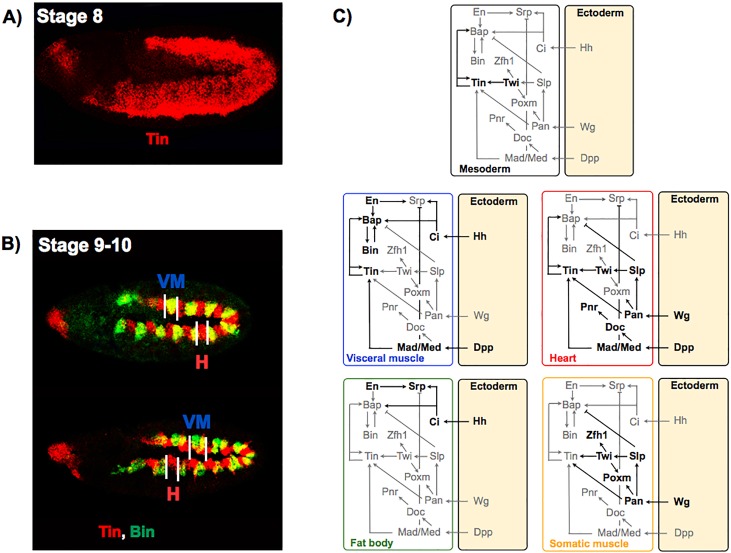
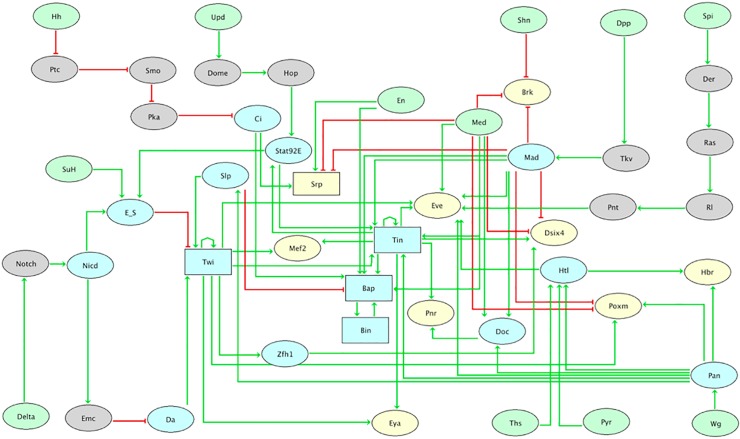
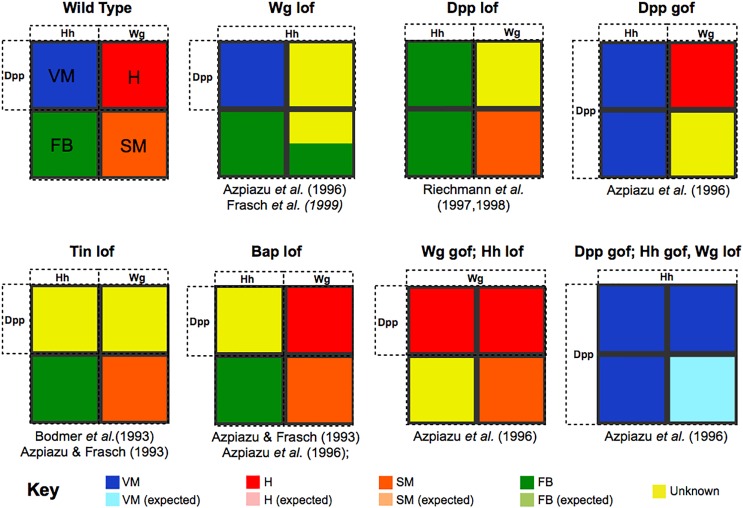
Given the complexity of developmental networks, it is often difficult to predict the effect of genetic perturbations, even within coding genes. Regulatory factors generally have pleiotropic effects, exhibit partially redundant roles, and regulate highly interconnected pathways with ample cross-talk. Here, we delineate a logical model encompassing 48 components and 82 regulatory interactions involved in mesoderm specification during Drosophila development, thereby providing a formal integration of all available genetic information from the literature. The four main tissues derived from mesoderm correspond to alternative stable states. We demonstrate that the model can predict known mutant phenotypes and use it to systematically predict the effects of over 300 new, often non-intuitive, loss- and gain-of-function mutations, and combinations thereof. We further validated several novel predictions experimentally, thereby demonstrating the robustness of model. Logical modelling can thus contribute to formally explain and predict regulatory outcomes underlying cell fate decisions.
Overview
The claims and statistics of this paper haven’t been checked yet.
Run the check — free, no account needed. It reads the open-access text and checks the sources it cites.
Integrity signals
Registry
Cites
Statistics
Figures
Verification
Claims the paper makes
The claims and statistics of this paper haven’t been checked yet.
Run the check — free, no account needed. It reads the open-access text and checks the sources it cites.
Claims other papers make about this one
Each is checked against this paper’s own text: does it say what the citing paper says it does?
In the citing paper
“As a point of contrast, more dramatic expression changes are seen in early development (16, 17, 30), where transcriptomes first establish cell lineages that will give rise to a vast diversity of tissues of the body.”
From Behavior-related gene regulatory networks: A new level of organization in the brain (2020) · cites this paper as [30]
Self-check
Percentages, sums and reported differences re-computed from the paper’s own numbers.
The self-check needs the paper’s full text.
Citations
Cites
The segment polarity network is a robust developmental module
von Dassow, G., Meir, E., Munro, E. M., & Odell, G. M. (2000) · Nature · doi:10.1038/35018085 · Cited by 1,144
Albert, R., & Othmer, H. G. (2003) · Journal of Theoretical Biology · doi:10.1016/s0022-5193(03)00035-3 · Cited by 944
The gene tinman is required for specification of the heart and visceral muscles in Drosophila
Bodmer, R. (1993) · Development · doi:10.1242/dev.118.3.719 · Cited by 810
Azpiazu, N., & Frasch, M. (1993) · Genes & Development · doi:10.1101/gad.7.7b.1325 · Cited by 719
Thomas, R., Thieffry, D., & Kaufman, M. (1995) · Bulletin of Mathematical Biology · doi:10.1007/bf02460618 · Cited by 490
Self-citationInduction of visceral and cardiac mesoderm by ectodermal Dpp in the early Drosophila embryo
Frasch, M. (1995) · Nature · doi:10.1038/374464a0 · Cited by 414
Combinatorial binding predicts spatio-temporal cis-regulatory activity
Zinzen, R. P., Girardot, C., Gagneur, J., Braun, M., & Furlong, E. E. M. (2009) · Nature · doi:10.1038/nature08531 · Cited by 395
Self-citationtwist : A Myogenic Switch in Drosophila
Baylies, M. K., & Bate, M. (1996) · Science · doi:10.1126/science.272.5267.1481 · Cited by 342
Logic-Based Models for the Analysis of Cell Signaling Networks
Morris, M. K., Saez-Rodriguez, J., Sorger, P. K., & Lauffenburger, D. A. (2010) · Biochemistry · doi:10.1021/bi902202q · Cited by 332
TGF-β Family Signal Transduction in Drosophila Development: From Mad to Smads
Raftery, L. A., & Sutherland, D. J. (1999) · Developmental Biology · doi:10.1006/dbio.1999.9282 · Cited by 321
A Transcription Factor Collective Defines Cardiac Cell Fate and Reflects Lineage History
Junion, G., Spivakov, M., Girardot, C., Braun, M., Gustafson, E. H., Birney, E., & Furlong, E. E. M. (2012) · Cell · doi:10.1016/j.cell.2012.01.030 · Cited by 257
Self-citationXu, X., Yin, Z., Hudson, J. B., Ferguson, E. L., & Frasch, M. (1998) · Genes & Development · doi:10.1101/gad.12.15.2354 · Cited by 248
A gene regulatory network controlling the embryonic specification of endoderm
Peter, I. S., & Davidson, E. H. (2011) · Nature · doi:10.1038/nature10100 · Cited by 231
Lilly, B., Galewsky, S., Firulli, A. B., Schulz, R. A., & Olson, E. N. (1994) · Proceedings of the National Academy of Sciences · doi:10.1073/pnas.91.12.5662 · Cited by 224
dpp induces mesodermal gene expression in Drosophila
Staehling‐Hampton, K., Hoffmann, F. M., Baylies, M. K., Rushtont, E., & Bate, M. (1994) · Nature · doi:10.1038/372783a0 · Cited by 222
Heart Development in Drosophila Requires the Segment Polarity Gene wingless
Wu, X., Golden, K. L., & Bodmer, R. (1995) · Developmental Biology · doi:10.1006/dbio.1995.1174 · Cited by 222
Mathematical Modelling of Cell-Fate Decision in Response to Death Receptor Engagement
Calzone, L., Tournier, L., Fourquet, S., Thieffry, D., Zhivotovsky, B., Barillot, E., & Zinovyev, A. Y. (2010) · PLoS Computational Biology · doi:10.1371/journal.pcbi.1000702 · Cited by 222
Self-citationModels of Biological Pattern Formation: From Elementary Steps to the Organization of Embryonic Axes
Meinhardt, H. (2007) · Current topics in developmental biology/Current Topics in Developmental Biology · doi:10.1016/s0070-2153(07)81001-5 · Cited by 217
Segmentation and specification of the Drosophila mesoderm.Preprint
Azpiazu, N., Lawrence, P. A., Vincent, J. P., & Frasch, M. (1996) · Genes & Development · doi:10.1101/gad.10.24.3183 · Cited by 200
Yin, Z., Xu, X.-L., & Frasch, M. (1997) · Development · doi:10.1242/dev.124.24.4971 · Cited by 184
Predictive computation of genomic logic processing functions in embryonic development
Peter, I. S., Faure, E., & Davidson, E. H. (2012) · Proceedings of the National Academy of Sciences · doi:10.1073/pnas.1207852109 · Cited by 170
Logical Modelling of Gene Regulatory Networks with GINsim
Chaouiya, C., Naldi, A., & Thieffry, D. (2011) · Methods in molecular biology · doi:10.1007/978-1-61779-361-5_23 · Cited by 162
Self-citationControl of cell fates and segmentation in the Drosophila mesoderm
Riechmann, V., Irion, U., Wilson, R., Grosskortenhaus, R., & Leptin, M. (1997) · Development · doi:10.1242/dev.124.15.2915 · Cited by 157
Sáez-Rodríguez, J., Alexopoulos, L. G., Zhang, M., Morris, M. K., Lauffenburger, D. A., & Sorger, P. K. (2011) · Cancer Research · doi:10.1158/0008-5472.can-10-4453 · Cited by 151
Zaffran, S., Küchler, A. M., Lee, H., & Frasch, M. (2001) · Genes & Development · doi:10.1101/gad.917101 · Cited by 148
Dynamically consistent reduction of logical regulatory graphs
Naldi, A., Rémy, É., Thieffry, D., & Chaouiya, C. (2010) · Theoretical Computer Science · doi:10.1016/j.tcs.2010.10.021 · Cited by 135
Self-citationReim, I., Lee, H., & Frasch, M. (2003) · Development · doi:10.1242/dev.00548 · Cited by 122
Staehling‐Hampton, K., & Hoffmann, F. M. (1994) · Developmental Biology · doi:10.1006/dbio.1994.1219 · Cited by 120
Reim, I., & Frasch, M. (2005) · Development · doi:10.1242/dev.02077 · Cited by 104
Lee, H., & Frasch, M. (2000) · Development · doi:10.1242/dev.127.24.5497 · Cited by 99
Jakobsen, J. S., Braun, M. M., Astorga, J., Gustafson, E. H., Sandmann, T., Karzynski, M., Carlsson, P., & Furlong, E. E. M. (2007) · Genes & Development · doi:10.1101/gad.437607 · Cited by 95
Self-citationSánchez, L., Chaouiya, C., & Thieffry, D. (2008) · The International Journal of Developmental Biology · doi:10.1387/ijdb.072439ls · Cited by 94
Self-citationThe serpent gene is necessary for progression through the early stages of fat-body development
Sam, S., Leise, W. F., & Hoshizaki, D. K. (1996) · Mechanisms of Development · doi:10.1016/s0925-4773(96)00615-6 · Cited by 90
Model Checking to Assess T-Helper Cell Plasticity
Abou-Jaoudé, W., Monteiro, P. T., Naldi, A., Grandclaudon, M., Soumelis, V., Chaouiya, C., & Thieffry, D. (2015) · Frontiers in Bioengineering and Biotechnology · doi:10.3389/fbioe.2014.00086 · Cited by 90
Self-citationThe genetic control of the distinction between fat body and gonadal mesoderm in Drosophila
Riechmann, V., Rehorn, K.-P., Reuter, R., et al. (1998) · Development · doi:10.1242/dev.125.4.713 · Cited by 89
Drosophila blastoderm patterning
Jaeger, J., Manu, & Reinitz, J. (2012) · Current Opinion in Genetics & Development · doi:10.1016/j.gde.2012.10.005 · Cited by 81
Logical analysis of the budding yeast cell cycle
Irons, D. J. (2009) · Journal of Theoretical Biology · doi:10.1016/j.jtbi.2008.12.028 · Cited by 72
Logical modelling of cell cycle control in eukaryotes: a comparative study
Fauré, A., & Thieffry, D. (2009) · Molecular BioSystems · doi:10.1039/b907562n · Cited by 68
Self-citationErceg, J., Saunders, T. E., Girardot, C., Devos, D. P., Hufnagel, L., & Furlong, E. E. M. (2014) · PLoS Genetics · doi:10.1371/journal.pgen.1004060 · Cited by 63
Self-citationLee, H., & Frasch, M. (2005) · Development · doi:10.1242/dev.01687 · Cited by 61
Intersecting signalling and transcriptional pathways inDrosophilaheart specification
Frasch, M. (1999) · Seminars in Cell and Developmental Biology · doi:10.1006/scdb.1998.0279 · Cited by 52
Logical modelling of the role of the Hh pathway in the patterning of the Drosophila wing disc
González, A., Chaouiya, C., & Thieffry, D. (2008) · Bioinformatics · doi:10.1093/bioinformatics/btn266 · Cited by 48
Self-citationOrtiz-Gutiérrez, E., García-Cruz, K. V., Azpeitia, E. M., Castillo, A., Sánchez, M. D. L. P., & Alvarez-Buylla, E. R. (2015) · PLoS Computational Biology · doi:10.1371/journal.pcbi.1004486 · Cited by 45
Dynamic CRM occupancy reflects a temporal map of developmental progression
Wilczyński, B., & Furlong, E. E. M. (2010) · Molecular Systems Biology · doi:10.1038/msb.2010.35 · Cited by 44
Self-citationTapanes-Castillo, A., & Baylies, M. K. (2004) · Development · doi:10.1242/dev.01113 · Cited by 44
Hayes, S. A., Miller, J. M., & Hoshizaki, D. K. (2001) · Development · doi:10.1242/dev.128.7.1193 · Cited by 42
Dynamical modeling of syncytial mitotic cycles in Drosophila embryos
Calzone, L., Thieffry, D., Tyson, J. J., & Novák, B. (2007) · Molecular Systems Biology · doi:10.1038/msb4100171 · Cited by 42
Self-citationLogical modelling of Drosophila signalling pathways
Mbodj, A., Junion, G., Brun, C., Furlong, E. E. M., & Thieffry, D. (2013) · Molecular BioSystems · doi:10.1039/c3mb70187e · Cited by 37
Self-citationDynamics and Mechanical Stability of the Developing Dorsoventral Organizer of the Wing Imaginal Disc
Canela‐Xandri, O., Sagués, F., Casademunt, J., & Buceta, J. (2011) · PLoS Computational Biology · doi:10.1371/journal.pcbi.1002153 · Cited by 36
The formation of sense organs in Drosophila: A logical approach
Ghysen, A., & Thomas, R. (2003) · BioEssays · doi:10.1002/bies.10311 · Cited by 34
Gene Regulatory Network Models for Floral Organ Determination
Azpeitia, E. M., Dávila-Velderrain, J., Villarreal, C., & Alvarez-Buylla, E. R. (2013) · Methods in molecular biology · doi:10.1007/978-1-4614-9408-9_26 · Cited by 33
Huard, J., Mueller, S., Gilles, E. D., Klingmüller, U., & Klamt, S. (2012) · The FEBS Journal · doi:10.1111/j.1742-4658.2012.08572.x · Cited by 29
Zaffran, S., Xu, X., LO, P. C. H., Lee, H., & Frasch, M. (2002) · Cold Spring Harbor Symposia on Quantitative Biology · doi:10.1101/sqb.2002.67.1 · Cited by 24
Implicit Methods for Qualitative Modeling of Gene Regulatory Networks
Garg, A. D., Mohanram, K., Micheli, G. D., & Xénarios, I. (2011) · Methods in molecular biology · doi:10.1007/978-1-61779-292-2_22 · Cited by 17
Cited by
Behavior-related gene regulatory networks: A new level of organization in the brain
Sinha, S., Jones, B. M., Traniello, I. M., Bukhari, S. A., Halfon, M. S., Hofmann, H. A., Huang, S., Katz, P. S., Keagy, J., Lynch, V. J., et al. (2020) · Proceedings of the National Academy of Sciences · doi:10.1073/pnas.1921625117 · Cited by 85
Metadata
- Authors
- Mbodj, A., Gustafson, E. H., Ciglar, L., Junion, G., Gonzalez, A., Girardot, C., Perrin, L., Furlong, E. E. M., & Thieffry, D.
- ORCID
- Mbodj, Abibatou
- Venue
- PLOS Computational Biology
- Publisher
- Public Library of Science (PLoS)
- Published
- 2016-09-06
- Volume
- 12
- Issue
- 9
- Pages
- e1005073
- ISSN
- 1553-7358
- PMC
- PMC5012701
- Cited by
- 12
- References
- 54
- Language
- en
- Funders
- DFG (FU 750/1-2)
- EraSysBio (ModHeart)
About these checks
Registry, retraction, Cites and statistics results are computed, not judged, with one exception: a printed reference that no index lists is read once by a model before it counts as a citation error. Claims are extracted by a model and kept only when their quote appears verbatim in the text; each cited source is then checked, with a model’s help, for whether it says what the claim relies on. Those verdicts can be wrong — read the claim’s quote and the cited source before relying on one.
Statistics and arithmetic are recomputed, not judged.
Confidence bands are shown only for fields calibrated on our annotated test set. None is calibrated yet, so no band is shown.
What counts as a claim ›How we measure confidence ›How we check this ›
Are you an author, or do you see a problem with this page? Request a review
Data sources
Bibliographic data: Semantic Scholar, OpenAlex, Crossref.
Contains information from the Semantic Scholar Academic Graph Datasets, made available under the ODC Attribution License (ODC-BY 1.0).
Semantic Scholar’s data is described in: Kinney, R., et al. (2023). The Semantic Scholar Open Data Platform. arXiv:2301.10140.
