Cited by 2,596Gut microbiota and healthOral microbiology and periodontitis researchMicrobial Community Ecology and Physiology

The DOI matches its Crossref record; 72 of the 72 references it cites were found in a registry or an index.

Multivariable association discovery in population-scale meta-omics studies

Open access

Published version of a preprint

Abstract

It is challenging to associate features such as human health outcomes, diet, environmental conditions, or other metadata to microbial community measurements, due in part to their quantitative properties. Microbiome multi-omics are typically noisy, sparse (zero-inflated), high-dimensional, extremely non-normal, and often in the form of count or compositional measurements. Here we introduce an optimized combination of novel and established methodology to assess multivariable association of microbial community features with complex metadata in population-scale observational studies. Our approach, MaAsLin 2 (Microbiome Multivariable Associations with Linear Models), uses generalized linear and mixed models to accommodate a wide variety of modern epidemiological studies, including cross-sectional and longitudinal designs, as well as a variety of data types (e.g., counts and relative abundances) with or without covariates and repeated measurements. To construct this method, we conducted a large-scale evaluation of a broad range of scenarios under which straightforward identification of meta-omics associations can be challenging. These simulation studies reveal that MaAsLin 2's linear model preserves statistical power in the presence of repeated measures and multiple covariates, while accounting for the nuances of meta-omics features and controlling false discovery. We also applied MaAsLin 2 to a microbial multi-omics dataset from the Integrative Human Microbiome (HMP2) project which, in addition to reproducing established results, revealed a unique, integrated landscape of inflammatory bowel diseases (IBD) across multiple time points and omics profiles.

Overview

The claims and statistics of this paper haven’t been checked yet.

Run the check — free, no account needed. It reads the open-access text and checks the sources it cites.

A few free checks a day · papers already verified open instantly · results are public

Integrity signals

Registry

Crossref · 10.1371/journal.pcbi.1009442

Cites

72 of 72 references verified0 citation errors · 0 not checkable

Statistics

Figures

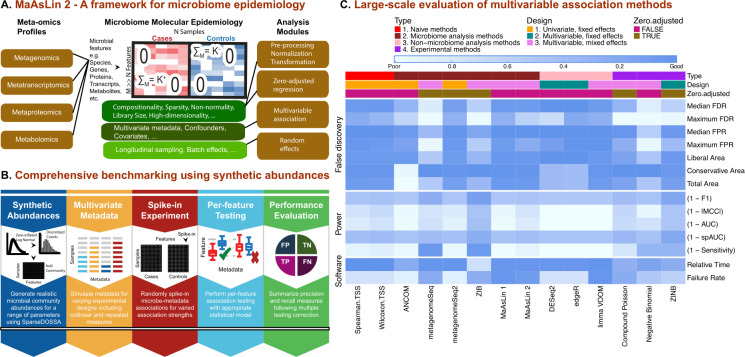
Fig 1 MaAsLin 2 for feature-wise association of microbial communities with phenotypes. A) MaAsLin 2 is a statistical method for association analysis of microbial community meta-omics profiles. It comprises several steps, including data transformation, multivariable inference, multiple hypothesis test correction, and visualization. These are based on a set of flexible and computationally efficient linear models, while accounting for the nuances of microbiome data, repeated measures, and multiple covariates. B) Comprehensive benchmarking of multivariable methods for microbiome epidemiology. To identify appropriate methods for associating microbiome features with health outcomes and other covariates, we assessed up to 84 combinations of normalization/transformation, zero-inflation, and regression models (S1A Fig). These were applied to synthetic data using a hierarchical model (SparseDOSSA, http://huttenhower.sph.harvard.edu/sparsedossa) to generate realistic, model-agnostic datasets with varying scopes and effect sizes of microbiome associations. Individual per-feature association methods were performed repeatedly to evaluate method-specific recall and precision measures. C) Association method performance summary across major evaluation criteria. Three aspects of performance were considered: (i) false discovery, (ii) sensitivity, and (iii) computational efficiency. Evaluation metrics (S1B Fig) are shown (in rows) for the resulting microbial multivariable association methods (both state-of-the-art and novel), averaged over all simulation parameters (S1A Fig). The top-performing methods (as measured by average F1 score) from each class of models (S1C Fig) are shown (in columns). Except for Spearman and Wilcoxon that maintained best performance on TSS-normalized data, all methods exhibited superior performance with no/default normalization (ANCOM, metagenomeSeq, metagenomeSeq2, DESeq2, edgeR, MaAsLin 1, MaAsLin 2, limma VOOM, ZIB) or library size normalization in which log-transformed library size is included as an offset in the associated GLM likelihood (Compound Poisson, Negative Binomial, ZINB). Top colored boxes represent method characteristics including the capability to handle zero-inflation and random effects. Based on synthetic evaluations, MaAsLin 2 includes optimized default models for epidemiological testing in microbial multi-omics data.
Fig 1 MaAsLin 2 for feature-wise association of microbial communities with phenotypes. A) MaAsLin 2 is a statistical method for association analysis of microbial community meta-omics profiles. It comprises several steps, including data transformation, multivariable inference, multiple hypothesis test correction, and visualization. These are based on a set of flexible and computationally efficient linear models, while accounting for the nuances of microbiome data, repeated measures, and multiple covariates. B) Comprehensive benchmarking of multivariable methods for microbiome epidemiology. To identify appropriate methods for associating microbiome features with health outcomes and other covariates, we assessed up to 84 combinations of normalization/transformation, zero-inflation, and regression models (S1A Fig). These were applied to synthetic data using a hierarchical model (SparseDOSSA, http://huttenhower.sph.harvard.edu/sparsedossa) to generate realistic, model-agnostic datasets with varying scopes and effect sizes of microbiome associations. Individual per-feature association methods were performed repeatedly to evaluate method-specific recall and precision measures. C) Association method performance summary across major evaluation criteria. Three aspects of performance were considered: (i) false discovery, (ii) sensitivity, and (iii) computational efficiency. Evaluation metrics (S1B Fig) are shown (in rows) for the resulting microbial multivariable association methods (both state-of-the-art and novel), averaged over all simulation parameters (S1A Fig). The top-performing methods (as measured by average F1 score) from each class of models (S1C Fig) are shown (in columns). Except for Spearman and Wilcoxon that maintained best performance on TSS-normalized data, all methods exhibited superior performance with no/default normalization (ANCOM, metagenomeSeq, metagenomeSeq2, DESeq2, edgeR, MaAsLin 1, MaAsLin 2, limma VOOM, ZIB) or library size normalization in which log-transformed library size is included as an offset in the associated GLM likelihood (Compound Poisson, Negative Binomial, ZINB). Top colored boxes represent method characteristics including the capability to handle zero-inflation and random effects. Based on synthetic evaluations, MaAsLin 2 includes optimized default models for epidemiological testing in microbial multi-omics data.CC0 · PubMed Central
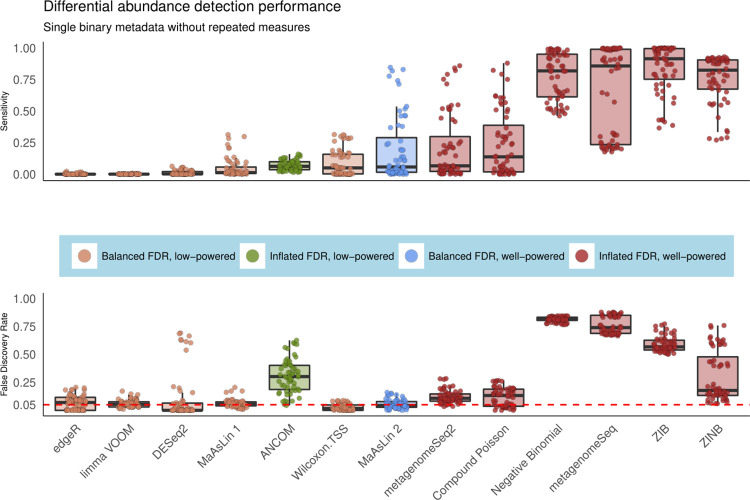
Fig 2 MaAsLin 2 controls false discovery rate while maintaining power in differential abundance analysis of microbial communities. To assess models’ behaviors during differential abundance analysis, we simulated 100 independent datasets per parameter combination, each containing a single binary metadatum and a fixed number of true positive features (10% of features differentially abundant) for varying association strengths and sample sizes (S1A Fig). We then evaluated the ability of different microbiome association methods to recover these associations using a variety of performance metrics and summarized the results across runs. Both sensitivity and false discovery rates (FDR) are shown for the best-performing method from each class of models (as measured by average F1 score). Compared to zero-inflated and count-based approaches, MaAsLin 2’s linear model formulation consistently controlled false discovery rate at the intended nominal level while maintaining moderate sensitivity (full results in S1–S8 Data). Red line parallel to the x-axis is the target threshold for FDR in multiple testing. Methods are sorted by increasing order of average F1 score across all simulation parameters in this setting.
Fig 2 MaAsLin 2 controls false discovery rate while maintaining power in differential abundance analysis of microbial communities. To assess models’ behaviors during differential abundance analysis, we simulated 100 independent datasets per parameter combination, each containing a single binary metadatum and a fixed number of true positive features (10% of features differentially abundant) for varying association strengths and sample sizes (S1A Fig). We then evaluated the ability of different microbiome association methods to recover these associations using a variety of performance metrics and summarized the results across runs. Both sensitivity and false discovery rates (FDR) are shown for the best-performing method from each class of models (as measured by average F1 score). Compared to zero-inflated and count-based approaches, MaAsLin 2’s linear model formulation consistently controlled false discovery rate at the intended nominal level while maintaining moderate sensitivity (full results in S1–S8 Data). Red line parallel to the x-axis is the target threshold for FDR in multiple testing. Methods are sorted by increasing order of average F1 score across all simulation parameters in this setting.CC0 · PubMed Central
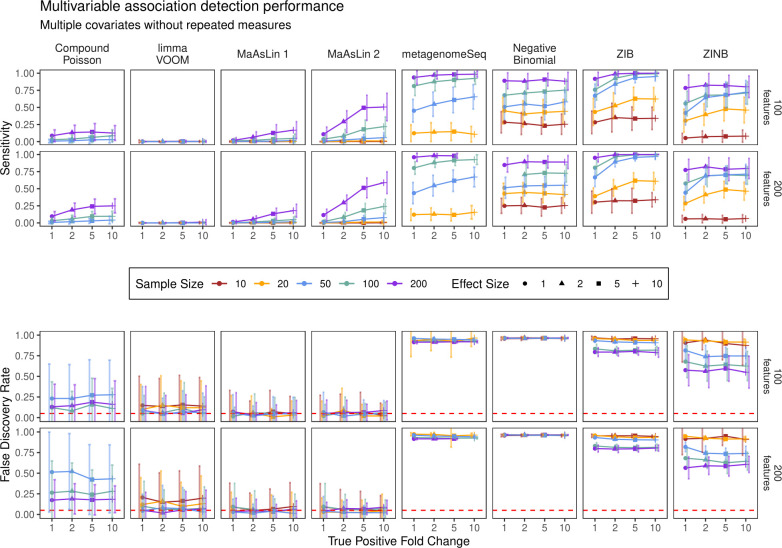
Fig 3 MaAsLin 2 facilitates multivariable association discovery in large-scale human epidemiological and other microbial community studies. Synthetic datasets containing five “metadata” with varying types of induced feature associations were analyzed using a variety of multivariable approaches (S1C Fig). As measured by power (recall) and false discovery rate (FDR), MaAsLin 2’s default linear model outperformed other methods in controlling FDR while maintaining power across true-positive fold-change values, regardless of the total number of features. As expected, MaAsLin 2 has better power for stronger effect sizes, eventually attaining the highest power among all FDR-controlling methods (full results in S1–S8 Data). Red line parallel to the x-axis is the nominal FDR. Values are averages over 100 iterations for each parameter combination. The x-axis (effect size) within each panel represents the linear effect size parameter; a higher effect size represents a stronger association. For visualization purposes, the best-performing methods from each class of models (as measured by average F1 score) are shown. Methods are sorted by increasing order of average F1 score across all simulation parameters in this setting.
Fig 3 MaAsLin 2 facilitates multivariable association discovery in large-scale human epidemiological and other microbial community studies. Synthetic datasets containing five “metadata” with varying types of induced feature associations were analyzed using a variety of multivariable approaches (S1C Fig). As measured by power (recall) and false discovery rate (FDR), MaAsLin 2’s default linear model outperformed other methods in controlling FDR while maintaining power across true-positive fold-change values, regardless of the total number of features. As expected, MaAsLin 2 has better power for stronger effect sizes, eventually attaining the highest power among all FDR-controlling methods (full results in S1–S8 Data). Red line parallel to the x-axis is the nominal FDR. Values are averages over 100 iterations for each parameter combination. The x-axis (effect size) within each panel represents the linear effect size parameter; a higher effect size represents a stronger association. For visualization purposes, the best-performing methods from each class of models (as measured by average F1 score) are shown. Methods are sorted by increasing order of average F1 score across all simulation parameters in this setting.CC0 · PubMed Central
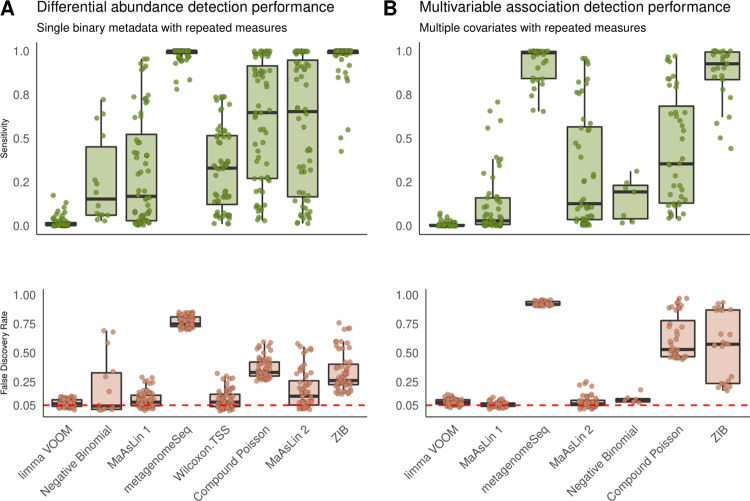
Fig 4 MaAsLin 2 enables targeted microbial feature testing in the presence of repeated measures. Results on simulated data comprising SparseDOSSA-derived compositions with five repeated measures per sample. The FDR is close to the target 0.05 level for MaAsLin 2’s default linear model but not for zero-inflated and count models (full results in S1–S8 Data). As before, MaAsLin 2’s linear model is consistently better powered than both negative binomial and limma VOOM at comparable FDR values, which remains consistent for both univariate continuous metadata (A) and multivariable metadata designs (B). The red line parallel to the x-axis is the given threshold for FDR in multiple testing. Within each panel, methods are sorted by increasing order of average F1 score across all associated simulation parameters in each setting.
Fig 4 MaAsLin 2 enables targeted microbial feature testing in the presence of repeated measures. Results on simulated data comprising SparseDOSSA-derived compositions with five repeated measures per sample. The FDR is close to the target 0.05 level for MaAsLin 2’s default linear model but not for zero-inflated and count models (full results in S1–S8 Data). As before, MaAsLin 2’s linear model is consistently better powered than both negative binomial and limma VOOM at comparable FDR values, which remains consistent for both univariate continuous metadata (A) and multivariable metadata designs (B). The red line parallel to the x-axis is the given threshold for FDR in multiple testing. Within each panel, methods are sorted by increasing order of average F1 score across all associated simulation parameters in each setting.CC0 · PubMed Central
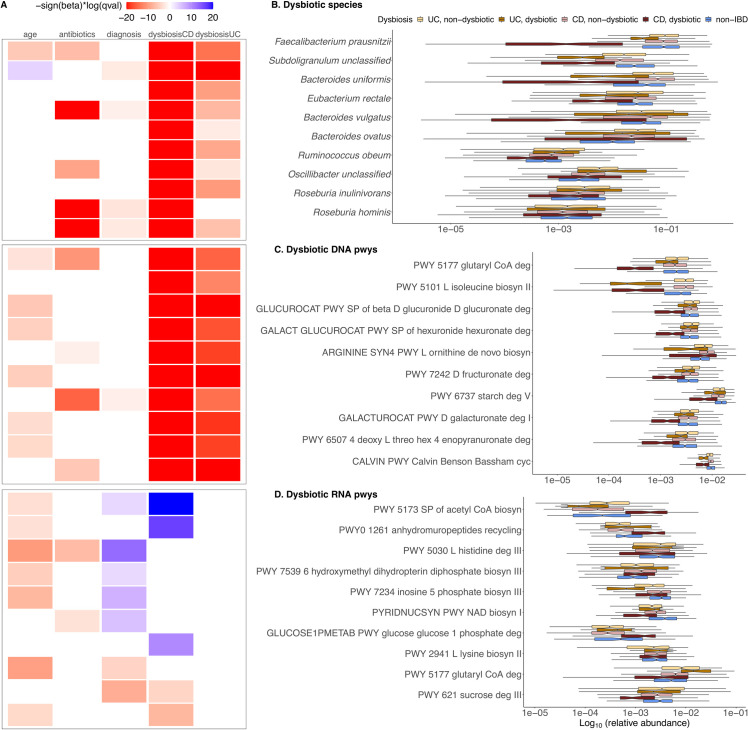
Fig 5 Multi-omics associations from the Integrative Human Microbiome Project. A) Top 10 significant associations (FDR < 0.25) detected by MaAsLin 2’s default linear model (full results in S9–S14 Data). All detected associations are adjusted for subjects and sites as random effects and for other fixed effects metadata including the subject’s age, diagnosis status (CD, UC, or non-IBD), disease activity (defined as median Bray-Curtis dissimilarity from a reference set of non-IBD samples), and antibiotic usage. B,C,D) Representative significant associations with dysbiosis state from each omics profile are shown: species (B), metagenomic (DNA) pathways (C), and metatranscriptomic (RNA) pathways (D). Values are log-transformed relative abundances with half the minimum relative abundance as pseudo count.
Fig 5 Multi-omics associations from the Integrative Human Microbiome Project. A) Top 10 significant associations (FDR < 0.25) detected by MaAsLin 2’s default linear model (full results in S9–S14 Data). All detected associations are adjusted for subjects and sites as random effects and for other fixed effects metadata including the subject’s age, diagnosis status (CD, UC, or non-IBD), disease activity (defined as median Bray-Curtis dissimilarity from a reference set of non-IBD samples), and antibiotic usage. B,C,D) Representative significant associations with dysbiosis state from each omics profile are shown: species (B), metagenomic (DNA) pathways (C), and metatranscriptomic (RNA) pathways (D). Values are log-transformed relative abundances with half the minimum relative abundance as pseudo count.CC0 · PubMed Central

Verification

Claims the paper makes

The claims and statistics of this paper haven’t been checked yet.

Run the check — free, no account needed. It reads the open-access text and checks the sources it cites.

A few free checks a day · papers already verified open instantly · results are public

Claims other papers make about this one

Each is checked against this paper’s own text: does it say what the citing paper says it does?

Self-check

Percentages, sums and reported differences re-computed from the paper’s own numbers.

The self-check needs the paper’s full text.

Citations

Cites

Show all 71 references

Research works printed but not linked: 1

  1. E Ren BS, 2020, sparseDOSSA: Sparse Data Observations for Simulating Synthetic Abundance, R package version 1.12.0.

Cited by

Sorted by citations

Items 1,001–1,002 of 1,002

Metadata

Authors
Mallick, H., Rahnavard, A., McIver, L. J., Ma, S., Zhang, Y., Nguyen, L. H., Tickle, T. L., Weingart, G., Ren, B., Schwager, E. H., Chatterjee, S., Thompson, K. N., Wilkinson, J. E., Subramanian, A., Lu, Y., Waldron, L., Paulson, J. N., Franzosa, E. A., Bravo, H. C., & Huttenhower, C.
Affiliations
  • Broad Institute (US)
  • George Washington University (US)
  • Harvard University (US)
  • National Institutes of Health (US)
  • City University of New York (US)
  • Genentech (US)
Corresponding author
Huttenhower, Curtis
Venue
PLOS Computational Biology
Published
2021-11-16
Volume
17
Issue
11
Pages
e1009442
ISSN
  • 1553-734X (ISSN-L)
  • 1553-7358
OpenAlex
W3211779138
Cited by
2,596
References
71
Citations by year
2026: 564 · 2025: 721 · 2024: 611 · 2023: 378 · 2022: 220 · 2021: 91
FWCI
107.10
Type
journal article
Language
en
Open access
Locations
  • PLoS Computational Biology (publishedVersion, public-domain)
  • bioRxiv (Cold Spring Harbor Laboratory) (acceptedVersion, public-domain)
  • PubMed Central (publishedVersion, public-domain)
  • PubMed (publishedVersion)
  • RePEc: Research Papers in Economics (submittedVersion)
  • DOAJ (DOAJ: Directory of Open Access Journals) (submittedVersion, cc-by-sa)
Funders
  • US National Science Foundation, Division of Environmental Biology (DEB 2028280)
  • national institute of allergy and infectious diseases (U19AI110820)
  • national human genome research institute (R01HG005220)
  • national institute of diabetes and digestive and kidney diseases (R24DK110499, U54DK102557)
Topics
  • Life Sciences › Biochemistry, Genetics and Molecular Biology › Molecular Biology › Gut microbiota and health
  • Health Sciences › Dentistry › Periodontics › Oral microbiology and periodontitis research
  • Physical Sciences › Environmental Science › Ecology › Microbial Community Ecology and Physiology
Keywords
generalized linear models, mixed models, compositional data, count data, zero-inflated data, repeated measures, false discovery rate control, statistical power, inflammatory bowel disease
MeSH terms
Gastrointestinal Microbiome, Computer Simulation, Humans, Inflammatory Bowel Diseases, Multivariate Analysis, Computational Biology

About these checks

Registry, retraction, Cites and statistics results are computed, not judged, with one exception: a printed reference that no index lists is read once by a model before it counts as a citation error. Claims are extracted by a model and kept only when their quote appears verbatim in the text; each cited source is then checked, with a model’s help, for whether it says what the claim relies on. Those verdicts can be wrong — read the claim’s quote and the cited source before relying on one.

Statistics and arithmetic are recomputed, not judged.

Confidence bands are shown only for fields calibrated on our annotated test set. None is calibrated yet, so no band is shown.

What counts as a claim ›How we measure confidence ›How we check this ›

Are you an author, or do you see a problem with this page? Request a review