

Forward Genetic Analysis of Visual Behavior in Zebrafish
Open accessThe DOI matches its Crossref record; 48 of the 48 references it cites were found in a registry or an index.
Abstract
The visual system converts the distribution and wavelengths of photons entering the eye into patterns of neuronal activity, which then drive motor and endocrine behavioral responses. The gene products important for visual processing by a living and behaving vertebrate animal have not been identified in an unbiased fashion. Likewise, the genes that affect development of the nervous system to shape visual function later in life are largely unknown. Here we have set out to close this gap in our understanding by using a forward genetic approach in zebrafish. Moving stimuli evoke two innate reflexes in zebrafish larvae, the optomotor and the optokinetic response, providing two rapid and quantitative tests to assess visual function in wild-type (WT) and mutant animals. These behavioral assays were used in a high-throughput screen, encompassing over half a million fish. In almost 2,000 F2 families mutagenized with ethylnitrosourea, we discovered 53 recessive mutations in 41 genes. These new mutations have generated a broad spectrum of phenotypes, which vary in specificity and severity, but can be placed into only a handful of classes. Developmental phenotypes include complete absence or abnormal morphogenesis of photoreceptors, and deficits in ganglion cell differentiation or axon targeting. Other mutations evidently leave neuronal circuits intact, but disrupt phototransduction, light adaptation, or behavior-specific responses. Almost all of the mutants are morphologically indistinguishable from WT, and many survive to adulthood. Genetic linkage mapping and initial molecular analyses show that our approach was effective in identifying genes with functions specific to the visual system. This collection of zebrafish behavioral mutants provides a novel resource for the study of normal vision and its genetic disorders.
Overview
The claims and statistics of this paper haven’t been checked yet.
Free: it reads the open-access text and checks the first 5 claims that cite a source we can check. Create a free account to check every claim.
Integrity signals
Registry
Cites
Statistics
Figures




Verification
Claims the paper makes
The claims and statistics of this paper haven’t been checked yet.
Free: it reads the open-access text and checks the first 5 claims that cite a source we can check. Create a free account to check every claim.
Claims other papers make about this one
Each is checked against this paper’s own text: does it say what the citing paper says it does?
The cited source says what the claim attributes to it.
In the citing paper
“The OMR in larval zebrafish is comprised of orientation and locomotor movements in response to whole-field visual motion patterns”
From Neural control and modulation of swimming speed in the larval zebrafish (2014) · cites this paper as Muto et al., 2005
Self-check
Percentages, sums and reported differences re-computed from the paper’s own numbers.
The self-check needs the paper’s full text.
Citations
Cites
THE GENETICS OF CAENORHABDITIS ELEGANS
Brenner, S. (1974) · Genetics · doi:10.1093/genetics/77.1.71 · Cited by 15,081
Mutations affecting segment number and polarity in Drosophila
Nüsslein-Volhard, C., & Wieschaus, E. (1980) · Nature · doi:10.1038/287795a0 · Cited by 4,370 · cited 1×
“Systematic forward genetic approaches have been applied with great success to many areas of biology in a variety of model species. Mutants are not only starting points for gene discovery; their phenotypes often elucidate underlying biological mechanisms even before molecular identification of the mutated genes (e.g., [”
BackgroundHaffter, P., Granato, M., Brand, M., Mullins, M. C., Hammerschmidt, M., Kane, D. A., Odenthal, J., J. M. van Eeden, F., Jiang, Y.-J., Heisenberg, C.-P., et al. (1996) · Development · doi:10.1242/dev.123.1.1 · Cited by 1,662
A genetic screen for mutations affecting embryogenesis in zebrafish
Driever, W., Solnica-Krezel, L., Schier, A. F., Neuhauss, S. C. F., Malicki, J., Stemple, D. L., Stainier, D. Y. R., Zwartkruis, F., Abdelilah, S., Rangini, Z., et al. (1996) · Development · doi:10.1242/dev.123.1.37 · Cited by 1,337
Witkovsky, P. (2004) · Documenta Ophthalmologica · doi:10.1023/b:doop.0000019487.88486.0a · Cited by 809 · cited 1×
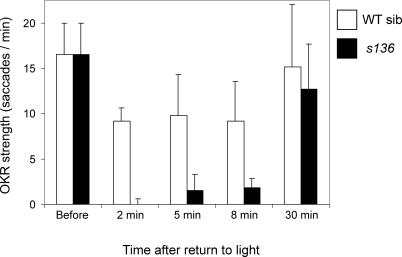
“At least two adaptation mechanisms are operational in the vertebrate retina, one acting on the phototransduction cascade itself [36–38] and the other on synaptic strengths within the network of neurons [39].”
BackgroundLarge-scale mutagenesis in the zebrafish: in search of genes controlling development in a vertebrate
Mullins, M. C., Hammerschmidt, M., Haffter, P., & Nüsslein-Volhard, C. (1994) · Current Biology · doi:10.1016/s0960-9822(00)00048-8 · Cited by 763 · cited 1×
“Calculations based on binomial statistics [18], taking into account the number of F1 fish used to generate the F2 families, the number of F2 families, the number of crosses for each F2 family, and the number of F3 larval fish tested, show that our screen encompassed 1,688 ENU-mutagenized genomes.”
BackgroundGenes controlling and mediating locomotion behavior of the zebrafish embryo and larva
Granato, M., Eeden, F. J. M. V., Schach, U., Trowe, T., Brand, M., Furutani-Seiki, M., Haffter, P., Hammerschmidt, M., Heisenberg, C.-P., Jiang, Y.-J., et al. (1996) · Development · doi:10.1242/dev.123.1.399 · Cited by 644
Adaptation in Vertebrate Photoreceptors
Fain, G. L., Matthews, H. R., Cornwall, M. C., & Koutalos, Y. (2001) · Physiological Reviews · doi:10.1152/physrev.2001.81.1.117 · Cited by 569 · cited 1×
“At least two adaptation mechanisms are operational in the vertebrate retina, one acting on the phototransduction cascade itself [36–38] and the other on synaptic strengths within the network of neurons [39].”
BackgroundThe Development of Vision in the Zebrafish (Danio rerio)
Easter, Jr., & Nicola, G. N. (1996) · Developmental Biology · doi:10.1006/dbio.1996.0335 · Cited by 532 · cited 1×
“]. These two behaviors employ different motor outputs (swimming and eye movements, respectively), but they are both elicited by large-field motion and are dependent on the retina as the light-sensing organ [”
BackgroundVisual transduction in Drosophila
Hardie, R. C., & Raghu, P. (2001) · Nature · doi:10.1038/35093002 · Cited by 515 · cited 1×
“In these invertebrate species, the forward genetic strategy was particularly productive for the analysis of sensory systems, such as vision, mechanosensation, and olfaction, where these screens helped to discover many genes important for the patterning of sensory epithelia and for sensory transduction [3–7].”
Background
Cited by
Population genomics of domestic and wild yeasts
Liti, G., Carter, D. M., Moses, A. M., Warringer, J., Parts, L., James, S. A., Davey, R. P., Roberts, I. N., Burt, A., Koufopanou, V., et al. (2009) · Nature · doi:10.1038/nature07743 · Cited by 1,392
Target identification and mechanism of action in chemical biology and drug discovery
Schenone, M., Dančík, V., Wagner, B. K., & Clemons, P. A. (2013) · Nature Chemical Biology · doi:10.1038/nchembio.1199 · Cited by 1,096
Microbe domestication and the identification of the wild genetic stock of lager-brewing yeast
Libkind, D., Hittinger, C. T., Valério, E., Gonçalves, C., Dover, J., Johnston, M., Gonçalves, P., & Sampaio, J. P. (2011) · Proceedings of the National Academy of Sciences · doi:10.1073/pnas.1105430108 · Cited by 636
Bernardos, R. L., Barthel, L. K., Meyers, J. R., & Raymond, P. A. (2007) · Journal of Neuroscience · doi:10.1523/jneurosci.1624-07.2007 · Cited by 647
“This neuroendocrine-controlled camouflage response is a response to ambient, background light levels (Muto et al., 2005), and the darkening response suggests that the intense light blinded the fish.”
BackgroundImproving industrial yeast strains: exploiting natural and artificial diversity
Steensels, J., Snoek, T., Meersman, E., Nicolino, M. P., Voordeckers, K., & Verstrepen, K. J. (2014) · FEMS Microbiology Reviews · doi:10.1111/1574-6976.12073 · Cited by 479
Metadata
- Authors
- Muto, A., Orger, M. B., Wehman, A. M., Smear, M. C., Kay, J. N., Page-McCaw, P. S., Gahtan, E., Xiao, T., Nevin, L. M., Gosse, N. J., Staub, W., Finger-Baier, K., & Baier, H.
- Affiliations
- University of California, San Francisco (US)
- Corresponding author
- Baier, Herwig
- ORCID
- Venue
- PLoS Genetics
- Publisher
- Public Library of Science (PLoS)
- Published
- 2005-11-25
- Volume
- 1
- Issue
- 5
- Pages
- e66
- ISSN
- 1553-7390 (ISSN-L)
- 1553-7404
- PMC
- PMC1287954
- OpenAlex
- W1985827566
- Cited by
- 321
- References
- 48
- Citations by year
- 2026: 7 · 2025: 6 · 2024: 8 · 2023: 3 · 2022: 16 · 2021: 13 · 2020: 14 · 2019: 15 · 2018: 14 · 2017: 19 · 2016: 17 · 2015: 13 · 2014: 19 · 2013: 21 · 2012: 23
- FWCI
- 5.57
- Type
- journal article
- Language
- en
- Open access
- gold
- doi.org
- Locations
- PLoS Genetics (publishedVersion, cc-by)
- Europe PMC (PubMed Central) (publishedVersion, cc-by)
- PubMed Central (publishedVersion, cc-by)
- PubMed (publishedVersion)
- DOAJ (DOAJ: Directory of Open Access Journals) (submittedVersion, cc-by-sa)
- eScholarship (California Digital Library) (submittedVersion)
- Figshare (submittedVersion, cc-by)
- Funders
- National Science Foundation
- David and Lucile Packard Foundation
- Alfred P. Sloan Foundation
- American Heart Association
- American Association of University Women
- National Alliance for Research on Schizophrenia and Depression
- National Institutes of Health
- University of California, San Francisco
- National Eye Institute (EY 13855, EY12406, R01EY013855, R01EY012406)
- National Institute of Neurological Disorders and Stroke (R21NS042328, NS-42328)
- Topics
- Life Sciences › Biochemistry, Genetics and Molecular Biology › Cell Biology › Zebrafish Biomedical Research Applications
- Health Sciences › Medicine › Ophthalmology › Retinal Development and Disorders
- Life Sciences › Neuroscience › Cognitive Neuroscience › Visual perception and processing mechanisms
- Keywords
- forward genetic screen, optomotor response, optokinetic response, photoreceptor development, retinal ganglion cell differentiation, axon targeting, phototransduction, light adaptation, ethylnitrosourea mutagenesis, linkage mapping, visual system development
- MeSH terms
- Animals, Axons, Behavior, Animal, Ethylnitrosourea, Gene Expression Regulation, Genetic Techniques, Genetic Linkage, Ocular Physiological Phenomena, Phenotype, Photoreceptor Cells, Vision, Ocular, Zebrafish, Mutagenesis
About these checks
Registry, retraction, Cites and statistics results are computed, not judged, with one exception: a printed reference that no index lists is read once by a model before it counts as a citation error. Claims are extracted by a model and kept only when their quote appears verbatim in the text; each cited source is then checked, with a model’s help, for whether it says what the claim relies on. Those verdicts can be wrong — read the claim’s quote and the cited source before relying on one.
Statistics and arithmetic are recomputed, not judged.
Confidence bands are shown only for fields calibrated on our annotated test set. None is calibrated yet, so no band is shown.
What counts as a claim ›How we measure confidence ›How we check this ›
Are you an author, or do you see a problem with this page? Request a review
How to cite
Cite CoChat for the checks on this page, and the paper for its own findings.
- This page
- CoChat. (2026). Citation check: Forward Genetic Analysis of Visual Behavior in Zebrafish. https://app.cochat.ai/papers/10.1371/journal.pgen.0010066
- The paper
- Muto, A., Orger, M. B., Wehman, A. M., Smear, M. C., Kay, J. N., Page-McCaw, P. S., Gahtan, E., Xiao, T., Nevin, L. M., Gosse, N. J., Staub, W., Finger-Baier, K., & Baier, H. (2005). Forward Genetic Analysis of Visual Behavior in Zebrafish. PLoS Genetics. https://doi.org/10.1371/journal.pgen.0010066
Data sources
Bibliographic data: Semantic Scholar, OpenAlex, Crossref.
Contains information from the Semantic Scholar Academic Graph Datasets, made available under the ODC Attribution License (ODC-BY 1.0).
Semantic Scholar’s data is described in: Kinney, R., et al. (2023). The Semantic Scholar Open Data Platform. arXiv:2301.10140.
