Cited by 387Epigenetics and DNA MethylationHistone Deacetylase Inhibitors ResearchSirtuins and Resveratrol in Medicine

The DOI matches its Crossref record; 56 of the 56 references it cites were found in a registry or an index.

Inhibition of SIRT1 Reactivates Silenced Cancer Genes without Loss of Promoter DNA Hypermethylation

Open access

Abstract

The class III histone deactylase (HDAC), SIRT1, has cancer relevance because it regulates lifespan in multiple organisms, down-regulates p53 function through deacetylation, and is linked to polycomb gene silencing in Drosophila. However, it has not been reported to mediate heterochromatin formation or heritable silencing for endogenous mammalian genes. Herein, we show that SIRT1 localizes to promoters of several aberrantly silenced tumor suppressor genes (TSGs) in which 5' CpG islands are densely hypermethylated, but not to these same promoters in cell lines in which the promoters are not hypermethylated and the genes are expressed. Heretofore, only type I and II HDACs, through deactylation of lysines 9 and 14 of histone H3 (H3-K9 and H3-K14, respectively), had been tied to the above TSG silencing. However, inhibition of these enzymes alone fails to re-activate the genes unless DNA methylation is first inhibited. In contrast, inhibition of SIRT1 by pharmacologic, dominant negative, and siRNA (small interfering RNA)-mediated inhibition in breast and colon cancer cells causes increased H4-K16 and H3-K9 acetylation at endogenous promoters and gene re-expression despite full retention of promoter DNA hypermethylation. Furthermore, SIRT1 inhibition affects key phenotypic aspects of cancer cells. We thus have identified a new component of epigenetic TSG silencing that may potentially link some epigenetic changes associated with aging with those found in cancer, and provide new directions for therapeutically targeting these important genes for re-expression.

Overview

The claims and statistics of this paper haven’t been checked yet.

Run the check — free, no account needed. It reads the open-access text and checks the sources it cites.

A few free checks a day · papers already verified open instantly · results are public

Integrity signals

Registry

Crossref · 10.1371/journal.pgen.0020040

Cites

56 of 56 references verified0 citation errors · 0 not checkable

Statistics

Figures

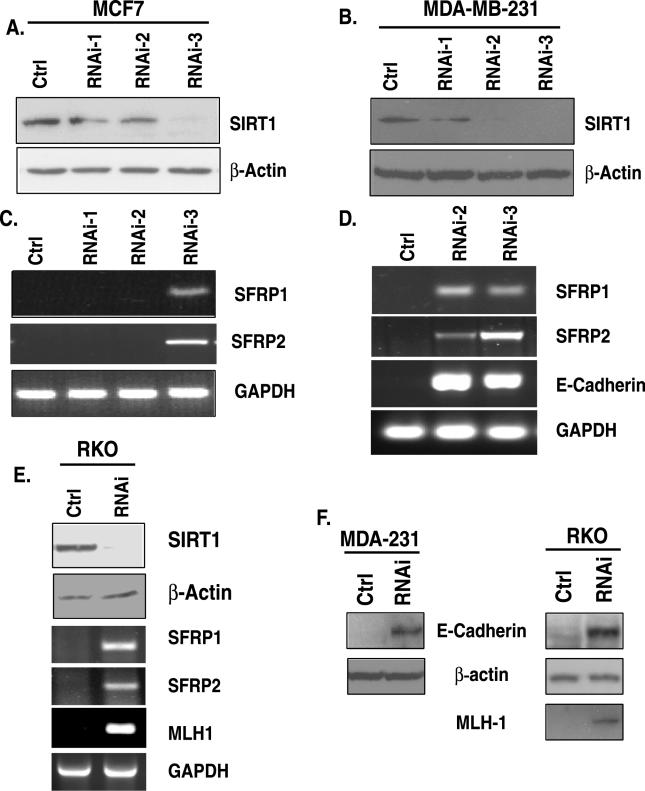
Figure 1 siRNA Knockdown of SIRT1 Causes Re-Expression of Epigenetically Silenced TSGs (A) RNAi-3 is most effective for reduction of SIRT1 in MCF7 cells. Retroviral expression vectors encoding SIRT1 cDNA that produce short hairpin loop RNA targeting either distinct regions of SIRT1 mRNA (RNAi-1, −2, or −3) or a control (ctrl) were used to infect MCF7. Western blot analysis for SIRT1 and β-actin was performed 48 h after two rounds of infection. (B) Both RNAi-2 and −3 are effective for reduction of SIRT1 protein in MDA-MB-231 cells as described in (A). (C) SIRT1 inhibition leads to TSG re-expression in MCF7 cells. RNA was isolated from parallel samples analyzed in (A), and RT-PCR was performed with intron-spanning primers specific for the genes SFRP1 and SFRP2. GAPDH was also analyzed as a control. Only the shRNA (RNAi-3) that caused substantial reduction in SIRT1 protein leads to gene re-expression. Control samples in which no reverse transcriptase was added were analyzed separately, and all were negative for amplification of the indicated genes. (D) SIRT1 inhibition leads to TSG re-expression in MDA-MB-231 cells. RT-PCR was performed for analysis of the genes SFRP1, SFRP2, and E-cadherin as described in (A). Only the shRNAs (RNAi-2 and −3) that caused substantial reduction in SIRT1 protein lead to gene re-expression (E) SIRT1 inhibition leads to TSG re-expression in RKO cells. SIRT1 protein reduction by RNAi-3 (top panel) as described in (A) leads to gene re-expression of SFRP1, SFRP2, and MLH1 as described in (C) (F) MDA-MB-231 and RKO cells infected with control or RNAi-3 shRNA as described in (A) were selected with puromycin for 3 d, and pooled colonies were harvested for Western blot analysis of protein re-expression that corresponded with the gene reactivation described in (D) and (E).
Figure 1 siRNA Knockdown of SIRT1 Causes Re-Expression of Epigenetically Silenced TSGs (A) RNAi-3 is most effective for reduction of SIRT1 in MCF7 cells. Retroviral expression vectors encoding SIRT1 cDNA that produce short hairpin loop RNA targeting either distinct regions of SIRT1 mRNA (RNAi-1, −2, or −3) or a control (ctrl) were used to infect MCF7. Western blot analysis for SIRT1 and β-actin was performed 48 h after two rounds of infection. (B) Both RNAi-2 and −3 are effective for reduction of SIRT1 protein in MDA-MB-231 cells as described in (A). (C) SIRT1 inhibition leads to TSG re-expression in MCF7 cells. RNA was isolated from parallel samples analyzed in (A), and RT-PCR was performed with intron-spanning primers specific for the genes SFRP1 and SFRP2. GAPDH was also analyzed as a control. Only the shRNA (RNAi-3) that caused substantial reduction in SIRT1 protein leads to gene re-expression. Control samples in which no reverse transcriptase was added were analyzed separately, and all were negative for amplification of the indicated genes. (D) SIRT1 inhibition leads to TSG re-expression in MDA-MB-231 cells. RT-PCR was performed for analysis of the genes SFRP1, SFRP2, and E-cadherin as described in (A). Only the shRNAs (RNAi-2 and −3) that caused substantial reduction in SIRT1 protein lead to gene re-expression (E) SIRT1 inhibition leads to TSG re-expression in RKO cells. SIRT1 protein reduction by RNAi-3 (top panel) as described in (A) leads to gene re-expression of SFRP1, SFRP2, and MLH1 as described in (C) (F) MDA-MB-231 and RKO cells infected with control or RNAi-3 shRNA as described in (A) were selected with puromycin for 3 d, and pooled colonies were harvested for Western blot analysis of protein re-expression that corresponded with the gene reactivation described in (D) and (E).CC BY · PubMed Central
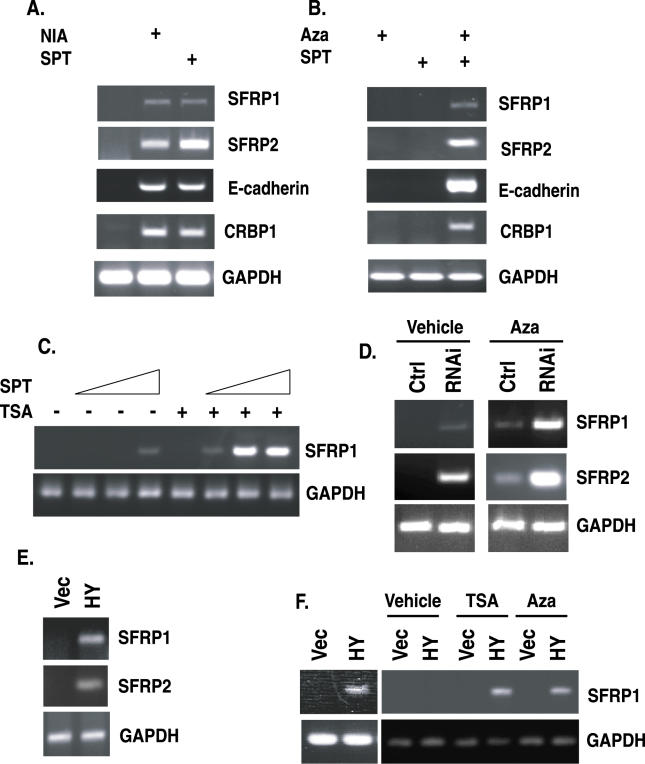
Figure 2 Pharmacologic and Dominant Negative Inhibition of SIRT1 Cause Re-Expression of TSGs and Synergize with 5-Deoxy-Azacytidine or TSA (A) Pharmacologic inhibition of SIRT1 causes TSG re-expression. MDA-MB-231 cells were treated with 15 mM NIA or 300 μM SPT for 21 h, RNA was isolated, and RT-PCR was performed with intron−spanning primers specific for the indicated genes. Control samples in which no reverse transcriptase was added were analyzed separately, and all were negative for amplification of the indicated genes. (B) Combined treatment with low doses of Aza and SPT synergizes in the re-expression of TSGs. MDA-MB-231 cells were treated with either 50 nM Aza (+), 100 μM SPT (+) or with both Aza and SPT (++), and 34 h later, RT-PCR was performed for the indicated genes as described in (A). (C) Combined treatment with SPT and TSA synergize in the re-expression of genes. MDA-MB-231 cells were treated with either 0, 50, 100, or 120 μM SPT alone for 34 h, or the treatment was followed by treatment with 300 nM TSA for 3 h prior to RNA isolation and RT-PCR analysis. (D) SIRT1 protein knockdown synergizes with low doses of Aza for gene re-expression. MDA-MB-231 cells were infected with low titers of virus for shRNA specific for SIRT1. Aza (100 nM) was added 24 h prior to RNA isolation, and RT-PCR analysis was performed for the genes SFRP1, SFRP2, and GAPDH as described in (A). (E) Dominant negative inhibition of SIRT1 leads to TSG re-expression in MCF7 cells. MCF7 cells were infected with virus encoding either pBabe (vec) or the catalytically inactive SIRT1H363Y (HY) mutant, and RT-PCR was performed as described in (A). (F) Dominant negative inhibition of SIRT1 leads to TSG re-expression and synergizes with TSA and Aza. As shown in the left panel, MDA-MB-231 cells were infected with a control (vec) or mutant SIRT1 virus (HY), and RT-PCR was performed as described in (A). MDA-MB-231 cells were infected with low titers of pBabe or pBabe-SIRT1H363Y retrovirus and subsequently treated with 100 nM Aza for 24 h or with 300 nM TSA for 3 h prior to harvest, and RT-PCR was performed.
Figure 2 Pharmacologic and Dominant Negative Inhibition of SIRT1 Cause Re-Expression of TSGs and Synergize with 5-Deoxy-Azacytidine or TSA (A) Pharmacologic inhibition of SIRT1 causes TSG re-expression. MDA-MB-231 cells were treated with 15 mM NIA or 300 μM SPT for 21 h, RNA was isolated, and RT-PCR was performed with intron−spanning primers specific for the indicated genes. Control samples in which no reverse transcriptase was added were analyzed separately, and all were negative for amplification of the indicated genes. (B) Combined treatment with low doses of Aza and SPT synergizes in the re-expression of TSGs. MDA-MB-231 cells were treated with either 50 nM Aza (+), 100 μM SPT (+) or with both Aza and SPT (++), and 34 h later, RT-PCR was performed for the indicated genes as described in (A). (C) Combined treatment with SPT and TSA synergize in the re-expression of genes. MDA-MB-231 cells were treated with either 0, 50, 100, or 120 μM SPT alone for 34 h, or the treatment was followed by treatment with 300 nM TSA for 3 h prior to RNA isolation and RT-PCR analysis. (D) SIRT1 protein knockdown synergizes with low doses of Aza for gene re-expression. MDA-MB-231 cells were infected with low titers of virus for shRNA specific for SIRT1. Aza (100 nM) was added 24 h prior to RNA isolation, and RT-PCR analysis was performed for the genes SFRP1, SFRP2, and GAPDH as described in (A). (E) Dominant negative inhibition of SIRT1 leads to TSG re-expression in MCF7 cells. MCF7 cells were infected with virus encoding either pBabe (vec) or the catalytically inactive SIRT1H363Y (HY) mutant, and RT-PCR was performed as described in (A). (F) Dominant negative inhibition of SIRT1 leads to TSG re-expression and synergizes with TSA and Aza. As shown in the left panel, MDA-MB-231 cells were infected with a control (vec) or mutant SIRT1 virus (HY), and RT-PCR was performed as described in (A). MDA-MB-231 cells were infected with low titers of pBabe or pBabe-SIRT1H363Y retrovirus and subsequently treated with 100 nM Aza for 24 h or with 300 nM TSA for 3 h prior to harvest, and RT-PCR was performed.CC BY · PubMed Central
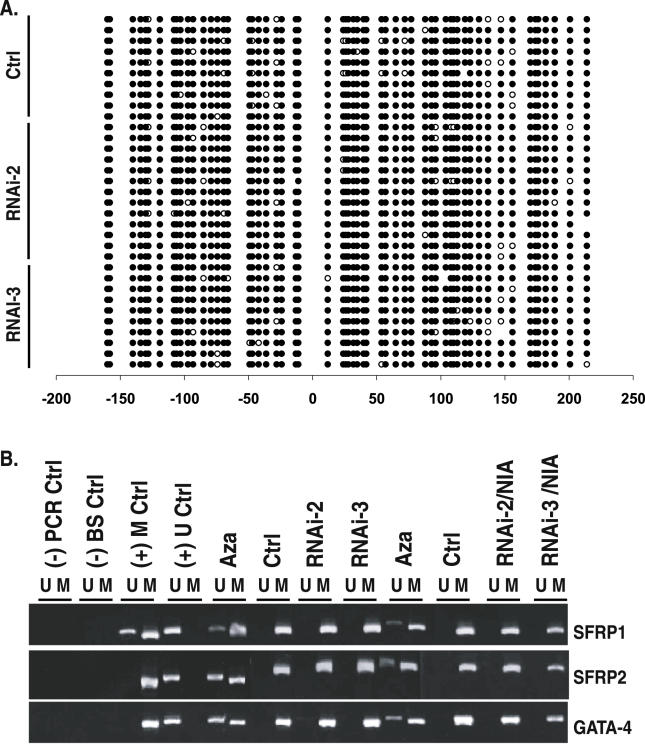
Figure 3 SIRT1 Inhibition Causes TSG Re-Expression without Changing Promoter DNA Hypermethylation (A) TSG re-expression occurs without changes in the methylation profile of multiple clones analyzed for SFRP1 promoter methylation. Parallel samples analyzed in Figure 1D were subjected to bisulfite sequencing of the SFRP1 promoter from MDA-MB-231 cells stably infected with control vector or RNAi-2 or RNAi-3 retrovirus. Open circles indicate unmethylated cytosines, and closed circles indicate methylated cytosines. Numbers at the bottom show the position of cytosines relative to the transcription start site, which is at position 0, and those with a minus sign (−) are upstream from this start site. The region sequenced encompasses the CpG island in which methylation status correlates with gene expression status. (B) MSP analyses of DNA from MDA-MB-231 cells stably expressing vector control, RNAi-2, or RNAi-3 retrovirus. From left to right: (-) PCR Ctrl indicates H2O only; (-) BS ctrl indicates bisulfite-treated H20; (+) M ctrl indicates the cell line in which SFRP1 is partially methylated and SFRP2 and GATA4 are fully methylated; and (+) U ctrl indicates the Tera-2 cell line in which each gene is unmethylated. All remaining lanes are for MDA-MB-231. From left to right: Aza indicates 1 μM Aza (24 h) treatment; Ctrl indicates empty vector infection; RNAi-2 indicates shRNA-2 infection alone; RNAi-3 indicates shRNA-3 infection alone; Aza indicates 1 μM Aza (24 h) treatment of control cells; Ctrl indicates empty vector infection + vehicle; RNAi-2 indicates shRNA-2 infection + 5 mM NIA treatment; and RNAi-3 indicates shRNA-3 infection + 5 mM NIA treatment.
Figure 3 SIRT1 Inhibition Causes TSG Re-Expression without Changing Promoter DNA Hypermethylation (A) TSG re-expression occurs without changes in the methylation profile of multiple clones analyzed for SFRP1 promoter methylation. Parallel samples analyzed in Figure 1D were subjected to bisulfite sequencing of the SFRP1 promoter from MDA-MB-231 cells stably infected with control vector or RNAi-2 or RNAi-3 retrovirus. Open circles indicate unmethylated cytosines, and closed circles indicate methylated cytosines. Numbers at the bottom show the position of cytosines relative to the transcription start site, which is at position 0, and those with a minus sign (−) are upstream from this start site. The region sequenced encompasses the CpG island in which methylation status correlates with gene expression status. (B) MSP analyses of DNA from MDA-MB-231 cells stably expressing vector control, RNAi-2, or RNAi-3 retrovirus. From left to right: (-) PCR Ctrl indicates H2O only; (-) BS ctrl indicates bisulfite-treated H20; (+) M ctrl indicates the cell line in which SFRP1 is partially methylated and SFRP2 and GATA4 are fully methylated; and (+) U ctrl indicates the Tera-2 cell line in which each gene is unmethylated. All remaining lanes are for MDA-MB-231. From left to right: Aza indicates 1 μM Aza (24 h) treatment; Ctrl indicates empty vector infection; RNAi-2 indicates shRNA-2 infection alone; RNAi-3 indicates shRNA-3 infection alone; Aza indicates 1 μM Aza (24 h) treatment of control cells; Ctrl indicates empty vector infection + vehicle; RNAi-2 indicates shRNA-2 infection + 5 mM NIA treatment; and RNAi-3 indicates shRNA-3 infection + 5 mM NIA treatment.CC BY · PubMed Central
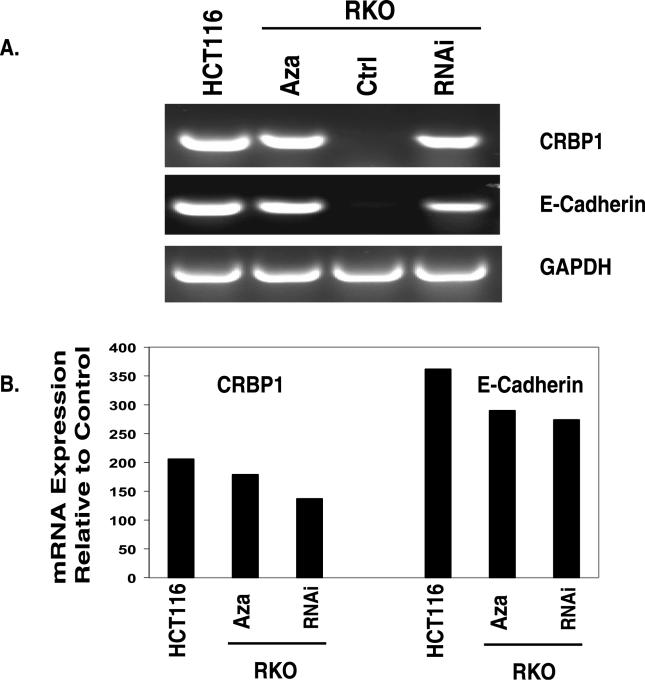
Figure 4 SIRT1 Inhibition Causes Re-Expression of Epigenetically Silenced TSGs (A) RKO cells were infected and stably selected to express short hairpin loop RNA targeting either a region unique to SIRT1 mRNA or a control (ctrl). To inhibit any residual SIRT1 protein, remaining RNAi-expressing cells were treated with 700 μM SPT and control samples were treated with DMSO for 24 h. For comparison, control RNA was isolated from parallel samples from HCT116 cells in which the two genes under study, CRB1 and E-cadherin, do not have promoter DNA hypermethylation and are basally expressed. RKO cells were also treated with 0.5 μM Aza (24 h), and samples were analyzed as described in Figure 1A; RT-PCR was performed with intron-spanning primers specific for the two genes. GAPDH was also analyzed as a control. Only the shRNA (RNAi-3) that caused substantial reduction in SIRT1 protein leads to gene re-expression. Control samples in which no reverse transcriptase was added were analyzed separately, and all were negative for amplification of the indicated genes. (B) Parallel samples described above were analyzed using real-time quantitative PCR. The level of TSG re-expression induced by Aza treatment or SIRT1 inhibition as described in (A) was compared to levels of expression in HCT116 cells in which the TSGs are basally expressed.
Figure 4 SIRT1 Inhibition Causes Re-Expression of Epigenetically Silenced TSGs (A) RKO cells were infected and stably selected to express short hairpin loop RNA targeting either a region unique to SIRT1 mRNA or a control (ctrl). To inhibit any residual SIRT1 protein, remaining RNAi-expressing cells were treated with 700 μM SPT and control samples were treated with DMSO for 24 h. For comparison, control RNA was isolated from parallel samples from HCT116 cells in which the two genes under study, CRB1 and E-cadherin, do not have promoter DNA hypermethylation and are basally expressed. RKO cells were also treated with 0.5 μM Aza (24 h), and samples were analyzed as described in Figure 1A; RT-PCR was performed with intron-spanning primers specific for the two genes. GAPDH was also analyzed as a control. Only the shRNA (RNAi-3) that caused substantial reduction in SIRT1 protein leads to gene re-expression. Control samples in which no reverse transcriptase was added were analyzed separately, and all were negative for amplification of the indicated genes. (B) Parallel samples described above were analyzed using real-time quantitative PCR. The level of TSG re-expression induced by Aza treatment or SIRT1 inhibition as described in (A) was compared to levels of expression in HCT116 cells in which the TSGs are basally expressed.CC BY · PubMed Central
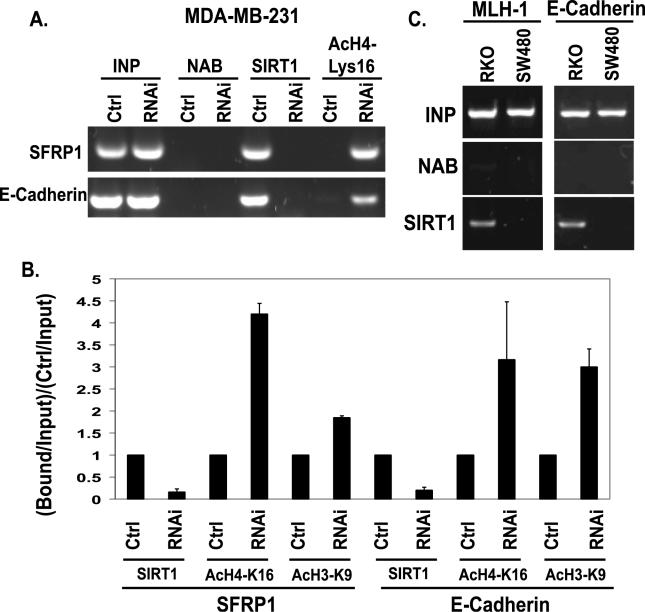
Figure 5 SIRT1 Inhibition Causes Increases in Histone H4-K16 Acetylation at the Promoter of Re-Expressed Genes (A) Pooled populations of MDA-MB-231 cells stably selected to express RNAi constructs were analyzed via ChIP. These samples were isolated in parallel to those analyzed in Figure 3B. ChIP was performed with antibodies against SIRT1, acetylated histone H4, lysine 16 (H4-K16), or with no antibody (NAB) controls. Each promoter sequence was amplified by PCR under linear conditions for the genes SFRP1 and E-cadherin. (B) The average change in SIRT1 localization, acetylation of H4-K16, and acetylation of H3K9 at the SFRP1 and E-cadherin promoters as measured by ChIP was quantitated for multiple experiments. Error bars indicate the standard deviation for multiple experiments. (C) SIRT1 localizes to the promoters of silent genes whose DNA is hypermethylated, but not to these same promoters in cells in which the genes are expressed. ChIP was performed with antibodies against SIRT1 in RKO and SW480 colon cancer cells. As shown in the left panel, SIRT1 localizes to the MLH1 promoter in RKO cells in which the gene is silent, but not to the MLH1 promoter in SW480 cells in which it is expressed. As shown in the right panel, SIRT1 localizes to the E-cadherin promoter in RKO cells in which the gene is silent, but not to the E-cadherin promoter in SW480 cells where it is expressed.
Figure 5 SIRT1 Inhibition Causes Increases in Histone H4-K16 Acetylation at the Promoter of Re-Expressed Genes (A) Pooled populations of MDA-MB-231 cells stably selected to express RNAi constructs were analyzed via ChIP. These samples were isolated in parallel to those analyzed in Figure 3B. ChIP was performed with antibodies against SIRT1, acetylated histone H4, lysine 16 (H4-K16), or with no antibody (NAB) controls. Each promoter sequence was amplified by PCR under linear conditions for the genes SFRP1 and E-cadherin. (B) The average change in SIRT1 localization, acetylation of H4-K16, and acetylation of H3K9 at the SFRP1 and E-cadherin promoters as measured by ChIP was quantitated for multiple experiments. Error bars indicate the standard deviation for multiple experiments. (C) SIRT1 localizes to the promoters of silent genes whose DNA is hypermethylated, but not to these same promoters in cells in which the genes are expressed. ChIP was performed with antibodies against SIRT1 in RKO and SW480 colon cancer cells. As shown in the left panel, SIRT1 localizes to the MLH1 promoter in RKO cells in which the gene is silent, but not to the MLH1 promoter in SW480 cells in which it is expressed. As shown in the right panel, SIRT1 localizes to the E-cadherin promoter in RKO cells in which the gene is silent, but not to the E-cadherin promoter in SW480 cells where it is expressed.CC BY · PubMed Central
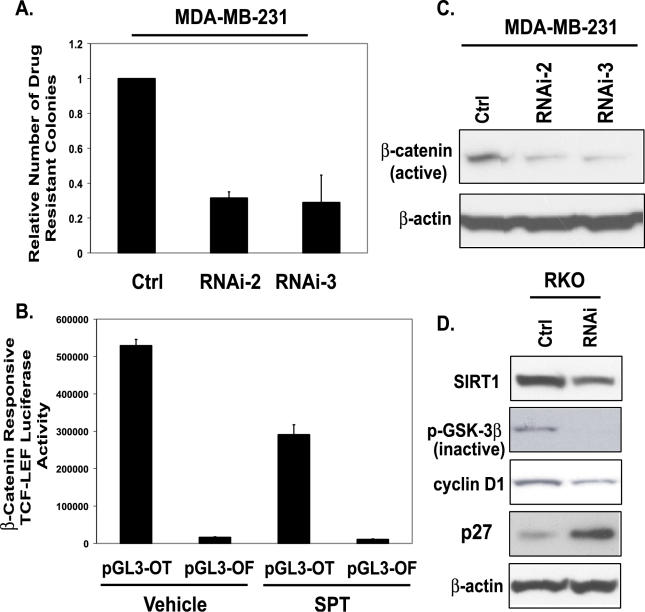
Figure 6 SIRT1 Inhibition Affects Key Phenotypic Aspects of Cancer Cells (A) MDA-MB-231 cells were infected for two rounds with RNAi-2 and −3 retrovirus, and puromycin-resistant colonies were counted after 3 d of selection. Error bars indicate standard deviation from the average of three experiments. (B) RKO cells were transfected with 500 ng of pGL3-OT, a TCF-LEF−responsive reporter, or pGL3-OF, a negative control with a mutated TCF-LEF binding site in combination with 10 ng of pRL-CMV vector. Twenty-four hours post-transfection, cells were treated with either vehicle (DMSO) control or with 700 μM SPT for 24 h. Firefly luciferase activity was measured and normalized to the Renilla luciferase activities. (C) As described in (A), pooled populations of MDA-MB-231 cells stably expressing RNAi-2 or RNAi-3 were harvested, protein concentrations were determined, and Western blot analysis was performed. An antibody that specifically recognizes the unphosphorylated (active) form of β-catenin was used, and on the same blot, β-actin was probed to ensure equal loading. (D) Western blot analysis was performed on RKO cells expressing control or SIRT1 RNAi. Antibodies against SIRT1, phospho-GSK3β (inactive), cyclin D1, p27, and β-actin were used for Western blotting. On the same blot, β-actin was probed to ensure equal loading.
Figure 6 SIRT1 Inhibition Affects Key Phenotypic Aspects of Cancer Cells (A) MDA-MB-231 cells were infected for two rounds with RNAi-2 and −3 retrovirus, and puromycin-resistant colonies were counted after 3 d of selection. Error bars indicate standard deviation from the average of three experiments. (B) RKO cells were transfected with 500 ng of pGL3-OT, a TCF-LEF−responsive reporter, or pGL3-OF, a negative control with a mutated TCF-LEF binding site in combination with 10 ng of pRL-CMV vector. Twenty-four hours post-transfection, cells were treated with either vehicle (DMSO) control or with 700 μM SPT for 24 h. Firefly luciferase activity was measured and normalized to the Renilla luciferase activities. (C) As described in (A), pooled populations of MDA-MB-231 cells stably expressing RNAi-2 or RNAi-3 were harvested, protein concentrations were determined, and Western blot analysis was performed. An antibody that specifically recognizes the unphosphorylated (active) form of β-catenin was used, and on the same blot, β-actin was probed to ensure equal loading. (D) Western blot analysis was performed on RKO cells expressing control or SIRT1 RNAi. Antibodies against SIRT1, phospho-GSK3β (inactive), cyclin D1, p27, and β-actin were used for Western blotting. On the same blot, β-actin was probed to ensure equal loading.CC BY · PubMed Central

Verification

Claims the paper makes

The claims and statistics of this paper haven’t been checked yet.

Run the check — free, no account needed. It reads the open-access text and checks the sources it cites.

A few free checks a day · papers already verified open instantly · results are public

Claims other papers make about this one

Each is checked against this paper’s own text: does it say what the citing paper says it does?

Self-check

Percentages, sums and reported differences re-computed from the paper’s own numbers.

The self-check needs the paper’s full text.

Citations

Cites

Show all 56 references

Cited by

Sorted by citations

See all 387

Metadata

Authors
Pruitt, K., Zinn, R. L., Ohm, J. E., McGarvey, K. M., Kang, S.-H. L., Watkins, D. N., Herman, J. G., & Baylin, S. B.
Affiliations
Johns Hopkins University (US)
Corresponding author
Baylin, Stephen B
Venue
PLoS Genetics
Published
2006-03-31
Volume
2
Issue
3
Pages
e40
ISSN
  • 1553-7390 (ISSN-L)
  • 1553-7404
OpenAlex
W2091685314
Cited by
387
References
56
Citations by year
2026: 3 · 2025: 6 · 2024: 5 · 2023: 3 · 2022: 3 · 2021: 8 · 2020: 10 · 2019: 17 · 2018: 13 · 2017: 8 · 2016: 22 · 2015: 27 · 2014: 20 · 2013: 37 · 2012: 28
FWCI
13.72
Type
journal article
Language
en
Open access
Locations
  • PLoS Genetics (publishedVersion, cc-by)
  • Europe PMC (PubMed Central) (publishedVersion, cc-by)
  • PubMed Central (publishedVersion, cc-by)
  • PubMed (publishedVersion)
  • DOAJ (DOAJ: Directory of Open Access Journals) (submittedVersion, cc-by-sa)
  • Figshare (submittedVersion, cc-by)
Funders
  • Johns Hopkins University
  • National Institutes of Health
Topics
  • Life Sciences › Biochemistry, Genetics and Molecular Biology › Molecular Biology › Epigenetics and DNA Methylation
  • Life Sciences › Biochemistry, Genetics and Molecular Biology › Molecular Biology › Histone Deacetylase Inhibitors Research
  • Health Sciences › Medicine › Geriatrics and Gerontology › Sirtuins and Resveratrol in Medicine
Keywords
SIRT1, class III histone deacetylase, tumor suppressor gene silencing, epigenetic silencing, histone acetylation, SIRT1 inhibition, cancer epigenetics, breast cancer, colon cancer, aging
MeSH terms
Antimetabolites, Antineoplastic, Breast Neoplasms, Colonic Neoplasms, Female, Humans, Molecular Sequence Data, Promoter Regions, Genetic, Tumor Cells, Cultured, Gene Expression Regulation, Neoplastic, Genes, Tumor Suppressor, CpG Islands, DNA Methylation, Gene Silencing, Sirtuins, Epigenesis, Genetic, HCT116 Cells, Sirtuin 1

About these checks

Registry, retraction, Cites and statistics results are computed, not judged, with one exception: a printed reference that no index lists is read once by a model before it counts as a citation error. Claims are extracted by a model and kept only when their quote appears verbatim in the text; each cited source is then checked, with a model’s help, for whether it says what the claim relies on. Those verdicts can be wrong — read the claim’s quote and the cited source before relying on one.

Statistics and arithmetic are recomputed, not judged.

Confidence bands are shown only for fields calibrated on our annotated test set. None is calibrated yet, so no band is shown.

What counts as a claim ›How we measure confidence ›How we check this ›

Are you an author, or do you see a problem with this page? Request a review