

The DOI matches its Crossref record; 46 of the 46 references it cites were found in a registry or an index.
RNA Gain-of-Function in Spinocerebellar Ataxia Type 8
Open accessAbstract
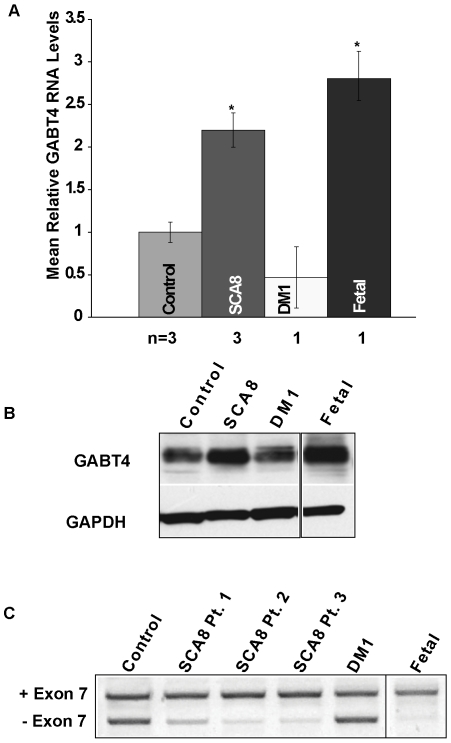
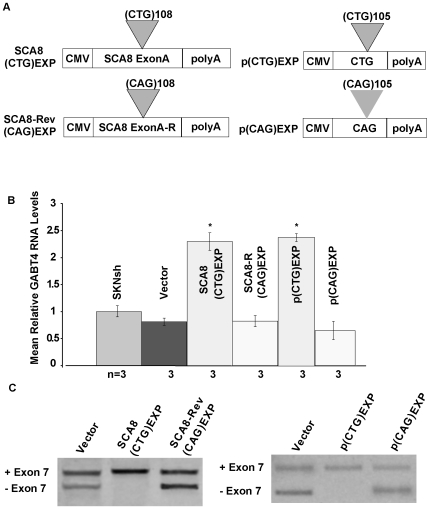
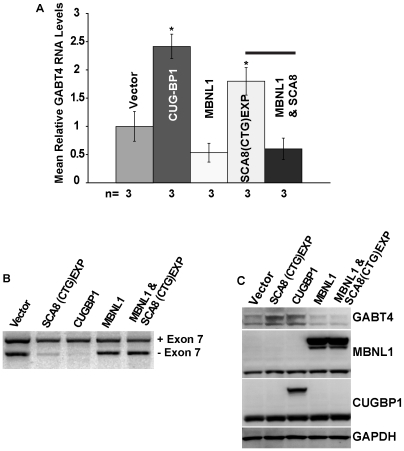
Microsatellite expansions cause a number of dominantly-inherited neurological diseases. Expansions in coding-regions cause protein gain-of-function effects, while non-coding expansions produce toxic RNAs that alter RNA splicing activities of MBNL and CELF proteins. Bi-directional expression of the spinocerebellar ataxia type 8 (SCA8) CTG CAG expansion produces CUG expansion RNAs (CUG(exp)) from the ATXN8OS gene and a nearly pure polyglutamine expansion protein encoded by ATXN8 CAG(exp) transcripts expressed in the opposite direction. Here, we present three lines of evidence that RNA gain-of-function plays a significant role in SCA8: 1) CUG(exp) transcripts accumulate as ribonuclear inclusions that co-localize with MBNL1 in selected neurons in the brain; 2) loss of Mbnl1 enhances motor deficits in SCA8 mice; 3) SCA8 CUG(exp) transcripts trigger splicing changes and increased expression of the CUGBP1-MBNL1 regulated CNS target, GABA-A transporter 4 (GAT4/Gabt4). In vivo optical imaging studies in SCA8 mice confirm that Gabt4 upregulation is associated with the predicted loss of GABAergic inhibition within the granular cell layer. These data demonstrate that CUG(exp) transcripts dysregulate MBNL/CELF regulated pathways in the brain and provide mechanistic insight into the CNS effects of other CUG(exp) disorders. Moreover, our demonstration that relatively short CUG(exp) transcripts cause RNA gain-of-function effects and the growing number of antisense transcripts recently reported in mammalian genomes suggest unrecognized toxic RNAs contribute to the pathophysiology of polyglutamine CAG CTG disorders.
Overview
The claims and statistics of this paper haven’t been checked yet.
Run the check — free, no account needed. It reads the open-access text and checks the sources it cites.
Integrity signals
Registry
Cites
Statistics
Figures
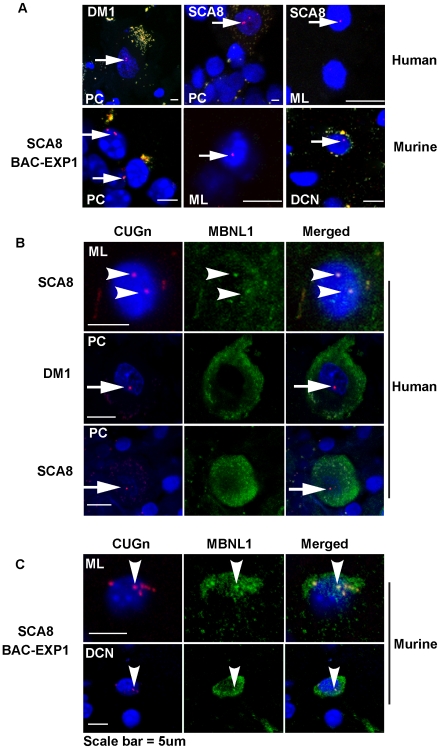
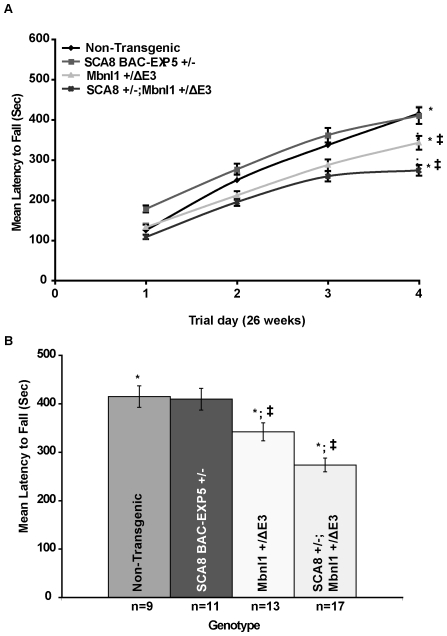
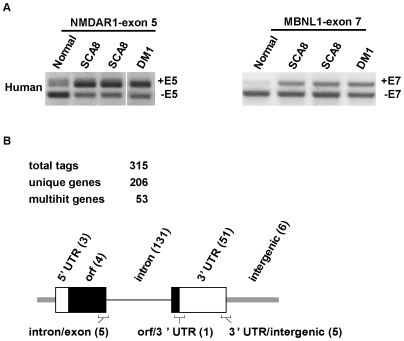
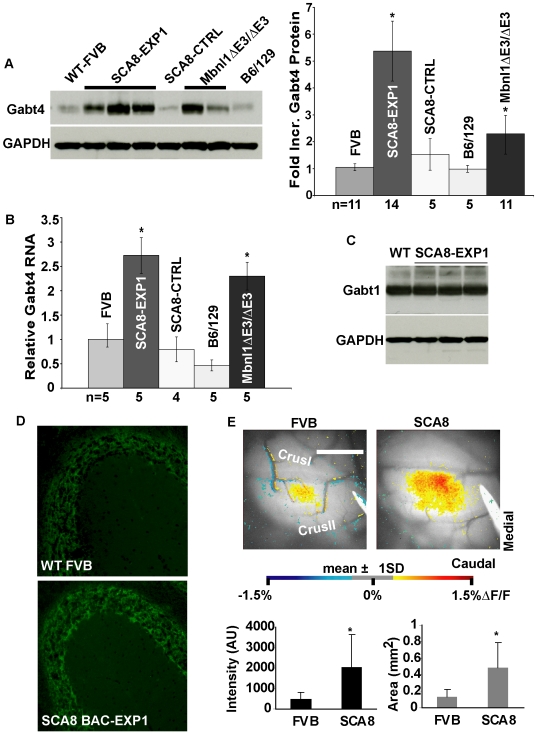
Verification
Claims the paper makes
The claims and statistics of this paper haven’t been checked yet.
Run the check — free, no account needed. It reads the open-access text and checks the sources it cites.
Claims other papers make about this one
Each is checked against this paper’s own text: does it say what the citing paper says it does?
The cited source doesn’t support the claim as written.
In the citing paper
“as the CAG repeats in polyglutamine-encoding RNAs can induce toxicity (74,75)”
From Functional genomic screen and network analysis reveal novel modifiers of tauopathy dissociated from tau phosphorylation (2011) · cites this paper as [75]
Checked by a reasoning model — may be wrong.
Experimental — accuracy not yet measuredThe source backs part of the claim, not all of it — or backs it for a different population, condition or comparison.
In the citing paper
“RNA regulation may also play a significant role in polyQ toxicity as well, as the CAG repeats in polyglutamine-encoding RNAs can induce toxicity (74,75), and polyglutamine proteins can also bind RNA with an affinity dependent on the polyQ expansion length (76).”
From Functional genomic screen and network analysis reveal novel modifiers of tauopathy dissociated from tau phosphorylation (2011) · cites this paper as [75]
Experimental — accuracy not yet measured
Self-check
Percentages, sums and reported differences re-computed from the paper’s own numbers.
The self-check needs the paper’s full text.
Citations
Cites
Antisense Transcription in the Mammalian Transcriptome
Katayama, S., Tomaru, Y., Kasukawa, T., Waki, K., Nakanishi, M., Nakamura, M., Nishida, H., Yap, C.-S., Suzuki, M., Kawai, J., et al. (2005) · Science · doi:10.1126/science.1112009 · Cited by 1,699
Myotonic Dystrophy Type 2 Caused by a CCTG Expansion in Intron 1 of ZNF9
Liquori, C. L., Ricker, K., Moseley, M. L., Jacobsen, J. F., Kreß, W., Naylor, S. L., Day, J., & Ranum, L. P. W. (2001) · Science · doi:10.1126/science.1062125 · Cited by 1,254
Self-citationCLIP Identifies Nova-Regulated RNA Networks in the Brain
Ule, J., Jensen, K. B., Ruggiu, M., Mele, A., Ule, A., & Darnell, R. B. (2003) · Science · doi:10.1126/science.1090095 · Cited by 1,120
Recruitment of human muscleblind proteins to (CUG)n expansions associated with myotonic dystrophy
Miller, J. W., Urbinati, C. R., Teng‐umnuay, P., Stenberg, M. G., Byrne, B. J., Thornton, C. A., & Swanson, M. S. (2000) · The EMBO Journal · doi:10.1093/emboj/19.17.4439 · Cited by 937
Self-citationSavkur, R. S., Philips, A. V., & Cooper, T. A. (2001) · Nature Genetics · doi:10.1038/ng704 · Cited by 795
A Muscleblind Knockout Model for Myotonic Dystrophy
Kanadia, R. N., Johnstone, K. A., Mankodi, A., Lungu, C., Thornton, C. A., Esson, D., Timmers, A. M., Hauswirth, W. W., & Swanson, M. S. (2003) · Science · doi:10.1126/science.1088583 · Cited by 743
Self-citationMyotonic Dystrophy in Transgenic Mice Expressing an Expanded CUG Repeat
Mankodi, A. K., Logigian, E. L., Callahan, L. M., McClain, C., White, R. J., Henderson, D., Krym, M., & Thornton, C. A. (2000) · Science · doi:10.1126/science.289.5485.1769 · Cited by 738
Mankodi, A. K., Takahashi, M. P., Jiang, H. N., Beck, C. L., Bowers, W. J., Moxley, R. T., Cannon, S. C., & Thornton, C. A. (2002) · Molecular Cell · doi:10.1016/s1097-2765(02)00563-4 · Cited by 672
An untranslated CTG expansion causes a novel form of spinocerebellar ataxia (SCA8)
Koob, M. D., Moseley, M. L., Schut, L. J., Benzow, K. A., Bird, T. D., Day, J., & Ranum, L. P. W. (1999) · Nature Genetics · doi:10.1038/7710 · Cited by 638
Self-citationCharlet‐Berguerand, N., Savkur, R. S., Singh, G., Philips, A. V., Grice, E. A., & Cooper, T. A. (2002) · Molecular Cell · doi:10.1016/s1097-2765(02)00572-5 · Cited by 619
Cited by
Sorted by citations
DeJesus-Hernandez, M., Mackenzie, I. R., Boeve, B. F., Boxer, A. L., Baker, M., Rutherford, N. J., Nicholson, A. M., Finch, N. A., Flynn, H., Adamson, J., et al. (2011) · Neuron · doi:10.1016/j.neuron.2011.09.011 · Cited by 4,936
Long noncoding RNAs and human disease
Wapinski, O. L., & Chang, H. Y. (2011) · Trends in Cell Biology · doi:10.1016/j.tcb.2011.04.001 · Cited by 1,925
Converging Mechanisms in ALS and FTD: Disrupted RNA and Protein Homeostasis
Ling, S.-C., Polymenidou, M., & Cleveland, D. W. (2013) · Neuron · doi:10.1016/j.neuron.2013.07.033 · Cited by 1,811
Non‐coding RNAs: regulators of disease
Taft, R. J., Pang, K. C., Mercer, T. R., Dinger, M. E., & Mattick, J. S. (2009) · The Journal of Pathology · doi:10.1002/path.2638 · Cited by 1,080
Context-dependent control of alternative splicing by RNA-binding proteins
Fu, X.-D., & Ares, M. (2014) · Nature Reviews Genetics · doi:10.1038/nrg3778 · Cited by 1,044
Metadata
- Authors
- Daughters, R. S., Tuttle, D. L., Gao, W., Ikeda, Y., Moseley, M. L., Ebner, T. J., Swanson, M. S., & Ranum, L. P. W.
- Affiliations
- University of Minnesota (US)
- University of Florida (US)
- Corresponding author
- Ranum, Laura P. W.
- Venue
- PLoS Genetics
- Publisher
- Public Library of Science (PLoS)
- Published
- 2009-08-14
- Volume
- 5
- Issue
- 8
- Pages
- e1000600
- ISSN
- 1553-7390 (ISSN-L)
- 1553-7404
- PMC
- PMC2719092
- OpenAlex
- W1965568102
- Cited by
- 278
- References
- 46
- Citations by year
- 2026: 9 · 2025: 8 · 2024: 9 · 2023: 13 · 2022: 8 · 2021: 6 · 2020: 6 · 2019: 14 · 2018: 21 · 2017: 16 · 2016: 19 · 2015: 12 · 2014: 29 · 2013: 30 · 2012: 26
- FWCI
- 10.81
- Type
- journal article
- Language
- en
- Open access
- gold
- doi.org
- Locations
- PLoS Genetics (publishedVersion, cc-by)
- PubMed Central (publishedVersion, cc-by)
- PubMed (publishedVersion)
- DOAJ (DOAJ: Directory of Open Access Journals) (submittedVersion, cc-by-sa)
- Funders
- National Ataxia Foundation
- Muscular Dystrophy Association
- McKnight Foundation
- National Institutes of Health
- National Institute of Neurological Disorders and Stroke (P01NS058901, NS40389, R01NS040389, R37NS040389)
- National Institute of Arthritis and Musculoskeletal and Skin Diseases (AR 46799, R01AR046799, P30AR057220)
- Topics
- Life Sciences › Neuroscience › Cellular and Molecular Neuroscience › Genetic Neurodegenerative Diseases
- Life Sciences › Biochemistry, Genetics and Molecular Biology › Molecular Biology › RNA Research and Splicing
- Life Sciences › Biochemistry, Genetics and Molecular Biology › Genetics › Genetics and Neurodevelopmental Disorders
- Keywords
- spinocerebellar ataxia type 8, RNA gain-of-function, CUG repeat expansion, polyglutamine, MBNL1, CUGBP1, GABAergic inhibition, granular cell layer, antisense transcripts
- MeSH terms
- Animals, Cell Line, Disease Models, Animal, Gene Expression Regulation, Humans, Mice, Transgenic, Nerve Tissue Proteins, Neurons, RNA, RNA-Binding Proteins, Alternative Splicing, Trinucleotide Repeat Expansion, Spinocerebellar Ataxias, RNA, Untranslated, Intranuclear Inclusion Bodies, Mice, RNA, Long Noncoding
About these checks
Registry, retraction, Cites and statistics results are computed, not judged, with one exception: a printed reference that no index lists is read once by a model before it counts as a citation error. Claims are extracted by a model and kept only when their quote appears verbatim in the text; each cited source is then checked, with a model’s help, for whether it says what the claim relies on. Those verdicts can be wrong — read the claim’s quote and the cited source before relying on one.
Statistics and arithmetic are recomputed, not judged.
Confidence bands are shown only for fields calibrated on our annotated test set. None is calibrated yet, so no band is shown.
What counts as a claim ›How we measure confidence ›How we check this ›
Are you an author, or do you see a problem with this page? Request a review
