

The DOI matches its Crossref record; 67 of the 68 references it cites were found in a registry or an index.
Bayesian Test for Colocalisation between Pairs of Genetic Association Studies Using Summary Statistics
Open accessAbstract
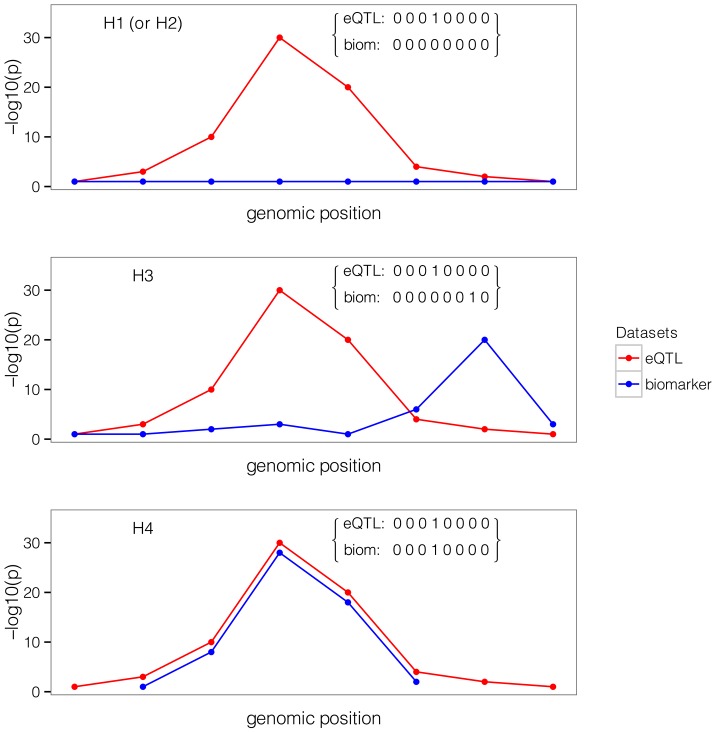
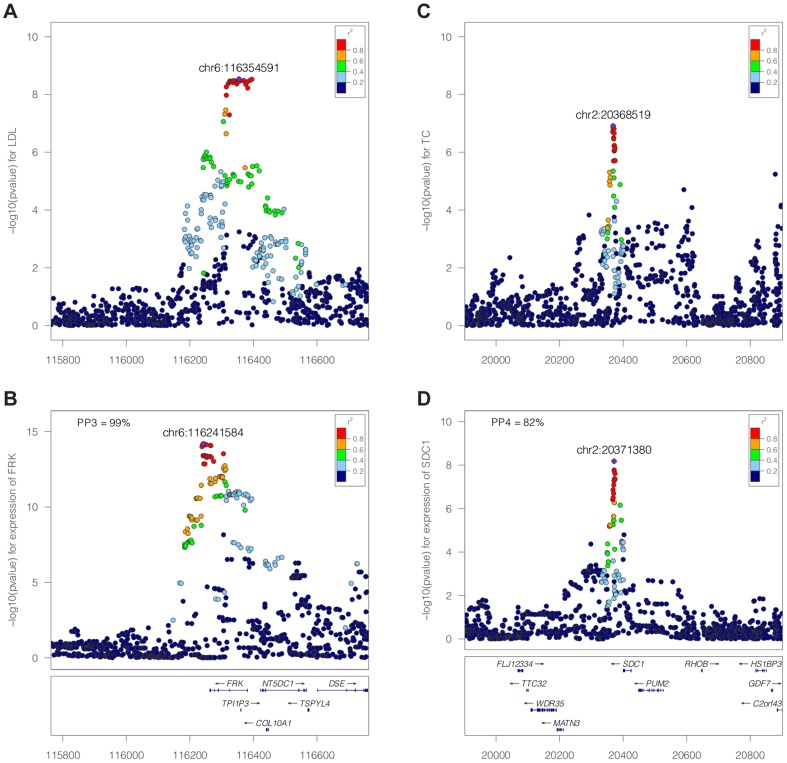
Genetic association studies, in particular the genome-wide association study (GWAS) design, have provided a wealth of novel insights into the aetiology of a wide range of human diseases and traits, in particular cardiovascular diseases and lipid biomarkers. The next challenge consists of understanding the molecular basis of these associations. The integration of multiple association datasets, including gene expression datasets, can contribute to this goal. We have developed a novel statistical methodology to assess whether two association signals are consistent with a shared causal variant. An application is the integration of disease scans with expression quantitative trait locus (eQTL) studies, but any pair of GWAS datasets can be integrated in this framework. We demonstrate the value of the approach by re-analysing a gene expression dataset in 966 liver samples with a published meta-analysis of lipid traits including >100,000 individuals of European ancestry. Combining all lipid biomarkers, our re-analysis supported 26 out of 38 reported colocalisation results with eQTLs and identified 14 new colocalisation results, hence highlighting the value of a formal statistical test. In three cases of reported eQTL-lipid pairs (SYPL2, IFT172, TBKBP1) for which our analysis suggests that the eQTL pattern is not consistent with the lipid association, we identify alternative colocalisation results with SORT1, GCKR, and KPNB1, indicating that these genes are more likely to be causal in these genomic intervals. A key feature of the method is the ability to derive the output statistics from single SNP summary statistics, hence making it possible to perform systematic meta-analysis type comparisons across multiple GWAS datasets (implemented online at http://coloc.cs.ucl.ac.uk/coloc/). Our methodology provides information about candidate causal genes in associated intervals and has direct implications for the understanding of complex diseases as well as the design of drugs to target disease pathways.
Overview
The claims and statistics of this paper haven’t been checked yet.
Run the check — free, no account needed. It reads the open-access text and checks the sources it cites.
Integrity signals
Registry
Cites
Statistics
Figures
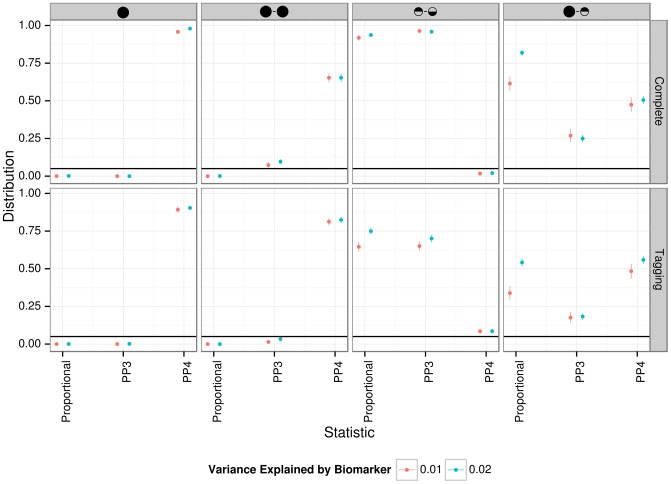
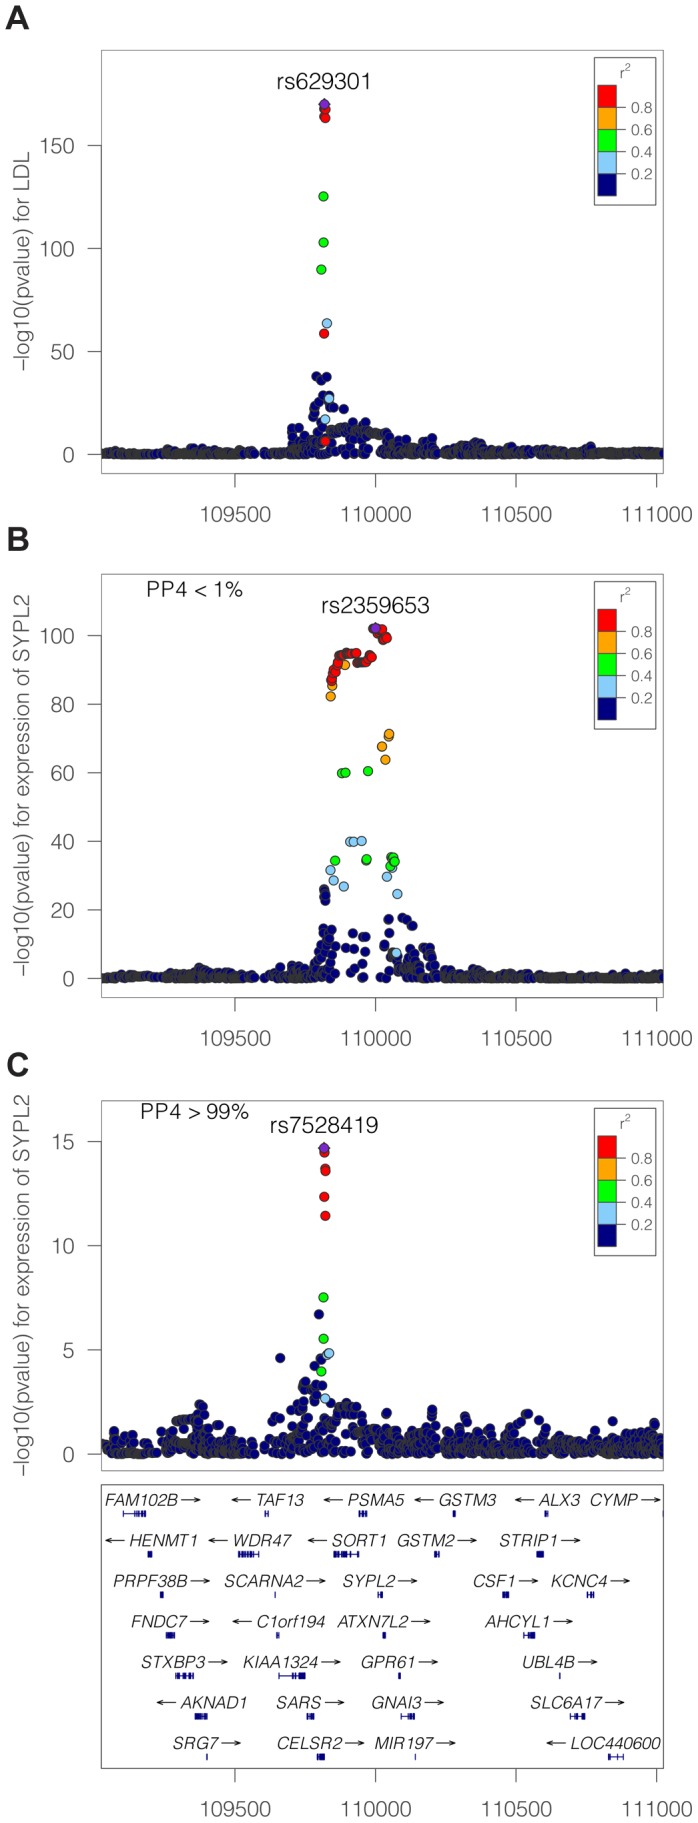
Verification
Claims the paper makes
The claims and statistics of this paper haven’t been checked yet.
Run the check — free, no account needed. It reads the open-access text and checks the sources it cites.
Claims other papers make about this one
Each is checked against this paper’s own text: does it say what the citing paper says it does?
The source backs part of the claim, not all of it — or backs it for a different population, condition or comparison.
In the citing paper
“because the presence of multiple associated variants in a region violates the assumptions of COLOC and can lead to false positives or false negatives [13].”
From Multi-trait association studies discover pleiotropic loci between Alzheimer’s disease and cardiometabolic traits (2021) · cites this paper as [13]
Experimental — accuracy not yet measuredThe source backs part of the claim, not all of it — or backs it for a different population, condition or comparison.
In the citing paper
“Considering the 106 miRNA-host pairs (103 mature miRNAs from 77 precursors in 71 host genes) for which the miRNA had miR-QTLs and the host gene had eQTLs, we found evidence of colocalization between miR-QTLs and host gene eQTLs (coloc PP.H4 > 0.5) for 17 pairs and no evidence of colocalization for 89 pairs (Supplementary Table 9).”
From Mapping the microRNA landscape in the older adult brain and its genetic contribution to neuropsychiatric conditions (2024) · cites this paper as [20]
Experimental — accuracy not yet measuredThe cited source says what the claim attributes to it.
In the citing paper
“To estimate the prior likelihood of each genomic locus having a single variant affecting both the protein and the phenotype, we used a strict Bayesian model (colocalization analysis) using the coloc package in R (Giambartolomei et al, 2014).”
From The genetic regulation of protein expression in cerebrospinal fluid (2023) · cites this paper as Giambartolomei et al, 2014
The cited source says what the claim attributes to it.
In the citing paper
“Finally, we assessed colocalization48,49 between each of our 2,477 significant pQTL associations (cis and trans) and the AD GWAS. After exclusion of pleiotropic regions, 32 proteins had QTL that colocalized with AD risk (PP.H4>0.8, Fig. 4A, Supp. Tables S43&44).”
From Proteogenomic analysis of human cerebrospinal fluid identifies neurologically relevant regulation and implicates causal proteins for Alzheimer’s disease (2024) · cites this paper as [48]
The check wasn’t confident either way, so it gives no verdict — never disputed.
In the citing paper
“Further, SPI1, MS4A4A, MS4A6A, and SELL are specifically expressed in microglia based on RNA-Seq data29–31”
From A common haplotype lowers PU.1 expression in myeloid cells and delays onset of Alzheimer's disease (2017) · cites this paper as [31]
Experimental — accuracy not yet measured
The check wasn’t confident either way, so it gives no verdict — never disputed.
In the citing paper
“Considering the 106 miRNA-host pairs (103 mature miRNAs from 77 precursors in 71 host genes) for which the miRNA had miR-QTLs and the host gene had eQTLs, we found evidence of colocalization between miR-QTLs and host gene eQTLs (coloc PP.H4 > 0.5) for 17 pairs and no evidence of colocalization for 89 pairs (Supplementary Table 9).”
From Mapping the microRNA landscape in the older adult brain and its genetic contribution to neuropsychiatric conditions (2024) · cites this paper as [20]
Experimental — accuracy not yet measuredIn the citing paper
“We also found a significant overlap between H-MAGMA and two widely used expression quantitative trait loci (eQTL)-based gene mapping tools, coloc9 and TWAS10.”
From A computational tool (H-MAGMA) for improved prediction of brain-disorder risk genes by incorporating brain chromatin interaction profiles (2020) · cites this paper as [9]
In the citing paper
“Alternatively, Bayesian frameworks for colocalization analysis consider GWAS summary statistics for both traits across multiple SNPs in the region around the IV and assess either the evidence that each variant is jointly causal115 or consider shared causal variants as one of five competing hypotheses.116”
From Mendelian randomization (2022) · cites this paper as [115]
Self-check
Percentages, sums and reported differences re-computed from the paper’s own numbers.
The self-check needs the paper’s full text.
Citations
Cites
R: A Language and Environment for Statistical Computing
R Core Team (2000) · doi:10.32614/r.manuals · Cited by 355,893
Introduction to Quantitative Genetics.
Edwards, A. W. F., & Falconer, D. S. (1982) · Biometrics · doi:10.2307/2529912 · Cited by 21,447
An integrated encyclopedia of DNA elements in the human genome
The ENCODE Project Consortium (2012) · Nature · doi:10.1038/nature11247 · Cited by 18,072
Genome-wide association study of 14,000 cases of seven common diseases and 3,000 shared controls
The Wellcome Trust Case Control Consortium, Management Committee, Burton, P. R., Clayton, D. G., Cardon, L. R., Craddock, N., Deloukas, P., Duncanson, A., Kwiatkowski, D. P., McCarthy, M. I., et al. (2007) · Nature · doi:10.1038/nature05911 · Cited by 9,442
Self-citationAn integrated map of genetic variation from 1,092 human genomes
The 1000 Genomes Project Consortium (2012) · Nature · doi:10.1038/nature11632 · Cited by 7,711
Introduction to Quantitative Genetics
J.-M., G., & Falconer, D. S. (1962) · Population · doi:10.2307/1525780 · Cited by 3,773
Biological, clinical and population relevance of 95 loci for blood lipids
Teslovich, T. M., Musunuru, K., Smith, A. V., Edmondson, A. C., Stylianou, I. M., Koseki, M., Pirruccello, J. P., Ripatti, S., Chasman, D. I., Willer, C. J., et al. (2010) · Nature · doi:10.1038/nature09270 · Cited by 3,487
Self-citationWiller (2013) · doi:10.1038/ng.2797 · Cited by 2,983
LocusZoom: regional visualization of genome-wide association scan results
Pruim, R. J., Welch, R. P., Sanna, S., Teslovich, T. M., Chines, P. S., Gliedt, T. P., Boehnke, M., Abecasis, G. R., & Willer, C. J. (2010) · Bioinformatics · doi:10.1093/bioinformatics/btq419 · Cited by 2,707
A new multipoint method for genome-wide association studies by imputation of genotypes
Marchini, J., Howie, B., Myers, S., McVean, G., & Donnelly, P. (2007) · Nature Genetics · doi:10.1038/ng2088 · Cited by 2,609
Cited by
Sorted by citations
The MR-Base platform supports systematic causal inference across the human phenome
Hemani, G., Zheng, J., Elsworth, B., Wade, K. H., Haberland, V., Baird, D., Laurin, C., Burgess, S., Bowden, J., Langdon, R., et al. (2018) · eLife · doi:10.7554/elife.34408 · Cited by 7,959
The GTEx Consortium atlas of genetic regulatory effects across human tissues
The GTEx Consortium, Aguet, F., Anand, S., Ardlie, K. G., Gabriel, S., Getz, G. A., Graubert, A., Hadley, K., Handsaker, R. E., Huang, K. H., et al. (2020) · Science · doi:10.1126/science.aaz1776 · Cited by 5,547
Genetic effects on gene expression across human tissues
GTEx Consortium (2017) · Nature · doi:10.1038/nature24277 · Cited by 4,036
Integration of summary data from GWAS and eQTL studies predicts complex trait gene targets
Zhu, Z., Zhang, F., Hu, H., Bakshi, A., Robinson, M. R., Powell, J. E., Montgomery, G. W., Goddard, M. E., Wray, N. R., Visscher, P. M., et al. (2016) · Nature Genetics · doi:10.1038/ng.3538 · Cited by 3,352
Alzheimer Disease Genetics Consortium (ADGC), Kunkle, B. W., The European Alzheimer’s Disease Initiative (EADI), Cohorts for Heart and Aging Research in Genomic Epidemiology Consortium (CHARGE), Genetic and Environmental Risk in AD/Defining Genetic, P. A. E. R. F. A. D. C. (., Grenier-Boley, B., Sims, R., Bis, J. C., Damotte, V., Naj, A. C., et al. (2019) · Nature Genetics · doi:10.1038/s41588-019-0358-2 · Cited by 2,946
Metadata
- Authors
- Giambartolomei, C., Vukcevic, D., Schadt, E. E., Franke, L., Hingorani, A. D., Wallace, C., & Plagnol, V.
- Affiliations
- University College London (GB)
- Royal Children's Hospital (AU)
- Icahn School of Medicine at Mount Sinai (US)
- University Medical Center Groningen (NL)
- University of Cambridge (GB)
- Corresponding author
- Giambartolomei, Claudia
- ORCID
- Venue
- PLoS Genetics
- Publisher
- Public Library of Science (PLoS)
- Published
- 2014-05-15
- Volume
- 10
- Issue
- 5
- Pages
- e1004383
- ISSN
- 1553-7390 (ISSN-L)
- 1553-7404
- PMC
- PMC4022491
- OpenAlex
- W2073836327
- Cited by
- 4,261
- References
- 68
- Citations by year
- 2026: 797 · 2025: 949 · 2024: 871 · 2023: 441 · 2022: 343 · 2021: 323 · 2020: 195 · 2019: 120 · 2018: 105 · 2017: 59 · 2016: 30 · 2015: 20 · 2014: 4
- FWCI
- 4.99
- Type
- journal article
- Language
- en
- Open access
- gold
- doi.org
- Locations
- PLoS Genetics (publishedVersion, cc-by)
- Europe PMC (PubMed Central) (publishedVersion, cc-by)
- PubMed Central (publishedVersion, cc-by)
- PubMed (publishedVersion)
- University of Groningen research database (University of Groningen / Centre for Information Technology) (publishedVersion, cc-by)
- arXiv (Cornell University) (submittedVersion)
- RePEc: Research Papers in Economics (submittedVersion)
- DOAJ (DOAJ: Directory of Open Access Journals) (submittedVersion, cc-by-sa)
- UCL Discovery (University College London) (submittedVersion)
- Figshare (submittedVersion, cc-by)
- Minerva Access (University of Melbourne) (submittedVersion, cc-by)
- Apollo (University of Cambridge) (submittedVersion, cc-by)
- University of Groningen research database (University of Groningen / Centre for Information Technology) (submittedVersion, cc-by)
- arXiv (Cornell University)
- Apollo (cc-by)
- Funders
- Wellcome Trust (091157, 089989, 100140, 091157/Z/10/Z, 100140/Z/12/Z, 091157/Z/10/B, 089989/Z/09/Z)
- National Institute for Health and Care Research
- British Heart Foundation
- Moorfields Eye Hospital NHS Foundation Trust
- Medical Research Council (MR/K006584/1)
- Cambridge Institute for Medical Research, University of Cambridge (100140)
- NIHR Cambridge Biomedical Research Centre
- Topics
- Life Sciences › Biochemistry, Genetics and Molecular Biology › Genetics › Genetic Associations and Epidemiology
- Life Sciences › Biochemistry, Genetics and Molecular Biology › Genetics › Genetic Mapping and Diversity in Plants and Animals
- Life Sciences › Biochemistry, Genetics and Molecular Biology › Genetics › Genetic and phenotypic traits in livestock
- Keywords
- genetic association summary statistics, expression quantitative trait loci, lipid biomarkers, hepatic gene expression, causal variant identification, SORT1, GCKR, KPNB1, cardiovascular genetics
- MeSH terms
- Bayes Theorem, Humans, Sample Size, Genome-Wide Association Study
About these checks
Registry, retraction, Cites and statistics results are computed, not judged, with one exception: a printed reference that no index lists is read once by a model before it counts as a citation error. Claims are extracted by a model and kept only when their quote appears verbatim in the text; each cited source is then checked, with a model’s help, for whether it says what the claim relies on. Those verdicts can be wrong — read the claim’s quote and the cited source before relying on one.
Statistics and arithmetic are recomputed, not judged.
Confidence bands are shown only for fields calibrated on our annotated test set. None is calibrated yet, so no band is shown.
What counts as a claim ›How we measure confidence ›How we check this ›
Are you an author, or do you see a problem with this page? Request a review
