

The DOI matches its Crossref record; 7 of the 7 references it cites were found in a registry or an index.
Fine-mapping from summary data with the “Sum of Single Effects” model
Open accessPublished version of a preprint
Abstract
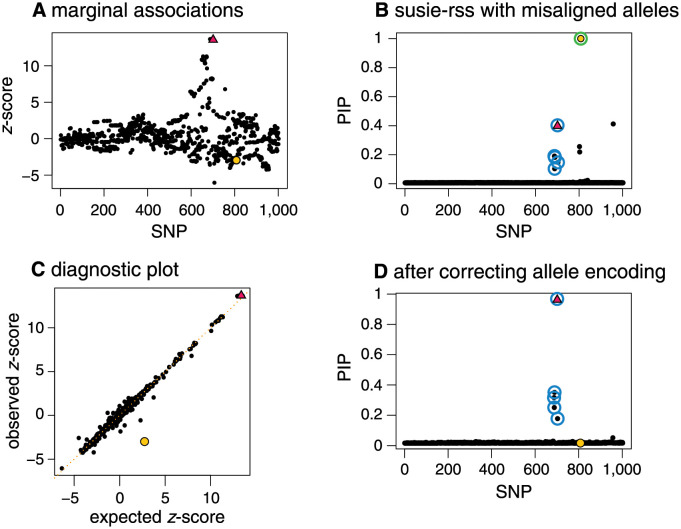
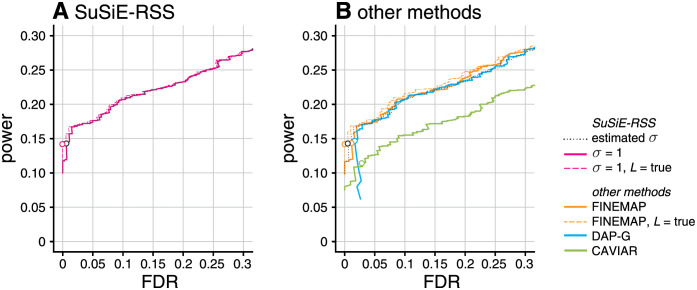
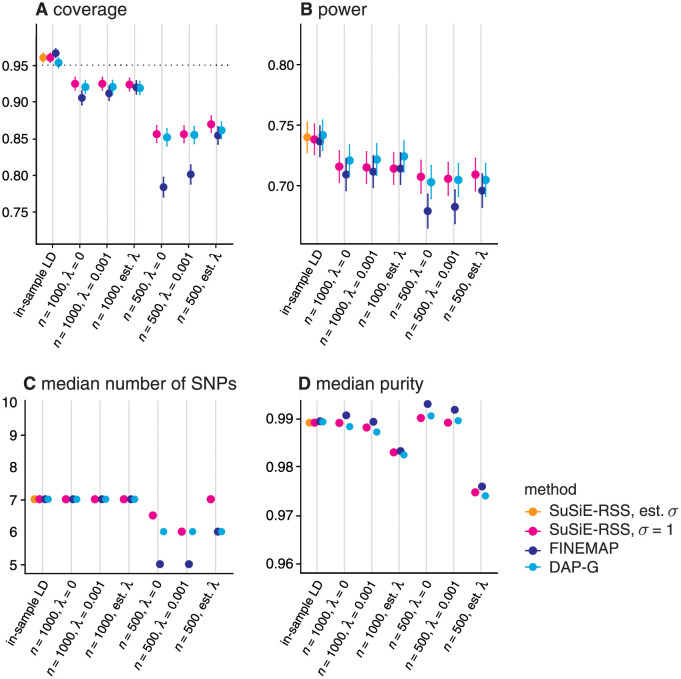
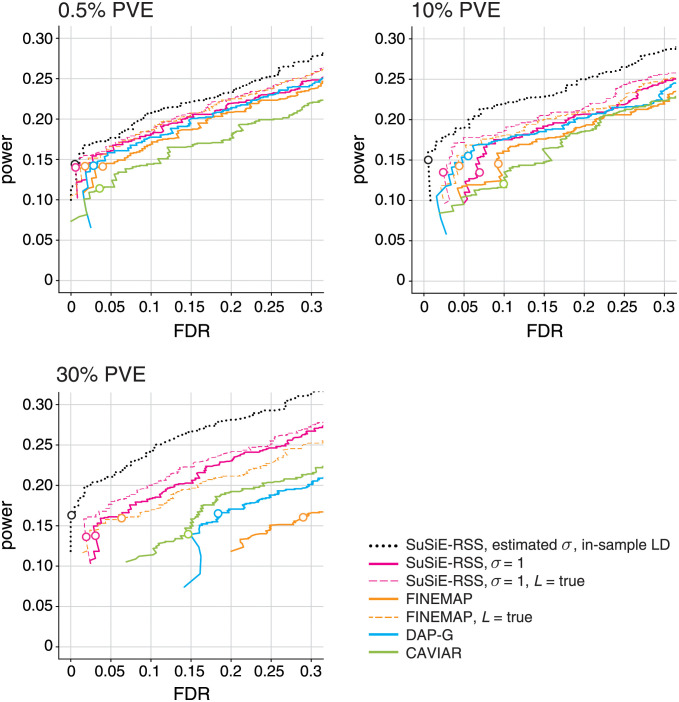
In recent work, Wang et al introduced the “Sum of Single Effects” ( SuSiE ) model, and showed that it provides a simple and efficient approach to fine-mapping genetic variants from individual-level data. Here we present new methods for fitting the SuSiE model to summary data, for example to single-SNP z -scores from an association study and linkage disequilibrium (LD) values estimated from a suitable reference panel. To develop these new methods, we first describe a simple, generic strategy for extending any individual-level data method to deal with summary data. The key idea is to replace the usual regression likelihood with an analogous likelihood based on summary data. We show that existing fine-mapping methods such as FINEMAP and CAVIAR also (implicitly) use this strategy, but in different ways, and so this provides a common framework for understanding different methods for fine-mapping. We investigate other common practical issues in fine-mapping with summary data, including problems caused by inconsistencies between the z -scores and LD estimates, and we develop diagnostics to identify these inconsistencies. We also present a new refinement procedure that improves model fits in some data sets, and hence improves overall reliability of the SuSiE fine-mapping results. Detailed evaluations of fine-mapping methods in a range of simulated data sets show that SuSiE applied to summary data is competitive, in both speed and accuracy, with the best available fine-mapping methods for summary data.
Overview
The claims and statistics of this paper haven’t been checked yet.
Run the check — free, no account needed. It reads the open-access text and checks the sources it cites.
Integrity signals
Registry
Cites
Statistics
Figures


Verification
Claims the paper makes
The claims and statistics of this paper haven’t been checked yet.
Run the check — free, no account needed. It reads the open-access text and checks the sources it cites.
Claims other papers make about this one
Each is checked against this paper’s own text: does it say what the citing paper says it does?
The source backs part of the claim, not all of it — or backs it for a different population, condition or comparison.
In the citing paper
“The s values from SuSiE-RSS ranged from 0.007 to 0.027 across fine-mapped loci, and the diagnostic plots demonstrated high consistency of LD between the summary statistics and reference panel (Supplementary Fig. 19a–g).”
From Shared genetic architectures of educational attainment in East Asian and European populations (2024) · cites this paper as [34]
Experimental — accuracy not yet measured
Self-check
Percentages, sums and reported differences re-computed from the paper’s own numbers.
The self-check needs the paper’s full text.
Citations
Cites
Second-generation PLINK: rising to the challenge of larger and richer datasets
Chang, C. C., Chow, C. C., Tellier, L. C., Vattikuti, S., Purcell, S. M., & Lee, J. J. (2015) · Gigascience · doi:10.1186/s13742-015-0047-8 · Cited by 12,709
METAL: fast and efficient meta-analysis of genomewide association scans
Willer, C. J., Li, Y., & Abecasis, G. R. (2010) · Bioinformatics · doi:10.1093/bioinformatics/btq340 · Cited by 5,205
The Genotype-Tissue Expression (GTEx) pilot analysis: Multitissue gene regulation in humans
The GTEx Consortium, Ardlie, K. G., Deluca, D. S., Segrè, A. V., Sullivan, T. J., Young, T. R., Gelfand, E. T., Trowbridge, C. A., Maller, J. B., Tukiainen, T., et al. (2015) · Science · doi:10.1126/science.1262110 · Cited by 5,062
Self-citationGiambartolomei, C., Vukcevic, D., Schadt, E. E., Franke, L., Hingorani, A. D., Wallace, C., & Plagnol, V. (2014) · PLoS Genetics · doi:10.1371/journal.pgen.1004383 · Cited by 4,261
A well-conditioned estimator for large-dimensional covariance matrices
Ledoit, O., & Wolf, M. (2004) · Journal of Multivariate Analysis · doi:10.1016/s0047-259x(03)00096-4 · Cited by 3,046 · cited 1×
“A common way to improve estimation of covariance matrices is to use regularization [38], replacing R̂ with R̂l, R̂l ≔ ð1 lÞR̂0 þ lI; ð23Þ”
Genetic Investigation of ANthropometric Traits (GIANT) Consortium, Yang, J., DIAbetes Genetics Replication And Meta-analysis (DIAGRAM) Consortium, Ferreira, T., Morris, A. P., Medland, S. E., Madden, P. A. F., Heath, A. C., Martin, N. G., Montgomery, G. W., et al. (2012) · Nature Genetics · doi:10.1038/ng.2213 · Cited by 1,712
High-Resolution Mapping of Expression-QTLs Yields Insight into Human Gene Regulation
Veyrieras, J.-B., Kudaravalli, S., Kim, S. Y., Dermitzakis, E. T., Gilad, Y., Stephens, M., & Pritchard, J. K. (2008) · PLoS Genetics · doi:10.1371/journal.pgen.1000214 · Cited by 536
Self-citation
Research works printed but not linked: 45
- A Hutchinson, 2020, Fine-mapping genetic associations, Human Molecular Genetics, 29, R81, 10.1093/hmg/ddaa148 · DOI
- JB Maller, 2012, Bayesian refinement of association signals for 14 loci in 3 common diseases, Nature Genetics, 44, 1294, 10.1038/ng.2435 · DOI
- Z Kote-Jarai, 2013, Fine-mapping identifies multiple prostate cancer risk loci at 5p15, one of which associates with TERT expression, Human Molecular Genetics, 22, 2520, 10.1093/hmg/ddt086 · DOI
- DJ Schaid, 2018, From genome-wide associations to candidate causal variants by statistical fine-mapping, Nature Reviews Genetics, 19, 491, 10.1038/s41576-018-0016-z · DOI
- SL Spain, 2015, Strategies for fine-mapping complex traits, Human Molecular Genetics, 24, R111, 10.1093/hmg/ddv260 · DOI
- PM Visscher, 2017, 10 years of GWAS discovery: biology, function, and translation, American Journal of Human Genetics, 101, 5, 10.1016/j.ajhg.2017.06.005 · DOI · Paper page
- F Hormozdiari, 2014, Identifying causal variants at loci with multiple signals of association, Genetics, 198, 497, 10.1534/genetics.114.167908 · DOI · Paper page
- G Kichaev, 2014, Integrating functional data to prioritize causal variants in statistical fine-mapping studies, PLoS Genetics, 10, e1004722, 10.1371/journal.pgen.1004722 · DOI
- B Servin, 2007, Imputation-based analysis of association studies: candidate regions and quantitative traits, PLoS Genetics, 3, e114, 10.1371/journal.pgen.0030114 · DOI
- W Chen, 2015, Fine mapping causal variants with an approximate Bayesian method using marginal test statistics, Genetics, 200, 719, 10.1534/genetics.115.176107 · DOI
- C Benner, 2016, FINEMAP: efficient variable selection using summary data from genome-wide association studies, Bioinformatics, 32, 1493, 10.1093/bioinformatics/btw018 · DOI · Paper page
- Y Li, 2016, Joint Bayesian inference of risk variants and tissue-specific epigenomic enrichments across multiple complex human diseases, Nucleic Acids Research, 44, e144, 10.1093/nar/gkw627 · DOI
- X Wen, 2016, Efficient integrative multi-SNP association analysis via deterministic approximation of posteriors, American Journal of Human Genetics, 98, 1114, 10.1016/j.ajhg.2016.03.029 · DOI
- PJ Newcombe, 2016, JAM: a scalable Bayesian framework for joint analysis of marginal SNP effects, Genetic Epidemiology, 40, 188, 10.1002/gepi.21953 · DOI
- Y Lee, 2018, Bayesian multi-SNP genetic association analysis: control of FDR and use of summary statistics, bioRxiv
- G Wang, 2020, A simple new approach to variable selection in regression, with application to genetic fine mapping, Journal of the Royal Statistical Society, Series B, 82, 1273, 10.1111/rssb.12388 · DOI · Paper page
- M Sesia, 2020, Multi-resolution localization of causal variants across the genome, Nature Communications, 11, 1093, 10.1038/s41467-020-14791-2 · DOI
- C Wallace, 2015, Dissection of a complex disease susceptibility region using a Bayesian stochastic search approach to fine mapping, PLoS Genetics, 11, e1005272, 10.1371/journal.pgen.1005272 · DOI
- A Hutchinson, 2020, Improving the coverage of credible sets in Bayesian genetic fine-mapping, PLoS Computational Biology, 16, e1007829, 10.1371/journal.pcbi.1007829 · DOI
- C Benner, 2018, Refining fine-mapping: effect sizes and regional heritability, bioRxiv
- B Pasaniuc, 2017, Dissecting the genetics of complex traits using summary association statistics, Nature Reviews Genetics, 18, 117, 10.1038/nrg.2016.142 · DOI
- X Zhu, 2017, Bayesian large-scale multiple regression with summary statistics from genome-wide association studies, Annals of Applied Statistics, 11, 1561
- analysis Initiative GBM, 2022, Meta-analysis fine-mapping is often miscalibrated at single-variant resolution, medRxiv
- Chipman H, George EI, McCulloch RE. The practical implementation of Bayesian model selection. In: Model Selection. vol. 38 of IMS Lecture Notes. Institute of Mathematical Statistics; 2001. p. 65–116. · DOI · Paper page
- JK Pickrell, 2014, Joint analysis of functional genomic data and genome-wide association studies of 18 human traits, American Journal of Human Genetics, 94, 559, 10.1016/j.ajhg.2014.03.004 · DOI
- C Benner, 2017, Prospects of fine-mapping trait-associated genomic regions by using summary statistics from genome-wide association studies, American Journal of Human Genetics, 101, 539, 10.1016/j.ajhg.2017.08.012 · DOI
- M Stephens, 2009, Bayesian statistical methods for genetic association studies, Nature Reviews Genetics, 10, 681, 10.1038/nrg2615 · DOI
- J Wakefield, 2009, Bayes factors for genome-wide association studies: comparison with P-values, Genetic Epidemiology, 33, 79, 10.1002/gepi.20359 · DOI
- Y Zou, 2021, Fine-mapping from summary data with the “Sum of Single Effects” model, bioRxiv
- JA Lozano, 2017, The multivariate normal distribution framework for analyzing association studies, bioRxiv
- Y Park, 2017, A Bayesian approach to mediation analysis predicts 206 causal target genes in Alzheimer’s disease, bioRxiv
- TSH Mak, 2017, Polygenic scores via penalized regression on summary statistics, Genetic Epidemiology, 41, 469, 10.1002/gepi.22050 · DOI
- B Pasaniuc, 2014, Fast and accurate imputation of summary statistics enhances evidence of functional enrichment, Bioinformatics, 30, 2906, 10.1093/bioinformatics/btu416 · DOI
- W Chen, 2021, Improved analyses of GWAS summary statistics by reducing data heterogeneity and errors, Nature Communications, 12, 7117, 10.1038/s41467-021-27438-7 · DOI
- D Lee, 2013, DIST: direct imputation of summary statistics for unmeasured SNPs, Bioinformatics, 29, 2925, 10.1093/bioinformatics/btt500 · DOI
- N LaPierre, 2020, Identifying causal variants by fine mapping across multiple studies, bioRxiv
- C Bycroft, 2018, The UK Biobank resource with deep phenotyping and genomic data, Nature, 562, 203, 10.1038/s41586-018-0579-z · DOI · Paper page
- Y Guan, 2011, Bayesian variable selection regression for genome-wide association studies and other large-scale problems, Annals of Applied Statistics, 5, 1780, 10.1214/11-AOAS455 · DOI
- W Bodmer, 2008, Common and rare variants in multifactorial susceptibility to common diseases, Nature Genetics, 40, 695, 10.1038/ng.f.136 · DOI · Paper page
- JPA Ioannidis, 2006, Implications of small effect sizes of individual genetic variants on the design and interpretation of genetic association studies of complex diseases, American Journal of Epidemiology, 164, 609, 10.1093/aje/kwj259 · DOI
- AN Barbeira, 2021, Exploiting the GTEx resources to decipher the mechanisms at GWAS loci, Genome Biology, 22, 49, 10.1186/s13059-020-02252-4 · DOI
- X Wen, 2015, Cross-population joint analysis of eQTLs: fine mapping and functional annotation, PLoS Genetics, 11, e1005176, 10.1371/journal.pgen.1005176 · DOI
- Z Zhu, 2016, Integration of summary data from GWAS and eQTL studies predicts complex trait gene targets, Nature Genetics, 48, 481, 10.1038/ng.3538 · DOI · Paper page
- B Han, 2009, Rapid and accurate multiple testing correction and power estimation for millions of correlated markers, PLoS Genetics, 5, e1000456, 10.1371/journal.pgen.1000456 · DOI
- M Pirinen, 2013, Efficient computation with a linear mixed model on large-scale data sets with applications to genetic studies, Annals of Applied Statistics, 7, 369, 10.1214/12-AOAS586 · DOI
Cited by
Sorted by citations
Diversity and scale: Genetic architecture of 2068 traits in the VA Million Veteran Program
Verma, A., Huffman, J. E., Rodriguez, A., Conery, M., Liu, M., Ho, Y.-L., Kim, Y., Heise, D. A., Guare, L., Panickan, V. A., et al. (2024) · Science · doi:10.1126/science.adj1182 · Cited by 463
“…of putative causal genetic variants that could be qualitatively and quantitatively compared across population groups, we performed within-population group fine-mapping using the Sum of Single Effects model implemented in SuSiE ( 18 , 19 ) followed by multipopulation credible set integration.”
Zuber, V., Grinberg, N. F., Gill, D., Manipur, I., Slob, E. A. W., Patel, A., Wallace, C., & Burgess, S. (2022) · The American Journal of Human Genetics · doi:10.1016/j.ajhg.2022.04.001 · Cited by 532
Nievergelt, C. M., Maihofer, A. X., Atkinson, E. G., Chen, C., Choi, K. W., Coleman, J. R. I., Daskalakis, N. P., Duncan, L. E., Polimanti, R. A., Aaronson, C. J., et al. (2024) · Nature Genetics · doi:10.1038/s41588-024-01707-9 · Cited by 234
“The SUSIE model assumed a maximum of two causal variants.”
InfluentialKarollus, A., Mauermeier, T., & Gagneur, J. (2023) · Genome Biology · doi:10.1186/s13059-023-02899-9 · Cited by 128
“A fine-mapping method was applied to associate each eQTL with a credible set of likely-causal variants and account for linkage (SuSie [25,26]).”
MethodA disease-associated gene desert directs macrophage inflammation through ETS2
Stankey, C. T., Bourges, C., Haag, L.-M., Turner‐Stokes, T., Piedade, A. P., Palmer-Jones, C., Papa, I., dos Santos, M. S., Zhang, Q., Cameron, A. J., et al. (2024) · Nature · doi:10.1038/s41586-024-07501-1 · Cited by 163
“IBD GWAS summary statistics 3 were used to perform multiple causal variant fine-mapping using susieR 51 , with reference minor allele and LD information calculated from 503 European samples from 1000 Genomes phase 3 (ref.”
Method
Metadata
- Authors
- Zou, Y., Carbonetto, P., Wang, G., & Stephens, M.
- Affiliations
- University of Chicago (US)
- Columbia University (US)
- Corresponding author
- Stephens, Matthew
- Venue
- PLOS Genetics
- Publisher
- Public Library of Science (PLoS)
- Published
- 2022-07-19
- Volume
- 18
- Issue
- 7
- Pages
- e1010299
- ISSN
- 1553-7390 (ISSN-L)
- 1553-7404
- PMC
- PMC9337707
- OpenAlex
- W4286218496
- Semantic Scholar
- 9397075def54e53ddb3d934e9e45679c4cdb0422
- Cited by
- 429
- References
- 52
- Citations by year
- 2026: 134 · 2025: 123 · 2024: 103 · 2023: 50 · 2022: 18
- FWCI
- 45.68
- Type
- journal article
- Language
- en
- Update notices
- new_version (2022-07-29)
- Open access
- gold
- doi.org
- Licence
- Locations
- PLoS Genetics (publishedVersion, cc-by)
- bioRxiv (Cold Spring Harbor Laboratory) (acceptedVersion, cc-by)
- PubMed Central (publishedVersion, cc-by)
- PubMed (publishedVersion)
- Knowledge@UChicago (University of Chicago) (submittedVersion, cc-by-nc-nd)
- RePEc: Research Papers in Economics (submittedVersion)
- DOAJ (DOAJ: Directory of Open Access Journals) (submittedVersion, cc-by-sa)
- University of Chicago (cc-by)
- Funders
- National Human Genome Research Institute (R01HG002585)
- Gordon and Betty Moore Foundation
- National Institute on Aging (U01AG072572)
- Thompson Family Foundation Initative (TAME-AD)
- Topics
- Life Sciences › Biochemistry, Genetics and Molecular Biology › Genetics › Genetic Associations and Epidemiology
- Life Sciences › Biochemistry, Genetics and Molecular Biology › Genetics › Genetic Mapping and Diversity in Plants and Animals
- Life Sciences › Biochemistry, Genetics and Molecular Biology › Genetics › Genetic and phenotypic traits in livestock
- Keywords
- fine mapping, summary data, linkage disequilibrium, caviar, model fitting, model refinement, genetic association studies
- MeSH terms
- Models, Genetic, Reproducibility of Results, Linkage Disequilibrium, Likelihood Functions, Polymorphism, Single Nucleotide
About these checks
Registry, retraction, Cites and statistics results are computed, not judged, with one exception: a printed reference that no index lists is read once by a model before it counts as a citation error. Claims are extracted by a model and kept only when their quote appears verbatim in the text; each cited source is then checked, with a model’s help, for whether it says what the claim relies on. Those verdicts can be wrong — read the claim’s quote and the cited source before relying on one.
Statistics and arithmetic are recomputed, not judged.
Confidence bands are shown only for fields calibrated on our annotated test set. None is calibrated yet, so no band is shown.
What counts as a claim ›How we measure confidence ›How we check this ›
Are you an author, or do you see a problem with this page? Request a review
