

The DOI matches its Crossref record; 78 of the 78 references it cites were found in a registry or an index.
Queuosine biosynthetic enzyme, QueE moonlights as a cell division regulator
Open accessPublished version of a preprint
Abstract
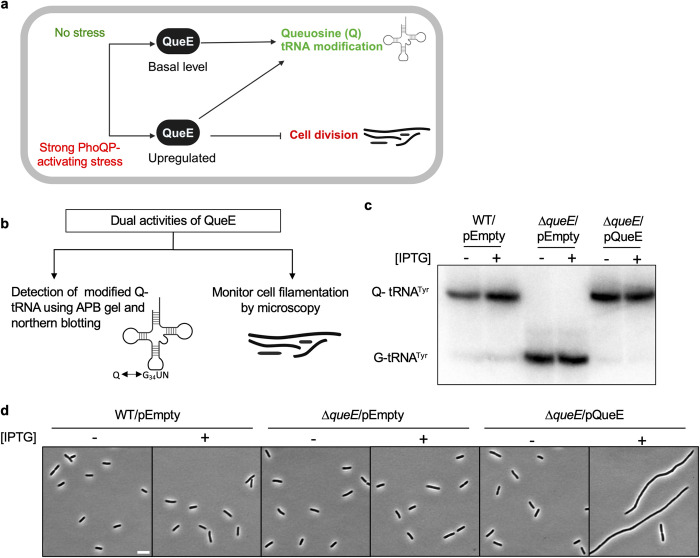
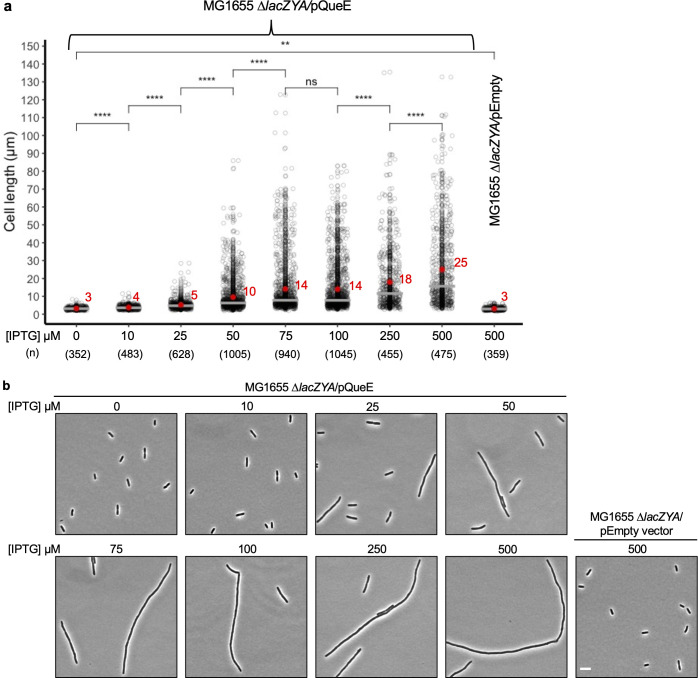
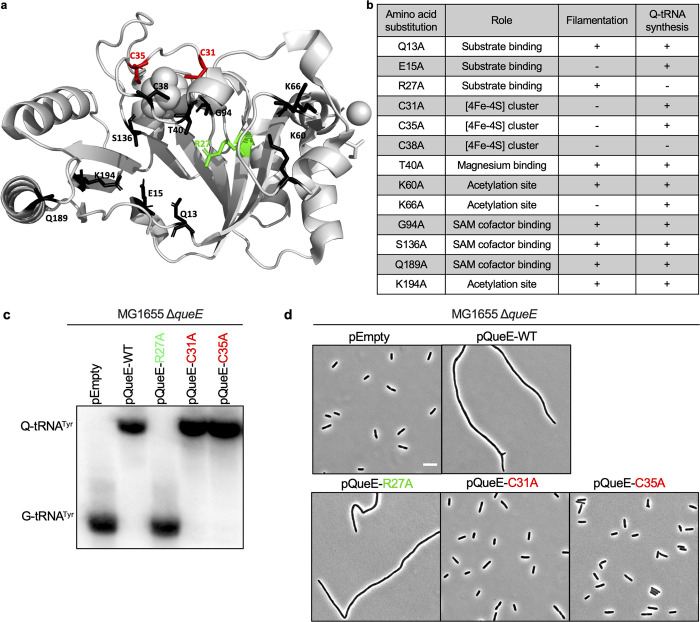
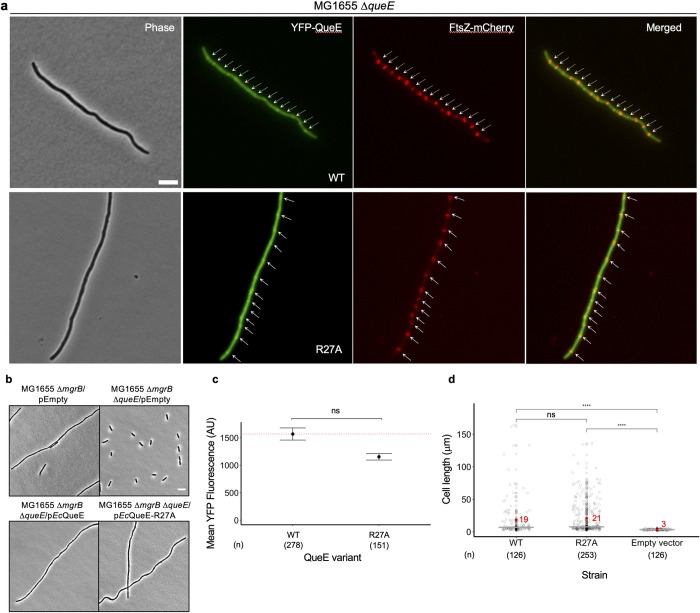
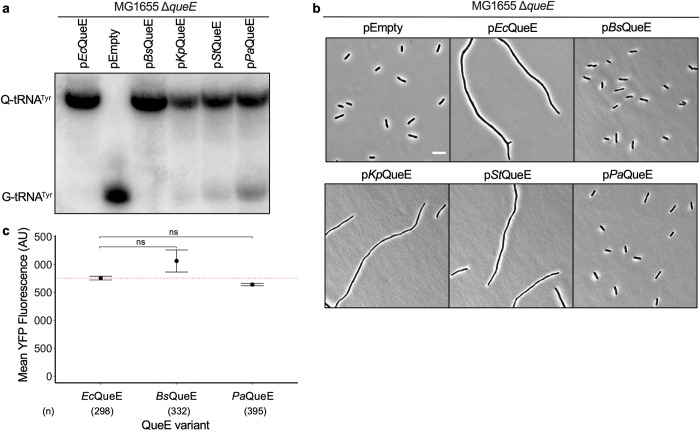
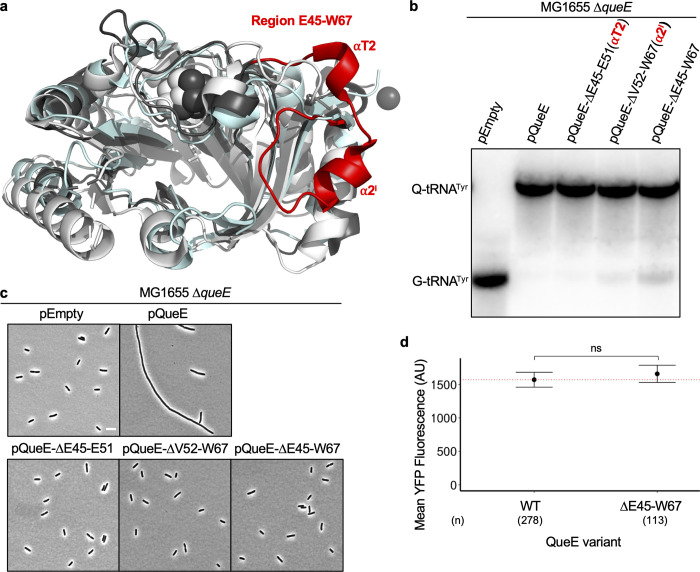
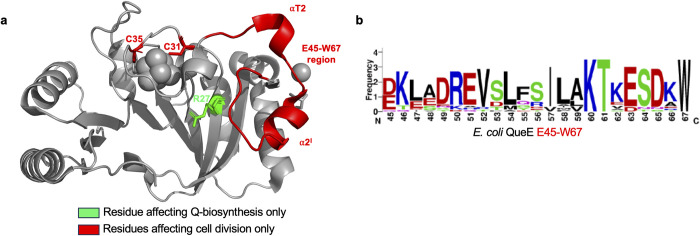
In many organisms, stress responses to adverse environments can trigger secondary functions of certain proteins by altering protein levels, localization, activity, or interaction partners. Escherichia coli cells respond to the presence of specific cationic antimicrobial peptides by strongly activating the PhoQ/PhoP two-component signaling system, which regulates genes important for growth under this stress. As part of this pathway, a biosynthetic enzyme called QueE, which catalyzes a step in the formation of queuosine (Q) tRNA modification is upregulated. When cellular QueE levels are high, it co-localizes with the central cell division protein FtsZ at the septal site, blocking division and resulting in filamentous growth. Here we show that QueE affects cell size in a dose-dependent manner. Using alanine scanning mutagenesis of amino acids in the catalytic active site, we pinpoint residues in QueE that contribute distinctly to each of its functions–Q biosynthesis or regulation of cell division, establishing QueE as a moonlighting protein. We further show that QueE orthologs from enterobacteria like Salmonella typhimurium and Klebsiella pneumoniae also cause filamentation in these organisms, but the more distant counterparts from Pseudomonas aeruginosa and Bacillus subtilis lack this ability. By comparative analysis of E . coli QueE with distant orthologs, we elucidate a unique region in this protein that is responsible for QueE’s secondary function as a cell division regulator. A dual-function protein like QueE is an exception to the conventional model of “one gene, one enzyme, one function”, which has divergent roles across a range of fundamental cellular processes including RNA modification and translation to cell division and stress response.
Overview
The claims and statistics of this paper haven’t been checked yet.
Run the check — free, no account needed. It reads the open-access text and checks the sources it cites.
Integrity signals
Registry
Cites
Statistics
Figures
Verification
Claims the paper makes
The claims and statistics of this paper haven’t been checked yet.
Run the check — free, no account needed. It reads the open-access text and checks the sources it cites.
Self-check
Percentages, sums and reported differences re-computed from the paper’s own numbers.
The self-check needs the paper’s full text.
Citations
Cites
NIH Image to ImageJ: 25 years of image analysis
Schneider, C. A., Rasband, W. S., & Eliceiri, K. W. (2012) · Nature Methods · doi:10.1038/nmeth.2089 · Cited by 64,638
Highly accurate protein structure prediction with AlphaFold
Jumper, J., Evans, R., Pritzel, A., Green, T., Figurnov, M., Ronneberger, O., Tunyasuvunakool, K., Bates, R., Žídek, A., Potapenko, A., et al. (2021) · Nature · doi:10.1038/s41586-021-03819-2 · Cited by 43,764
Fast, scalable generation of high‐quality protein multiple sequence alignments using Clustal Omega
Sievers, F., Wilm, A., Dineen, D., Gibson, T. J., Karplus, K., Li, W., Lopez, R., McWilliam, H., Remmert, M., Söding, J., et al. (2011) · Molecular Systems Biology · doi:10.1038/msb.2011.75 · Cited by 15,355
WebLogo: A Sequence Logo Generator: Figure 1
Crooks, G. E., Hon, G., Chandonia, J.-M., & Brenner, S. E. (2004) · Genome Research · doi:10.1101/gr.849004 · Cited by 12,386
Jalview Version 2—a multiple sequence alignment editor and analysis workbench
Waterhouse, A. M., Procter, J. B., Martin, D. M. A., Clamp, M., & Barton, G. J. (2009) · Bioinformatics · doi:10.1093/bioinformatics/btp033 · Cited by 10,235
Varadi, M., Anyango, S., Deshpande, M., Nair, S., Natassia, C., Yordanova, G., Yuan, D., Stroe, O., Wood, G., Laydon, A., et al. (2022) · Nucleic Acids Research · doi:10.1093/nar/gkab1061 · Cited by 7,850
Sequence logos: a new way to display consensus sequences
Schneider, T. D., & Stephens, R. M. (1990) · Nucleic Acids Research · doi:10.1093/nar/18.20.6097 · Cited by 3,378
Search and sequence analysis tools services from EMBL-EBI in 2022
Madeira, F., Pearce, M., Tivey, A. R., Basutkar, P., Lee, J., Edbali, O., Madhusoodanan, N., Kolesnikov, A., & López, R. (2022) · Nucleic Acids Research · doi:10.1093/nar/gkac240 · Cited by 2,271
A new bioinformatics analysis tools framework at EMBL-EBI
Goujon, M., McWilliam, H., Li, W., Valentin, F., Squizzato, S., Paern, J., & Lopez, R. (2010) · Nucleic Acids Research · doi:10.1093/nar/gkq313 · Cited by 1,846
Purification of RNA Using TRIzol (TRI Reagent)Preprint
Rio, D. C., Ares, M., Hannon, G. J., & Nilsen, T. W. (2010) · Cold Spring Harbor Protocols · doi:10.1101/pdb.prot5439 · Cited by 1,797
Bullock, W. O. (1987) · Medical Entomology and Zoology · Cited by 1,149
Amann, E. P., Ochs, B., & Kj, A. (1988) · Gene · doi:10.1016/0378-1119(88)90440-4 · Cited by 1,045
MicrobeJ, a tool for high throughput bacterial cell detection and quantitative analysis
Ducret, A., Quardokus, E. M., & Brun, Y. V. (2016) · Nature Microbiology · doi:10.1038/nmicrobiol.2016.77 · Cited by 1,010
The Pleiotropic Two-Component Regulatory System PhoP-PhoQ
Groisman, E. A. (2001) · Journal of Bacteriology · doi:10.1128/jb.183.6.1835-1842.2001 · Cited by 887
Regulation of endospore formation in Bacillus subtilis
Errington, J. (2003) · Nature Reviews Microbiology · doi:10.1038/nrmicro750 · Cited by 698
FtsZ and the division of prokaryotic cells and organelles
Margolin, W. (2005) · Nature Reviews Molecular Cell Biology · doi:10.1038/nrm1745 · Cited by 631
Morphological plasticity as a bacterial survival strategy
Justice, S. S., Hunstad, D. A., Cegelski, L., & Hultgren, S. J. (2008) · Nature Reviews Microbiology · doi:10.1038/nrmicro1820 · Cited by 600
Bernhardt, T. G., & de Boer, P. A. J. (2005) · Molecular Cell · doi:10.1016/j.molcel.2005.04.012 · Cited by 522
Is H3K4me3 instructive for transcription activation?
Howe, F. S., Fischl, H., Murray, S. C., & Mellor, J. (2017) · BioEssays · doi:10.1002/bies.201600095 · Cited by 513
Wu, L. J., & Errington, J. (2004) · Cell · doi:10.1016/j.cell.2004.06.002 · Cited by 412
The physiology of bacterial cell division
Egan, A. J. F., & Vollmer, W. (2013) · Annals of the New York Academy of Sciences · doi:10.1111/j.1749-6632.2012.06818.x · Cited by 320
Kuhn, M. L., Zemaitaitis, B., Hu, L. I., Sahu, A., Sorensen, D., Minasov, G., Lima, B. P., Scholle, M., Mrksich, M., Anderson, W. F., et al. (2014) · PLoS ONE · doi:10.1371/journal.pone.0094816 · Cited by 268
Feedback Control of Two-Component Regulatory Systems
Groisman, E. A. (2016) · Annual Review of Microbiology · doi:10.1146/annurev-micro-102215-095331 · Cited by 254
Inhibition of FtsZ polymerization by SulA, an inhibitor of septation in Escherichia coli
Mukherjee, A., Cao, C., & Lutkenhaus, J. (1998) · Proceedings of the National Academy of Sciences · doi:10.1073/pnas.95.6.2885 · Cited by 247
Feedback Inhibition in the PhoQ/PhoP Signaling System by a Membrane Peptide
Lippa, A. M., & Goulian, M. (2009) · PLoS Genetics · doi:10.1371/journal.pgen.1000788 · Cited by 240
Keseler, I. M., Gama‐Castro, S., Mackie, A. M., Billington, R., Bonavides-Martínez, C., Caspi, R., Kothari, A., Krummenacker, M., Midford, P. E., Muñiz-Rascado, L., et al. (2021) · Frontiers in Microbiology · doi:10.3389/fmicb.2021.711077 · Cited by 218
Bacterial Cell Division: The Mechanism and Its Precison
Harry, E. J., Monahan, L. G., & Thompson, L. S. (2006) · International review of cytology · doi:10.1016/s0074-7696(06)53002-5 · Cited by 215
A Moonlighting Enzyme Links Escherichia coli Cell Size with Central Metabolism
Hill, N. S., Buske, P. J., Shi, Y., & Levin, P. A. (2013) · PLoS Genetics · doi:10.1371/journal.pgen.1003663 · Cited by 202
Queuosine‐modified tRNAs confer nutritional control of protein translation
Tuorto, F., Legrand, C., Cirzi, C., Federico, G., Liebers, R., Müller, M., Ehrenhofer‐Murray, A. E., Dittmar, G. A. G., Gröne, H., & Lyko, F. (2018) · The EMBO Journal · doi:10.15252/embj.201899777 · Cited by 201
FtsZ ring in bacterial cytokinesis
Lutkenhaus, J. (1993) · Molecular Microbiology · doi:10.1111/j.1365-2958.1993.tb01701.x · Cited by 200
FtsZ Dynamics during the Division Cycle of Live Escherichia coli Cells
Sun, Q., & Margolin, W. (1998) · Journal of Bacteriology · doi:10.1128/jb.180.8.2050-2056.1998 · Cited by 197
Molecular mechanism by which the nucleoid occlusion factor, SlmA, keeps cytokinesis in check
Tonthat, N. K., Arold, S. T., Pickering, B. F., Dyke, M. W. V., Liang, S., Lu, Y., Beuria, T. K., Margolin, W., & Schumacher, M. A. (2010) · The EMBO Journal · doi:10.1038/emboj.2010.288 · Cited by 184
Small but Mighty: Cell Size and BacteriaPreprint
Levin, P. A., & Angert, E. R. (2015) · Cold Spring Harbor Perspectives in Biology · doi:10.1101/cshperspect.a019216 · Cited by 176
The Queuine Micronutrient: Charting a Course from Microbe to Man
Fergus, C., Barnes, D., Alqasem, M. A., & Kelly, V. P. (2015) · Nutrients · doi:10.3390/nu7042897 · Cited by 172
Protein acetylation dynamics in response to carbon overflow in E scherichia coli
Schilling, B., Christensen, D. G., Davis, R., Sahu, A. K., Hu, L. I., Walker‐Peddakotla, A., Sorensen, D. J., Zemaitaitis, B. W., Gibson, B. W., & Wolfe, A. J. (2015) · Molecular Microbiology · doi:10.1111/mmi.13161 · Cited by 161
Noc protein binds to specific DNA sequences to coordinate cell division with chromosome segregation
Wu, L. J., Ishikawa, S., Kawai, Y., et al. (2009) · The EMBO Journal · doi:10.1038/emboj.2009.144 · Cited by 159
Identification of Four Genes Necessary for Biosynthesis of the Modified Nucleoside Queuosine
Reader, J. S., Metzgar, D., SCHIMMEL, P. R., & de Crécy‐Lagard, V. (2004) · Journal of Biological Chemistry · doi:10.1074/jbc.m310858200 · Cited by 158
The keepers of the ring: regulators of FtsZ assembly
Ortiz, C., Natale, P., Cueto, L., & Vicente, M. (2015) · FEMS Microbiology Reviews · doi:10.1093/femsre/fuv040 · Cited by 156
Singh, N., & Bhalla, N. (2020) · Annual Review of Genetics · doi:10.1146/annurev-genet-030620-102906 · Cited by 155
Bacterial Moonlighting Proteins and Bacterial Virulence
Henderson, B. E., & Martin, A. C. R. (2011) · Current topics in microbiology and immunology · doi:10.1007/82_2011_188 · Cited by 152
Protein Acetylation in Bacteria
VanDrisse, C. M., & Escalante‐Semerena, J. C. (2019) · Annual Review of Microbiology · doi:10.1146/annurev-micro-020518-115526 · Cited by 151
Structure, Biosynthesis, and Function of Queuosine in Transfer RNA
Nishimura, S. (1983) · Progress in nucleic acid research and molecular biology · doi:10.1016/s0079-6603(08)60082-3 · Cited by 149
An introduction to protein moonlighting
Jeffery, C. J. (2014) · Biochemical Society Transactions · doi:10.1042/bst20140226 · Cited by 140
Transformation Proteins and DNA Uptake Localize to the Cell Poles in Bacillus subtilis
Hahn, J., Maier, B., Haijema, B. J., Sheetz, M. P., & Dubnau, D. A. (2005) · Cell · doi:10.1016/j.cell.2005.04.035 · Cited by 135
Morphological plasticity promotes resistance to phagocyte killing of uropathogenic Escherichia coli
Horvath, D. J., Li, B., Casper, T., Partida‐Sánchez, S., Hunstad, D. A., Hultgren, S. J., & Justice, S. S. (2010) · Microbes and Infection · doi:10.1016/j.micinf.2010.12.004 · Cited by 128
Strong FtsZ is with the force: mechanisms to constrict bacteria
Mingorance, J., Rivas, G., Vélez, M., Gómez‐Puertas, P., & Vicente, M. (2010) · Trends in Microbiology · doi:10.1016/j.tim.2010.06.001 · Cited by 125
NanoRNAs Prime Transcription Initiation In Vivo
Goldman, S. R., Sharp, J. S., Vvedenskaya, I. O., Livny, J., Dove, S. L., & Nickels, B. E. (2011) · Molecular Cell · doi:10.1016/j.molcel.2011.06.005 · Cited by 123
McCarty, R. M., Somogyi, Á., Lin, G., Jacobsen, N. E., & Bandarian, V. (2009) · Biochemistry · doi:10.1021/bi900400e · Cited by 110
Galli, E., & Gerdes, K. (2010) · Molecular Microbiology · doi:10.1111/j.1365-2958.2010.07183.x · Cited by 110
Identification of Novel Protein Lysine Acetyltransferases in Escherichia coli
Christensen, D. G., Meyer, J. G., Baumgartner, J. T., D’Souza, A. K., Nelson, W. C., Payne, S., Kuhn, M. L., Schilling, B., & Wolfe, A. J. (2018) · mBio · doi:10.1128/mbio.01905-18 · Cited by 110
Miles, Z. D., McCarty, R. M., Molnar, G., & Bandarian, V. (2011) · Proceedings of the National Academy of Sciences · doi:10.1073/pnas.1018636108 · Cited by 104
Queuosine modification of tRNA: its divergent role in cellular machinery
Vinayak, M., & Pathak, C. (2009) · Bioscience Reports · doi:10.1042/bsr20090057 · Cited by 101
Intracellular proteins moonlighting as bacterial adhesion factors
Jeffery, C. J. (2018) · AIMS Microbiology · doi:10.3934/microbiol.2018.2.362 · Cited by 98
Queuine links translational control in eukaryotes to a micronutrient from bacteria
Müller, M., Legrand, C., Tuorto, F., Kelly, V. P., Atlasi, Y., Lyko, F., & Ehrenhofer‐Murray, A. E. (2019) · Nucleic Acids Research · doi:10.1093/nar/gkz063 · Cited by 97
Justice, S. S., García-Lara, J., & Rothfield, L. I. (2000) · Molecular Microbiology · doi:10.1046/j.1365-2958.2000.02007.x · Cited by 92
Filament formation by foodborne bacteria under sublethal stress
Jones, T. H., Vail, K. M., & McMullen, L. M. (2013) · International Journal of Food Microbiology · doi:10.1016/j.ijfoodmicro.2013.05.001 · Cited by 71
Yadavalli, S. S., Carey, J. N., Leibman, R. S., Chen, A. I., Stern, A. M., Roggiani, M., Lippa, A. M., & Goulian, M. (2016) · Nature Communications · doi:10.1038/ncomms12340 · Cited by 71
Self-citationMcCarty, R. M., Krebs, C., & Bandarian, V. (2012) · Biochemistry · doi:10.1021/bi301156w · Cited by 69
Regulation of Cell Division in Bacteria by Monitoring Genome Integrity and DNA Replication Status
Burby, P. E., & Simmons, L. A. (2019) · Journal of Bacteriology · doi:10.1128/jb.00408-19 · Cited by 66
An overview of protein moonlighting in bacterial infection
Henderson, B. (2014) · Biochemical Society Transactions · doi:10.1042/bst20140236 · Cited by 63
Beyond force generation: Why is a dynamic ring of FtsZ polymers essential for bacterial cytokinesis?
Coltharp, C., & Xiao, J. (2016) · BioEssays · doi:10.1002/bies.201600179 · Cited by 53
Chien, A., Zareh, S. K., Wang, Y. M., & Levin, P. A. (2012) · Molecular Microbiology · doi:10.1111/mmi.12007 · Cited by 50
Functional Determinants of a Small Protein Controlling a Broadly Conserved Bacterial Sensor Kinase
Yadavalli, S. S., Goh, T., Carey, J. N., Malengo, G., Vellappan, S., Nickels, B. E., Sourjik, V., Goulian, M., & Yuan, J. (2020) · Journal of Bacteriology · doi:10.1128/jb.00305-20 · Cited by 42
Self-citationThe secretion ATPase ComGA is required for the binding and transport of transforming DNA
Briley, K., Dorsey‐Oresto, A., Prepiak, P., Dias, M. J., Mann, J. M., & Dubnau, D. A. (2011) · Molecular Microbiology · doi:10.1111/j.1365-2958.2011.07730.x · Cited by 41
Hayes, P., Fergus, C., Ghanim, M., Cirzi, C., Burtnyak, L., McGrenaghan, C. J., Tuorto, F., Nolan, D. P., & Kelly, V. P. (2020) · Nutrients · doi:10.3390/nu12030871 · Cited by 36
Chapter 2 Biosynthesis and Function of Queuine and Queuosine tRNAs
Kersten, H., & Kersten, W. (1990) · Journal of chromatography library · doi:10.1016/s0301-4770(08)61488-8 · Cited by 35
Emerging roles of tRNA in cancer
Ren, D., Mo, Y., Yang, M., Wang, D., Wang, Y., Yan, Q., Guo, C. J., Xiong, W., Wang, F., & Zeng, Z. (2023) · Cancer Letters · doi:10.1016/j.canlet.2023.216170 · Cited by 35
7-Carboxy-7-deazaguanine Synthase: A Radical S -Adenosyl- l -methionine Enzyme with Polar Tendencies
Bruender, N. A., Grell, T. A. J., Dowling, D., McCarty, R. M., Drennan, C. L., & Bandarian, V. (2017) · Journal of the American Chemical Society · doi:10.1021/jacs.6b11381 · Cited by 32
Regulation of cytokinesis: FtsZ and its accessory proteins
Wang, M., Fang, C., Ma, B., Luo, X.-X., & Hou, Z. (2019) · Current Genetics · doi:10.1007/s00294-019-01005-6 · Cited by 31
Bacterial filamentation during urinary tract infections
Abell-King, C., Costas, A., Duggin, I. G., & Söderström, B. (2022) · PLoS Pathogens · doi:10.1371/journal.ppat.1010950 · Cited by 18
Rao, S. D., & Igoshin, O. A. (2021) · PLoS Computational Biology · doi:10.1371/journal.pcbi.1008130 · Cited by 16
An unexpected absence of queuosine modification in the tRNAs of an Escherichia coli B strain
Dineshkumar, T. K., Thanedar, S., Subbulakshmi, C., & Varshney, U. (2002) · Microbiology · doi:10.1099/00221287-148-12-3779 · Cited by 15
Tubulin and its Prokaryotic Homologue FtsZ: A Structural and Functional Comparison
Dyer, N. P. (2009) · Science Progress · doi:10.3184/003685009x461431 · Cited by 13
Crystal structure of QueE from Escherichia coli
Grell, T. A. J., Bell, B. N., Nguyen, C., Dowling, D., & Drennan, C. L. (2018) · Worldwide Protein Data Bank · doi:10.2210/pdb6nhl/pdb · Cited by 13
QueE: A Radical SAM Enzyme Involved in the Biosynthesis of 7-Deazapurine Containing Natural Products
Lewis, J. K., Bruender, N. A., & Bandarian, V. (2018) · Methods in enzymology on CD-ROM/Methods in enzymology · doi:10.1016/bs.mie.2018.05.001 · Cited by 10
Journal of Chromatography Library
(1989) · Journal of chromatography library · doi:10.1016/s0301-4770(08)61587-0 · Cited by 9
Matuszek, Ż., & Pan, T. (2019) · BIO-PROTOCOL · doi:10.21769/bioprotoc.3191 · Cited by 7
Metadata
- Authors
- Adeleye, S. A., & Yadavalli, S. S.
- Affiliations
- Rutgers, The State University of New Jersey (US)
- Corresponding author
- Yadavalli, Srujana S.
- Venue
- PLOS Genetics
- Publisher
- Public Library of Science (PLoS)
- Published
- 2024-05-20
- Volume
- 20
- Issue
- 5
- Pages
- e1011287
- ISSN
- 1553-7390 (ISSN-L)
- 1553-7404
- PMC
- PMC11142719
- OpenAlex
- W4398145788
- Cited by
- 10
- References
- 78
- Citations by year
- 2026: 4 · 2025: 6
- FWCI
- 2.65
- Type
- journal article
- Language
- en
- Update notices
- new_version (2024-05-31)
- Open access
- gold
- doi.org
- Licence
- Locations
- PLoS Genetics (publishedVersion, cc-by)
- bioRxiv (Cold Spring Harbor Laboratory) (acceptedVersion)
- PubMed Central (publishedVersion, cc-by)
- PubMed (publishedVersion)
- PubMed Central (submittedVersion)
- DOAJ (DOAJ: Directory of Open Access Journals) (submittedVersion)
- Funders
- National Institute of General Medical Sciences (R35 GM147566)
- Rutgers, The State University of New Jersey (Institutional start-up funds, Waksman Institute Busch Predoctoral Fellowship)
- Topics
- Life Sciences › Biochemistry, Genetics and Molecular Biology › Genetics › Bacterial Genetics and Biotechnology
- Life Sciences › Biochemistry, Genetics and Molecular Biology › Molecular Biology › RNA and protein synthesis mechanisms
- Life Sciences › Biochemistry, Genetics and Molecular Biology › Molecular Biology › Biochemical and Molecular Research
- Keywords
- queuosine biosynthesis, moonlighting proteins, cell division regulation, FtsZ, filamentous growth, tRNA modification, antimicrobial peptides, cell size control, Escherichia coli, Salmonella typhimurium, Klebsiella pneumoniae, Pseudomonas aeruginosa, Bacillus subtilis, enzyme active site residues
About these checks
Registry, retraction, Cites and statistics results are computed, not judged, with one exception: a printed reference that no index lists is read once by a model before it counts as a citation error. Claims are extracted by a model and kept only when their quote appears verbatim in the text; each cited source is then checked, with a model’s help, for whether it says what the claim relies on. Those verdicts can be wrong — read the claim’s quote and the cited source before relying on one.
Statistics and arithmetic are recomputed, not judged.
Confidence bands are shown only for fields calibrated on our annotated test set. None is calibrated yet, so no band is shown.
What counts as a claim ›How we measure confidence ›How we check this ›
Are you an author, or do you see a problem with this page? Request a review
Data sources
Bibliographic data: Semantic Scholar, OpenAlex, Crossref.
Contains information from the Semantic Scholar Academic Graph Datasets, made available under the ODC Attribution License (ODC-BY 1.0).
Semantic Scholar’s data is described in: Kinney, R., et al. (2023). The Semantic Scholar Open Data Platform. arXiv:2301.10140.
