

What Can We Conclude from Death Registration? Improved Methods for Evaluating Completeness
Open accessThe DOI matches its Crossref record; 38 of the 40 references it cites were found in a registry or an index.
Abstract
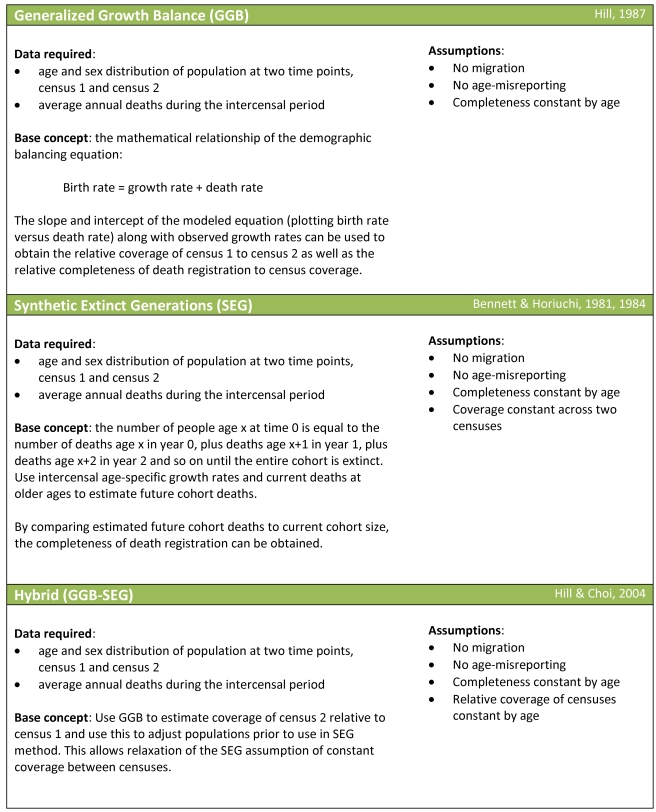
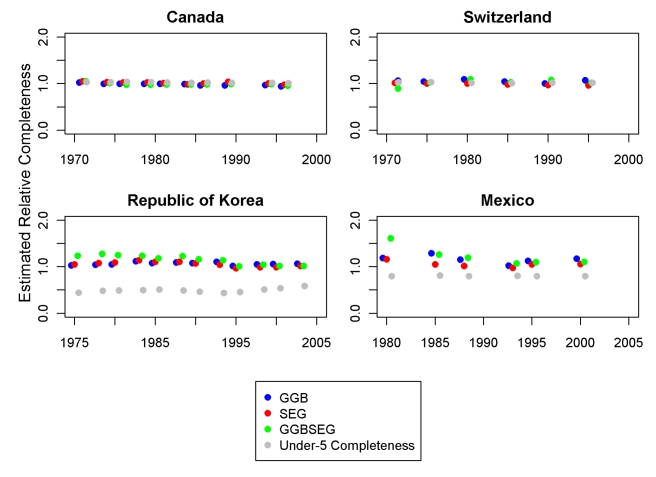
BACKGROUND: One of the fundamental building blocks for determining the burden of disease in populations is to reliably measure the level and pattern of mortality by age and sex. Where well-functioning registration systems exist, this task is relatively straightforward. Results from many civil registration systems, however, remain uncertain because of a lack of confidence in the completeness of death registration. Incomplete registration systems mean not all deaths are counted, and resulting estimates of death rates for the population are then underestimated. Death distribution methods (DDMs) are a suite of demographic methods that attempt to estimate the fraction of deaths that are registered and counted by the civil registration system. Although widely applied and used, the methods have at least three types of limitations. First, a wide range of variants of these methods has been applied in practice with little scientific literature to guide their selection. Second, the methods have not been extensively validated in real population conditions where violations of the assumptions of the methods most certainly occur. Third, DDMs do not generate uncertainty intervals. METHODS AND FINDINGS: In this paper, we systematically evaluate the performance of 234 variants of DDM methods in three different validation environments where we know or have strong beliefs about the true level of completeness of death registration. Using these datasets, we identify three variants of the DDMs that generally perform the best. We also find that even these improved methods yield uncertainty intervals of roughly +/- one-quarter of the estimate. Finally, we demonstrate the application of the optimal variants in eight countries. CONCLUSIONS: There continues to be a role for partial vital registration data in measuring adult mortality levels and trends, but such results should only be interpreted alongside all other data sources on adult mortality and the uncertainty of the resulting levels, trends, and age-patterns of adult death considered. Please see later in the article for the Editors' Summary.
Overview
The claims and statistics of this paper haven’t been checked yet.
Free: it reads the open-access text and checks the first 5 claims that cite a source we can check. Create a free account to check every claim.
Integrity signals
Registry
Cites
Statistics
Figures



Verification
Claims the paper makes
The claims and statistics of this paper haven’t been checked yet.
Free: it reads the open-access text and checks the first 5 claims that cite a source we can check. Create a free account to check every claim.
Claims other papers make about this one
Each is checked against this paper’s own text: does it say what the citing paper says it does?
The cited source says what the claim attributes to it.
In the citing paper
“For the GBD 2010, we assessed the completeness of vital registration or sample registration data over age 5 years using the most accurate variants of death distribution methods: synthetic extinct generations, the generalised growth balance method, and a hybrid of the two.46”
Self-check
Percentages, sums and reported differences re-computed from the paper’s own numbers.
The self-check needs the paper’s full text.
Citations
Cites
World Population Prospects The 2006 Revision
Zlotnik, H. (2007) · United Nations eBooks · Cited by 7,970
The World Health report 2006 1 : Working together for health 2
Guilbert, J.-J. (2006) · Education for Health: Change in Learning & Practice · doi:10.1080/13576280600937911 · Cited by 2,654
(2005) · Europe PMC (PubMed Central) · Cited by 1,975
Kobayashi, S., Oh, S.-I., & Altan, T. (1989) · Metal Forming and the Finite-Element Method · doi:10.1093/oso/9780195044027.003.0008 · Cited by 1,687
Integrated Public Use Microdata Series
Ruggles, S., Genadek, K., Goeken, R., Grover, J., & Sobek, M. (2015) · Institute for Social Research and Data Innovation · doi:10.18128/d010.v6.0 · Cited by 1,485
Murray, C. J. L., Kulkarni, S. C., Michaud, C., Tomijima, N., Bulzacchelli, M. T., Iandiorio, T. J., & Ezzati, M. (2006) · PLoS Medicine · doi:10.1371/journal.pmed.0030260 · Cited by 762 · cited 1×
“We use the 2,072 counties or merged county units developed to assure a minimum population size in each aggregate [28–30].”
Self-citationCapture-Recapture Methods in Epidemiology: Methods and Limitations
Hook, E. B., & Regal, R. R. (1995) · Epidemiologic Reviews · doi:10.1093/oxfordjournals.epirev.a036192 · Cited by 731 · cited 1×
“A second strategy would be to apply capturerecapture or dual-record methods [40,41] to civil registration deaths and deaths reported by households in a time period prior to a survey or census.”
Civil registration systems and vital statistics: successes and missed opportunities
Mahapatra, P., Shibuya, K., Lopez, A. D., Coullare, F., Notzon, F. C., Rao, C., & Szreter, S. (2007) · The Lancet · doi:10.1016/s0140-6736(07)61308-7 · Cited by 352 · cited 1×
“Over 50 developing countries annually report death statistics to the World Health Organization (WHO) or the United Nations Statistics Division [3,4].”
Ezzati, M., Friedman, A. B., Kulkarni, S. C., & Murray, C. J. L. (2008) · PLoS Medicine · doi:10.1371/journal.pmed.0050066 · Cited by 346 · cited 1×
“We use the 2,072 counties or merged county units developed to assure a minimum population size in each aggregate [28–30].”
Self-citationMortality registration and surveillance in China: History, current situation and challenges
Yang, G., Hu, J., Rao, K. Q., Ma, J., Rao, C., & Lopez, A. D. (2005) · Population Health Metrics · doi:10.1186/1478-7954-3-3 · Cited by 341
Cited by
Lozano, R., Naghavi, M., Foreman, K., Lim, S., Shibuya, K., Aboyans, V., Abraham, J., Adair, T., Aggarwal, R., Ahn, S. Y., et al. (2012) · The Lancet · doi:10.1016/s0140-6736(12)61728-0 · Cited by 14,070
Wang, H., Naghavi, M., Allen, C., Barber, R. M., Bhutta, Z. A., Carter, A., Casey, D. C., Charlson, F. J., Chen, A. Z., Coates, M. M., et al. (2016) · The Lancet · doi:10.1016/s0140-6736(16)31012-1 · Cited by 6,596
Self-citationWang, H., Abbas, K. M., Abbasifard, M., Abbasi-Kangevari, M., Abbastabar, H., Abd-Allah, F., Abdelalim, A., Abolhassani, H., Abreu, L. G., Abrigo, M. R. M., et al. (2020) · The Lancet · doi:10.1016/s0140-6736(20)30977-6 · Cited by 1,971
“…classic DDMs, especially in settings with migration and age misreporting, we used five different methods to assess completeness, three of which—the generalised growth balance method (GGB), the synthetic extinct generations (SEG) method, and a combined method (GGB-SEG) 16 —had been previously used.”
InfluentialGlobal malaria mortality between 1980 and 2010: a systematic analysis
Murray, C. J., Rosenfeld, L. C., Lim, S. S., Andrews, K. G., Foreman, K. J., Haring, D., Fullman, N., Naghavi, M., Lozano, R., & Lopez, A. D. (2012) · The Lancet · doi:10.1016/s0140-6736(12)60034-8 · Cited by 1,452
Self-citation
Metadata
- Authors
- Murray, C. J. L., Rajaratnam, J. K., Marcus, J., Laakso, T., & Lopez, A. D.
- Affiliations
- University of Washington (US)
- Harvard University (US)
- Corresponding author
- Rajaratnam, Julie Knoll
- Venue
- PLoS Medicine
- Publisher
- Public Library of Science (PLoS)
- Published
- 2010-04-13
- Volume
- 7
- Issue
- 4
- Pages
- e1000262
- ISSN
- 1549-1277 (ISSN-L)
- 1549-1676
- PMC
- PMC2854130
- OpenAlex
- W1983782640
- Cited by
- 131
- References
- 40
- Citations by year
- 2026: 2 · 2025: 4 · 2024: 7 · 2023: 4 · 2022: 6 · 2021: 7 · 2020: 12 · 2019: 11 · 2018: 5 · 2017: 14 · 2016: 6 · 2015: 11 · 2014: 11 · 2013: 12 · 2012: 9
- FWCI
- 28.42
- Type
- journal article
- Language
- en
- Open access
- gold
- doi.org
- Locations
- PLoS Medicine (publishedVersion, cc-by)
- PubMed Central (publishedVersion, cc-by)
- PubMed (publishedVersion)
- Minerva Access (University of Melbourne) (submittedVersion, cc-by)
- Digital Access to Scholarship at Harvard (DASH) (Harvard University) (submittedVersion, cc-by)
- RePEc: Research Papers in Economics (submittedVersion)
- DOAJ (DOAJ: Directory of Open Access Journals) (submittedVersion, cc-by-sa)
- Figshare (submittedVersion, cc-by)
- Funders
- Bill and Melinda Gates Foundation
- Institute for Health Metrics and Evaluation
- Topics
- Social Sciences › Demography › Insurance, Mortality, Demography, Risk Management
- Physical Sciences › Mathematics › Statistics and Probability › Census and Population Estimation
- Health Sciences › Medicine › Oncology › Global Cancer Incidence and Screening
- Keywords
- death registration completeness, civil registration, mortality measurement, uncertainty intervals, method validation
- MeSH terms
- Death Certificates, Humans, Mortality, Population Dynamics, Registries
About these checks
Registry, retraction, Cites and statistics results are computed, not judged, with one exception: a printed reference that no index lists is read once by a model before it counts as a citation error. Claims are extracted by a model and kept only when their quote appears verbatim in the text; each cited source is then checked, with a model’s help, for whether it says what the claim relies on. Those verdicts can be wrong — read the claim’s quote and the cited source before relying on one.
Statistics and arithmetic are recomputed, not judged.
Confidence bands are shown only for fields calibrated on our annotated test set. None is calibrated yet, so no band is shown.
What counts as a claim ›How we measure confidence ›How we check this ›
Are you an author, or do you see a problem with this page? Request a review
How to cite
Cite CoChat for the checks on this page, and the paper for its own findings.
- This page
- CoChat. (2026). Citation check: What Can We Conclude from Death Registration? Improved Methods for Evaluating Completeness. https://app.cochat.ai/papers/10.1371/journal.pmed.1000262
- The paper
- Murray, C. J. L., Rajaratnam, J. K., Marcus, J., Laakso, T., & Lopez, A. D. (2010). What Can We Conclude from Death Registration? Improved Methods for Evaluating Completeness. PLoS Medicine. https://doi.org/10.1371/journal.pmed.1000262
Data sources
Bibliographic data: Semantic Scholar, OpenAlex, Crossref.
Contains information from the Semantic Scholar Academic Graph Datasets, made available under the ODC Attribution License (ODC-BY 1.0).
Semantic Scholar’s data is described in: Kinney, R., et al. (2023). The Semantic Scholar Open Data Platform. arXiv:2301.10140.
