

The DOI matches its Crossref record; 36 of the 36 references it cites were found in a registry or an index.
Genetic assessment of age-associated Alzheimer disease risk: Development and validation of a polygenic hazard score
Open accessPublished version of a preprint
Abstract
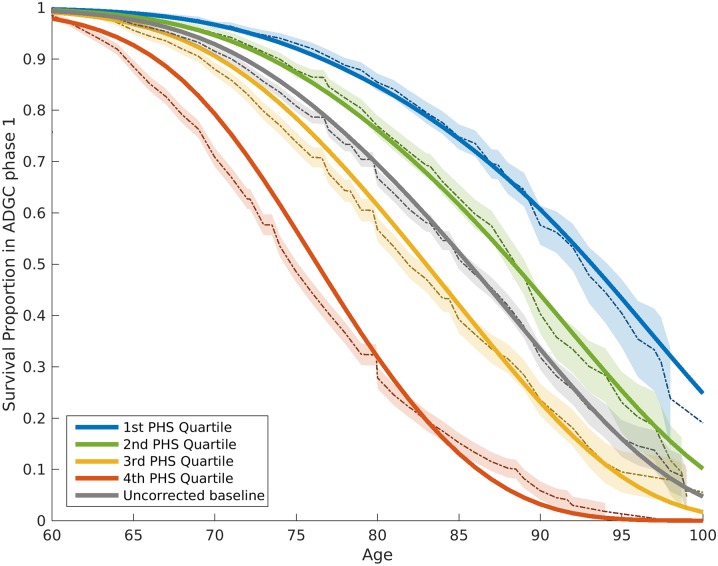
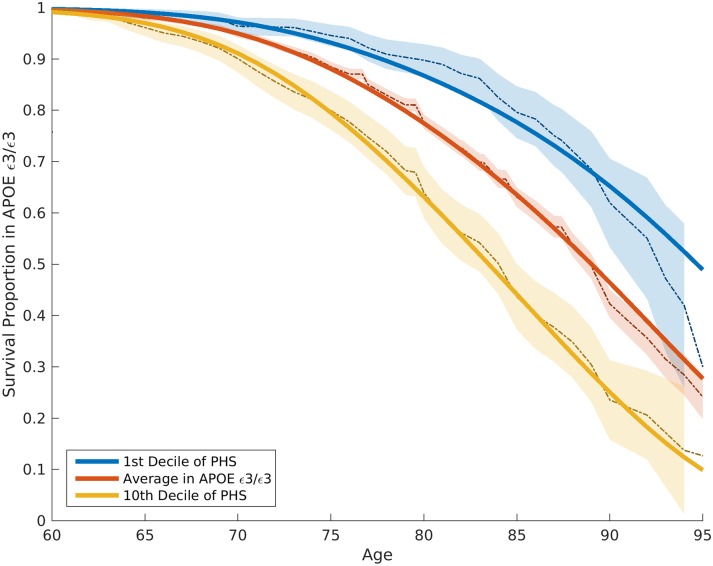
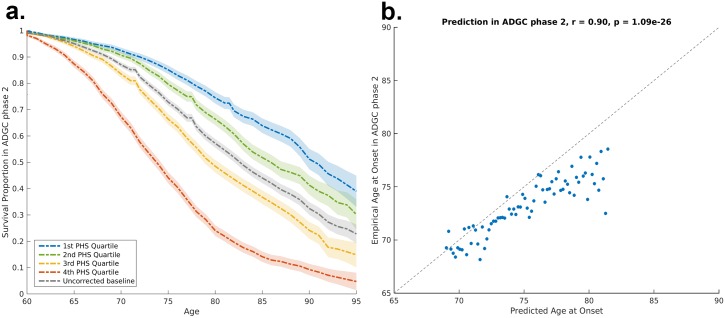
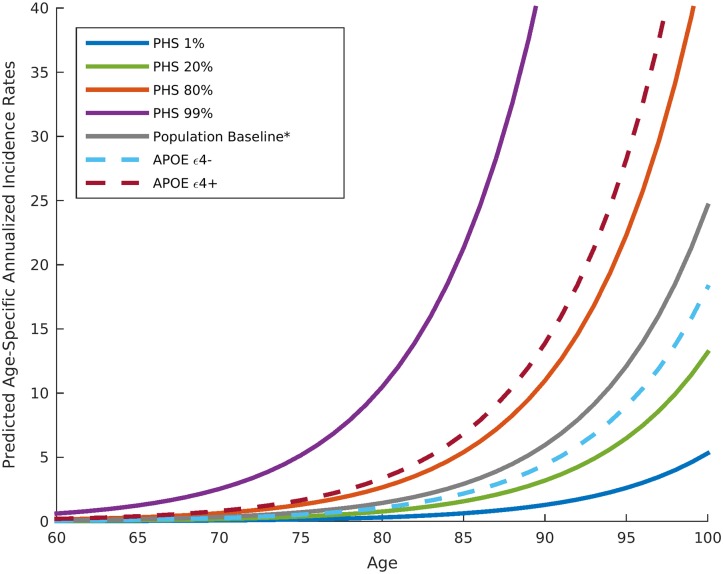
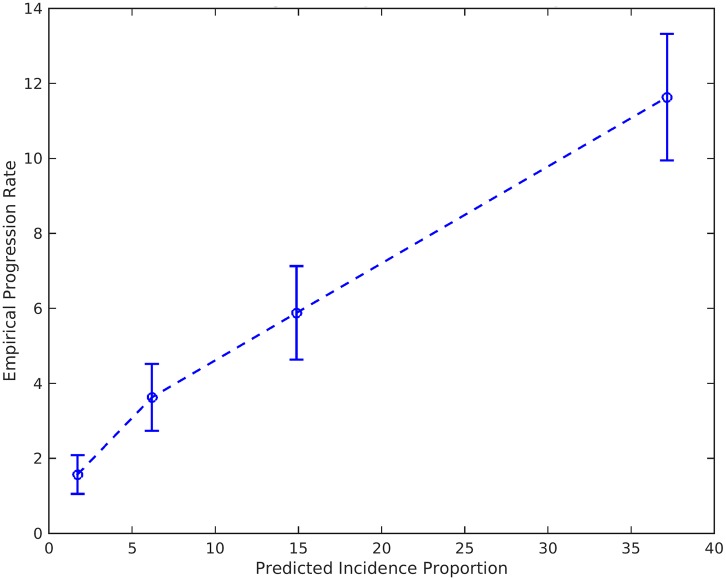
BACKGROUND: Identifying individuals at risk for developing Alzheimer disease (AD) is of utmost importance. Although genetic studies have identified AD-associated SNPs in APOE and other genes, genetic information has not been integrated into an epidemiological framework for risk prediction. METHODS AND FINDINGS: Using genotype data from 17,008 AD cases and 37,154 controls from the International Genomics of Alzheimer's Project (IGAP Stage 1), we identified AD-associated SNPs (at p < 10-5). We then integrated these AD-associated SNPs into a Cox proportional hazard model using genotype data from a subset of 6,409 AD patients and 9,386 older controls from Phase 1 of the Alzheimer's Disease Genetics Consortium (ADGC), providing a polygenic hazard score (PHS) for each participant. By combining population-based incidence rates and the genotype-derived PHS for each individual, we derived estimates of instantaneous risk for developing AD, based on genotype and age, and tested replication in multiple independent cohorts (ADGC Phase 2, National Institute on Aging Alzheimer's Disease Center [NIA ADC], and Alzheimer's Disease Neuroimaging Initiative [ADNI], total n = 20,680). Within the ADGC Phase 1 cohort, individuals in the highest PHS quartile developed AD at a considerably lower age and had the highest yearly AD incidence rate. Among APOE ε3/3 individuals, the PHS modified expected age of AD onset by more than 10 y between the lowest and highest deciles (hazard ratio 3.34, 95% CI 2.62-4.24, p = 1.0 × 10⁻²²). In independent cohorts, the PHS strongly predicted empirical age of AD onset (ADGC Phase 2, r = 0.90, p = 1.1 × 10⁻²⁶) and longitudinal progression from normal aging to AD (NIA ADC, Cochran-Armitage trend test, p = 1.5 × 10⁻¹⁰), and was associated with neuropathology (NIA ADC, Braak stage of neurofibrillary tangles, p = 3.9 × 10⁻⁶, and Consortium to Establish a Registry for Alzheimer's Disease score for neuritic plaques, p = 6.8 × 10⁻⁶) and in vivo markers of AD neurodegeneration (ADNI, volume loss within the entorhinal cortex, p = 6.3 × 10⁻⁶, and hippocampus, p = 7.9 × 10⁻⁵). Additional prospective validation of these results in non-US, non-white, and prospective community-based cohorts is necessary before clinical use. CONCLUSIONS: We have developed a PHS for quantifying individual differences in age-specific genetic risk for AD. Within the cohorts studied here, polygenic architecture plays an important role in modifying AD risk beyond APOE. With thorough validation, quantification of inherited genetic variation may prove useful for stratifying AD risk and as an enrichment strategy in therapeutic trials.
Overview
The claims and statistics of this paper haven’t been checked yet.
Run the check — free, no account needed. It reads the open-access text and checks the sources it cites.
Integrity signals
Registry
Cites
Statistics
Figures
Verification
Claims the paper makes
The claims and statistics of this paper haven’t been checked yet.
Run the check — free, no account needed. It reads the open-access text and checks the sources it cites.
Claims other papers make about this one
Each is checked against this paper’s own text: does it say what the citing paper says it does?
In the citing paper
“risk and seems to provide an improved method for risk prediction over more selective PRS or standard predictors such as APOEε4 alleles, age, and sex [118, 122, 123].”
From Genetic architecture of Alzheimer's disease (2020) · cites this paper as [118]
Self-check
Percentages, sums and reported differences re-computed from the paper’s own numbers.
The self-check needs the paper’s full text.
Citations
Cites
McKhann, G., Drachman, D., Folstein, M., Katzman, R., Price, D., & Stadlan, E. M. (1984) · Neurology · doi:10.1212/wnl.34.7.939 · Cited by 27,915
Neuropathological stageing of Alzheimer-related changes.
Braak, H., & Braak, E. (1991) · Acta Neuropathologica · doi:10.1007/bf00308809 · Cited by 16,123 · cited 1×
“For the neuropathological variables, we examined the Braak stage for neurofibrillary tangles (NFTs) (0, none; I–II, entorhinal; III–IV, limbic; and V–VI, isocortical) [11] and the Consortium to Establish a Registry for Alzheimer’s Disease (CERAD) score for neuritic plaques (none/sparse, moderate, or frequent) [12].”
MethodMirra, S. S., Heyman, A., McKeel, D., Sumi, S. M., Crain, B. J., Brownlee, L. M., Vogel, F. S., Hughes, J. P., Belle, G. V., Berg, L., et al. (1991) · Neurology · doi:10.1212/wnl.41.4.479 · Cited by 4,961
Meta-Analysis of 74,046 Individuals Identifies 11 New Susceptibility Loci for Alzheimer’s Disease
(EADI), E. A. D. I., Lambert, J.-C., (GERAD), G. A. E. R. I. A. D., Alzheimer's Disease Genetic Consortium (ADGC), (CHARGE), C. F. H. A. A. R. I. G. E., Ibrahim-Verbaas, C. A., Harold, D., Naj, A. C., Sims, R., Bellenguez, C., et al. (2013) · Nature Genetics · doi:10.1038/ng.2802 · Cited by 4,336
Self-citationHyman, B. T., Phelps, C. H., Beach, T. G., Bigio, E. H., Cairns, N. J., Carrillo, M. C., Dickson, D. W., Duyckaerts, C., Frosch, M. P., Masliah, E., et al. (2012) · Alzheimer's & Dementia · doi:10.1016/j.jalz.2011.10.007 · Cited by 3,092
Self-citationConsortium to Establish a Registry for Alzheimer's Disease (CERAD)
Fillenbaum, G., & Heyman, A. (2002) · doi:10.1002/0470846410.ch42(iii · Cited by 2,859
Rothman, K. J., Greenland, S., & Lash, T. L. (1998) · Cited by 2,096
Naj, A. C., Jun, G., Beecham, G. W., Wang, L.-S., Vardarajan, B. N., Buros, J., Gallins, P. J., Buxbaum, J. D., Jarvik, G. P., Crane, P. K., et al. (2011) · Nature Genetics · doi:10.1038/ng.801 · Cited by 1,901
Self-citationBrookmeyer, R., Gray, S. G., & Kawas, C. H. (1998) · American Journal of Public Health · doi:10.2105/ajph.88.9.1337 · Cited by 1,802
Genetic Investigation of ANthropometric Traits (GIANT) Consortium, Yang, J., DIAbetes Genetics Replication And Meta-analysis (DIAGRAM) Consortium, Ferreira, T., Morris, A. P., Medland, S. E., Madden, P. A. F., Heath, A. C., Martin, N. G., Montgomery, G. W., et al. (2012) · Nature Genetics · doi:10.1038/ng.2213 · Cited by 1,712
Cited by
Sorted by citations
New insights into the genetic etiology of Alzheimer’s disease and related dementias
Bellenguez, C., Küçükali, F., Jansen, I. E., Kleineidam, L., Moreno-Grau, S., Amin, N., Naj, A. C., Campos-Martin, R., Grenier-Boley, B., Andrade, V., et al. (2022) · Nature Genetics · doi:10.1038/s41588-022-01024-z · Cited by 2,498
The personal and clinical utility of polygenic risk scores
Torkamani, A., Wineinger, N. E., & Topol, E. J. (2018) · Nature Reviews Genetics · doi:10.1038/s41576-018-0018-x · Cited by 1,655
Polygenic risk scores: from research tools to clinical instruments
Lewis, C. M., & Vassos, E. (2020) · Genome Medicine · doi:10.1186/s13073-020-00742-5 · Cited by 1,360
“[61] showed that amongst APOE ε3/3 carriers, PRS modified the expected age of AD onset by more than 10 years between the lowest and highest deciles (hazard ratio 3.”
BackgroundClinical diagnosis of Alzheimer’s disease: Recommendations of the International Working Group
Dubois, B., Villain, N., Frisoni, G. B., Rabinovici, G. D., Sabbagh, M., Cappa, S., Bejanin, A., Bombois, S., Epelbaum, S., Teichmann, M., et al. (2021) · The Lancet Neurology · doi:10.1016/s1474-4422(21)00066-1 · Cited by 1,051
“Such modelling is in its early stages but exemplified through the example of age adjusted polygenic hazard scores 33 .”
BackgroundWightman, D. P., Jansen, I. E., Savage, J. E., Shadrin, A. A., Bahrami, S., Holland, D., Rongve, A., Børte, S., Winsvold, B. S., Drange, O. K., et al. (2021) · Nature Genetics · doi:10.1038/s41588-021-00921-z · Cited by 1,011
Self-citation
Metadata
- Authors
- Desikan, R. S., Fan, C. C., Wang, Y., Schork, A. J., Cabral, H. J., Cupples, L. A., Thompson, W. K., Besser, L., Kukull, W. A., Holland, D., Chen, C.-H., Brewer, J. B., Karow, D. S., Kauppi, K., Witoelar, A., Karch, C. M., Bonham, L. W., Yokoyama, J. S., Rosen, H. J., Miller, B. L., Dillon, W. P., Wilson, D. M., Hess, C. P., Pericak-Vance, M., Haines, J. L., Farrer, L. A., Mayeux, R., Hardy, J., Goate, A. M., Hyman, B. T., Schellenberg, G. D., McEvoy, L. K., Andreassen, O. A., & Dale, A. M.
- Affiliations
- University of California, San Francisco (US)
- University of California San Diego (US)
- Oslo University Hospital (NO)
- Boston University (US)
- Sankt Hans Hospital (DK)
- University of Washington (US)
- Washington University in St. Louis (US)
- Case Western Reserve University (US)
- Columbia University (US)
- UCL Queen Square Institute of Neurology (GB)
- Icahn School of Medicine at Mount Sinai (US)
- Massachusetts General Hospital (US)
- University of Pennsylvania (US)
- Corresponding author
- Desikan, Rahul S.
- Andreassen, Ole A.
- Dale, Anders M.
- ORCID
- Desikan, Rahul S.
- Fan, Chun Chieh
- Wang, Yunpeng
- Schork, Andrew J.
- Cabral, Howard J.
- Cupples, L. Adrienne
- Thompson, Wesley K.
- Kukull, Walter A.
- Holland, Dominic
- Chen, Chi-Hua
- Kauppi, Karolina
- Witoelar, Aree
- Karch, Celeste M.
- Bonham, Luke W.
- Yokoyama, Jennifer S.
- Miller, Bruce L.
- Dillon, William P.
- Wilson, David M.
- Hess, Christopher P.
- Haines, Jonathan L.
- Farrer, Lindsay A.
- Mayeux, Richard
- Hardy, John
- Goate, Alison M.
- Hyman, Bradley T.
- Schellenberg, Gerard D.
- McEvoy, Linda K.
- Andreassen, Ole A.
- Dale, Anders M.
- Venue
- PLoS Medicine
- Publisher
- Public Library of Science (PLoS)
- Published
- 2017-03-21
- Volume
- 14
- Issue
- 3
- Pages
- e1002258
- ISSN
- 1549-1277 (ISSN-L)
- 1549-1676
- PMC
- PMC5360219
- OpenAlex
- W2600084629
- Cited by
- 395
- References
- 36
- Citations by year
- 2026: 18 · 2025: 21 · 2024: 39 · 2023: 35 · 2022: 44 · 2021: 64 · 2020: 43 · 2019: 66 · 2018: 44 · 2017: 19
- FWCI
- 34.82
- Type
- journal article
- Language
- en
- Update notices
- correction (2017-03-28)
- Open access
- gold
- doi.org
- Licence
- Locations
- PLoS Medicine (publishedVersion, cc-by)
- bioRxiv (Cold Spring Harbor Laboratory) (acceptedVersion, cc-by-nd)
- PubMed Central (publishedVersion, cc-by)
- PubMed (publishedVersion)
- eScholarship (California Digital Library) (submittedVersion)
- DOAJ (DOAJ: Directory of Open Access Journals) (submittedVersion, cc-by-sa)
- UCL Discovery (University College London) (submittedVersion)
- Figshare (submittedVersion, cc-by)
- Columbia Academic Commons (Columbia University)
- Funders
- National Institutes of Health (NIH-AG046374, K01AG049152, R01MH100351)
- National Alzheimer's Coordinating Center
- Radiological Society of North America
- Foundation of the American Society of Neuroradiology
- Norges Forskningsråd ((#213837, #225989, #223273, #237250/EU JPND)
- South East Norway Health Authority (2013-123)
- Norske Kvinners Sanitetsforening
- KG Jebsen Foundation
- Topics
- Life Sciences › Neuroscience › Cellular and Molecular Neuroscience › Alzheimer's disease research and treatments
- Health Sciences › Medicine › Psychiatry and Mental health › Dementia and Cognitive Impairment Research
- Life Sciences › Biochemistry, Genetics and Molecular Biology › Genetics › Genetic Associations and Epidemiology
- Keywords
- Alzheimer's disease, polygenic hazard score, genetic risk prediction, age of onset, Cox proportional hazards model, neurofibrillary tangles, neuritic plaques, entorhinal cortex atrophy, amygdala atrophy, hippocampal atrophy, APOE ε4, APOE ε2
- MeSH terms
- Aged, Aged, 80 and over, Alzheimer Disease, Apolipoproteins E, Female, Genotype, Humans, Longitudinal Studies, Male, Middle Aged, United States, Geriatric Assessment, Multifactorial Inheritance, Polymorphism, Single Nucleotide
About these checks
Registry, retraction, Cites and statistics results are computed, not judged, with one exception: a printed reference that no index lists is read once by a model before it counts as a citation error. Claims are extracted by a model and kept only when their quote appears verbatim in the text; each cited source is then checked, with a model’s help, for whether it says what the claim relies on. Those verdicts can be wrong — read the claim’s quote and the cited source before relying on one.
Statistics and arithmetic are recomputed, not judged.
Confidence bands are shown only for fields calibrated on our annotated test set. None is calibrated yet, so no band is shown.
What counts as a claim ›How we measure confidence ›How we check this ›
Are you an author, or do you see a problem with this page? Request a review
