

The DOI matches its Crossref record; 52 of the 52 references it cites were found in a registry or an index.
Predicting survival from colorectal cancer histology slides using deep learning: A retrospective multicenter study
Open accessAbstract
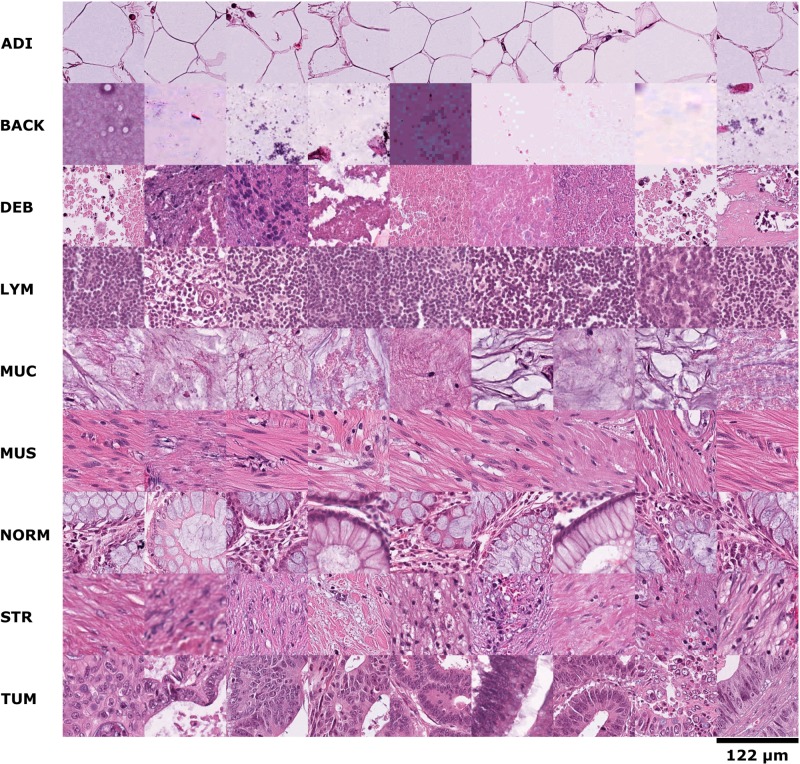
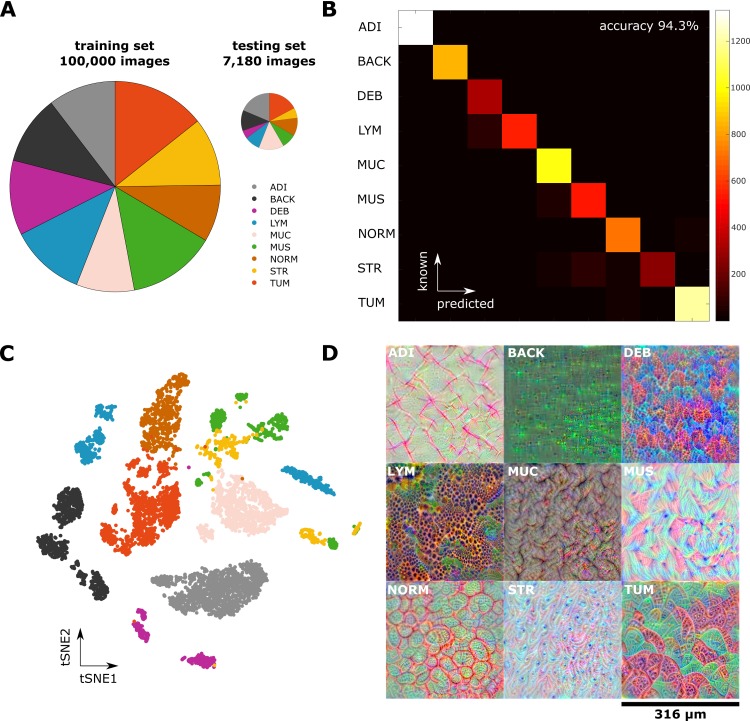
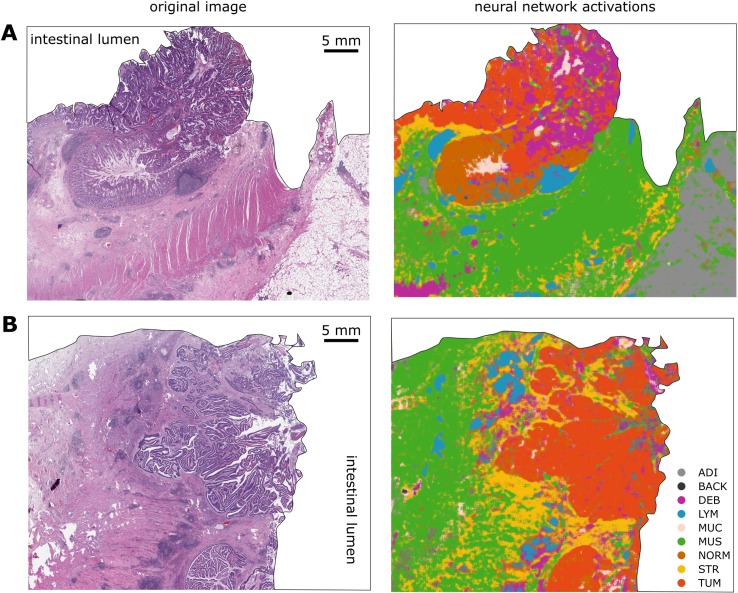
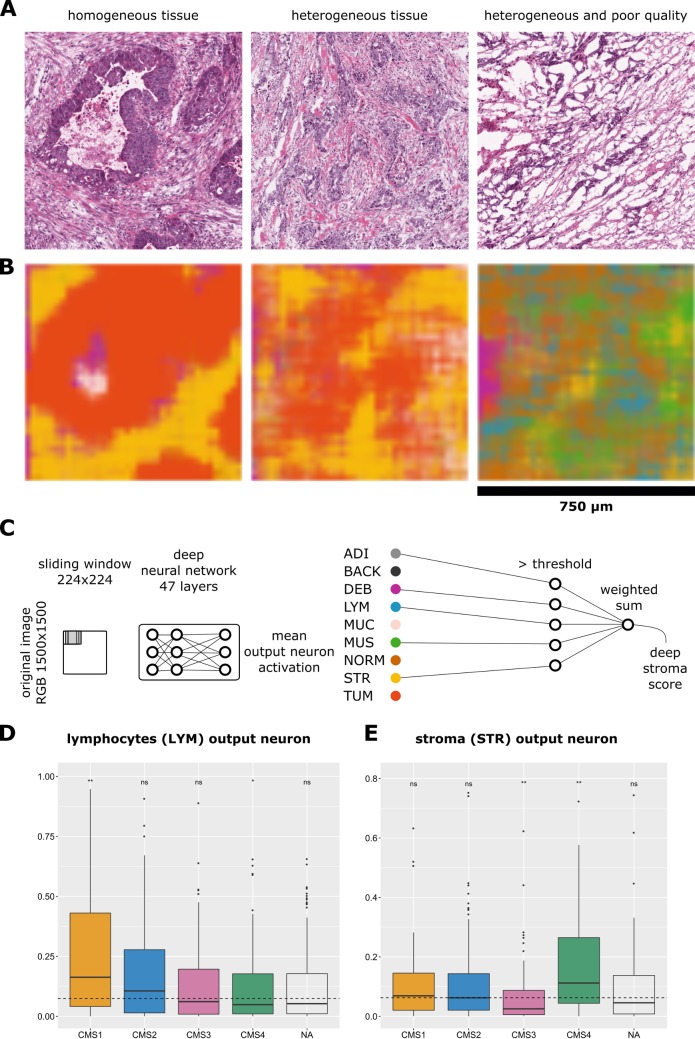
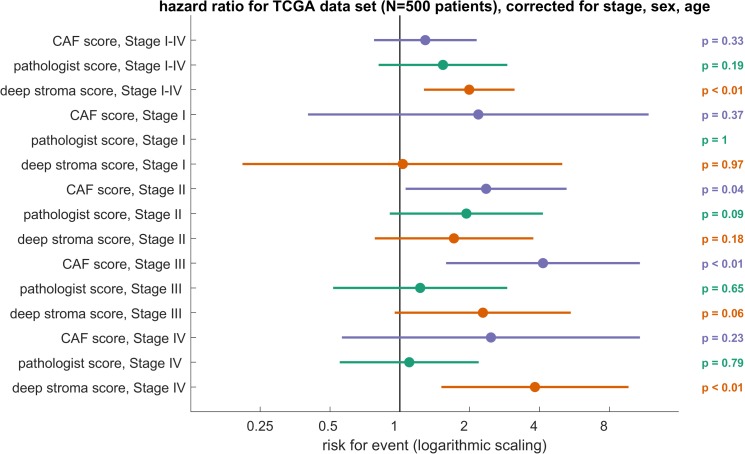
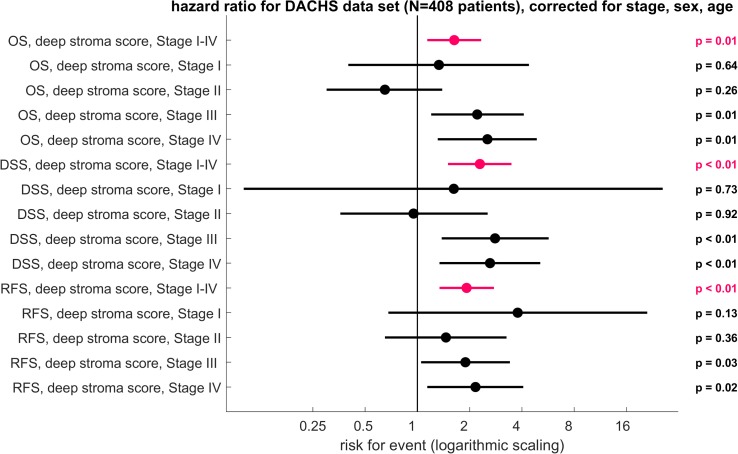
BACKGROUND: For virtually every patient with colorectal cancer (CRC), hematoxylin-eosin (HE)-stained tissue slides are available. These images contain quantitative information, which is not routinely used to objectively extract prognostic biomarkers. In the present study, we investigated whether deep convolutional neural networks (CNNs) can extract prognosticators directly from these widely available images. METHODS AND FINDINGS: We hand-delineated single-tissue regions in 86 CRC tissue slides, yielding more than 100,000 HE image patches, and used these to train a CNN by transfer learning, reaching a nine-class accuracy of >94% in an independent data set of 7,180 images from 25 CRC patients. With this tool, we performed automated tissue decomposition of representative multitissue HE images from 862 HE slides in 500 stage I-IV CRC patients in the The Cancer Genome Atlas (TCGA) cohort, a large international multicenter collection of CRC tissue. Based on the output neuron activations in the CNN, we calculated a "deep stroma score," which was an independent prognostic factor for overall survival (OS) in a multivariable Cox proportional hazard model (hazard ratio [HR] with 95% confidence interval [CI]: 1.99 [1.27-3.12], p = 0.0028), while in the same cohort, manual quantification of stromal areas and a gene expression signature of cancer-associated fibroblasts (CAFs) were only prognostic in specific tumor stages. We validated these findings in an independent cohort of 409 stage I-IV CRC patients from the "Darmkrebs: Chancen der Verhütung durch Screening" (DACHS) study who were recruited between 2003 and 2007 in multiple institutions in Germany. Again, the score was an independent prognostic factor for OS (HR 1.63 [1.14-2.33], p = 0.008), CRC-specific OS (HR 2.29 [1.5-3.48], p = 0.0004), and relapse-free survival (RFS; HR 1.92 [1.34-2.76], p = 0.0004). A prospective validation is required before this biomarker can be implemented in clinical workflows. CONCLUSIONS: In our retrospective study, we show that a CNN can assess the human tumor microenvironment and predict prognosis directly from histopathological images.
Overview
The claims and statistics of this paper haven’t been checked yet.
Run the check — free, no account needed. It reads the open-access text and checks the sources it cites.
Integrity signals
Registry
Cites
Statistics
Figures
Verification
Claims the paper makes
The claims and statistics of this paper haven’t been checked yet.
Run the check — free, no account needed. It reads the open-access text and checks the sources it cites.
Claims other papers make about this one
Each is checked against this paper’s own text: does it say what the citing paper says it does?
In the citing paper
“We applied Loki Annotate to four benchmark histopathology datasets including CRC7K41 (eight tissue types), WSSS-4LUAD42 (normal and tumor), PatchCamelyon43 (normal and tumor) and LC2500044 (benign and malignant).”
From A visual–omics foundation model to bridge histopathology with spatial transcriptomics (2025) · cites this paper as [41]
In the citing paper
“Prognostic AI models for colorectal cancer have been developed for various data modalities, including MRI (88), histopathology (89-91), and multiplex imaging (92,93).”
From Artificial Intelligence in Oncology: Current Landscape, Challenges, and Future Directions (2024) · cites this paper as [90]
Self-check
Percentages, sums and reported differences re-computed from the paper’s own numbers.
The self-check needs the paper’s full text.
Citations
Cites
Deep Residual Learning for Image Recognition
He, K., Zhang, X., Ren, S., & Sun, J. (2016) · 2016 IEEE Conference on Computer Vision and Pattern Recognition (CVPR) · doi:10.1109/cvpr.2016.90 · Cited by 235,474
Very Deep Convolutional Networks for Large-Scale Image Recognition
Simonyan, K., & Zisserman, A. (2014) · arXiv · doi:10.48550/arxiv.1409.1556 · Cited by 114,148
ImageNet classification with deep convolutional neural networks
Krizhevsky, A., Sutskever, I., & Hinton, G. E. (2017) · Communications of the ACM · doi:10.1145/3065386 · Cited by 112,155
LeCun, Y., Bengio, Y., & Hinton, G. (2015) · Nature · doi:10.1038/nature14539 · Cited by 84,126
Going deeper with convolutions
Szegedy, C., Liu, W., Jia, Y., Sermanet, P., Reed, S., Anguelov, D., Erhan, D., Vanhoucke, V., & Rabinovich, A. (2015) · 2015 IEEE Conference on Computer Vision and Pattern Recognition (CVPR) · doi:10.1109/cvpr.2015.7298594 · Cited by 48,562
(2008) · Journal of Machine Learning Research · Cited by 33,051
Mastering the game of Go with deep neural networks and tree search
Silver, D., Huang, A., Maddison, C. J., Guez, A., Sifre, L., van den Driessche, G., Schrittwieser, J., Antonoglou, I., Panneershelvam, V., Lanctot, M., et al. (2016) · Nature · doi:10.1038/nature16961 · Cited by 15,612
Dermatologist-level classification of skin cancer with deep neural networks
Esteva, A., Kuprel, B., Novoa, R. A., Ko, J., Swetter, S. M., Blau, H. M., & Thrun, S. (2017) · Nature · doi:10.1038/nature21056 · Cited by 14,362
Hinton, G., Deng, L., Yu, D., Dahl, G., Mohamed, A.-R., Jaitly, N., Senior, A., Vanhoucke, V., Nguyen, P., Sainath, T., et al. (2012) · IEEE Signal Processing Magazine · doi:10.1109/msp.2012.2205597 · Cited by 10,260 · cited 1×
“Applications of CNNsrangewidely,from speechrecognition[14,15],facerecognition[16], or traffic sign classification[17] to masteringtheJapanese gameof Go [18].”
BackgroundQuPath: Open source software for digital pathology image analysis
Bankhead, P., Loughrey, M. B., Fernández, J. A., Dombrowski, Y., McArt, D. G., Dunne, P. D., McQuaid, S., Gray, R. T., Murray, L. J., Coleman, H. G., et al. (2017) · Scientific Reports · doi:10.1038/s41598-017-17204-5 · Cited by 8,908
Comprehensive molecular characterization of human colon and rectal cancer
The Cancer Genome Atlas Network (2012) · Nature · doi:10.1038/nature11252 · Cited by 8,499
Type, Density, and Location of Immune Cells Within Human Colorectal Tumors Predict Clinical Outcome
Galon, J., Costes, A., Sanchez-Cabo, F., Kirilovsky, A., Mlecnik, B., Lagorce-Pagès, C., Tosolini, M., Camus, M., Berger, A., Wind, P., et al. (2006) · Science · doi:10.1126/science.1129139 · Cited by 6,516
SqueezeNet: AlexNet-level accuracy with 50x fewer parameters and <0.5MB model size
Iandola, F. N., Han, S., Moskewicz, M. W., Ashraf, K., Dally, W. J., & Keutzer, K. (2016) · arXiv · doi:10.48550/arxiv.1602.07360 · Cited by 6,201
The consensus molecular subtypes of colorectal cancer
Guinney, J., Dienstmann, R., Wang, X., de Reyniès, A., Schlicker, A., Soneson, C., Marisa, L., Roepman, P., Nyamundanda, G., Angelino, P., et al. (2015) · Nature Medicine · doi:10.1038/nm.3967 · Cited by 5,170
Decoding tumour phenotype by noninvasive imaging using a quantitative radiomics approach
Aerts, H. J. W. L., Velazquez, E. R., Leijenaar, R. T. H., Parmar, C., Grossmann, P., Carvalho, S., Bussink, J., Monshouwer, R., Haibe-Kains, B., Rietveld, D., et al. (2014) · Nature Communications · doi:10.1038/ncomms5006 · Cited by 5,132
Collins, P. G. S., Reitsma, J. B., Altman, D. G., & Moons, K. G. M. (2015) · British Journal of Cancer · doi:10.1038/bjc.2014.639 · Cited by 3,319
Ehteshami Bejnordi, B., Veta, M., Johannes van Diest, P., van Ginneken, B., Karssemeijer, N., Litjens, G., van der Laak, J. A. W. M., and the CAMELYON16 Consortium, Hermsen, M., Manson, Q. F., et al. (2017) · JAMA · doi:10.1001/jama.2017.14585 · Cited by 3,293
Context-dependent pre-trained deep neural networks for large-vocabulary speech recognition
Dahl, G. E., Yu, D., Deng, L., & Acero, A. (2012) · IEEE Transactions on Audio Speech and Language Processing · doi:10.1109/tasl.2011.2134090 · Cited by 3,011
Histopathological Image Analysis: A Review
Gurcan, M. N., Boucheron, L. E., Can, A., Madabhushi, A., Rajpoot, N. M., & Yener, B. (2009) · IEEE Reviews in Biomedical Engineering · doi:10.1109/rbme.2009.2034865 · Cited by 2,052
Absolute quantification of somatic DNA alterations in human cancer
Carter, S. L., Cibulskis, K., Helman, E., McKenna, A., Shen, H., Zack, T. I., Laird, P. W., Onofrio, R. C., Winckler, W., Weir, B. A., et al. (2012) · Nature Biotechnology · doi:10.1038/nbt.2203 · Cited by 2,031
Huang, Y., Liang, C., He, L., Tian, J., Liang, C., Chen, X., Ma, Z., & Liu, Z. (2016) · Journal of Clinical Oncology · doi:10.1200/jco.2015.65.9128 · Cited by 1,753
A method for normalizing histology slides for quantitative analysis
Macenko, M., Niethammer, M., Marron, J. S., Borland, D., Woosley, J. T., Guan, X., Schmitt, C., & Thomas, N. E. (2009) · 2009 IEEE International Symposium on Biomedical Imaging: From Nano to Macro · doi:10.1109/isbi.2009.5193250 · Cited by 1,482
Multi-column deep neural network for traffic sign classification
Cireşan, D., Meier, U., Masci, J., & Schmidhuber, J. (2012) · Neural Networks · doi:10.1016/j.neunet.2012.02.023 · Cited by 1,057
DeepID3: Face Recognition with Very Deep Neural NetworksPreprint
Sun, Y. J., Liang, D., Wang, X., & Tang, X. (2015) · arXiv (Cornell University) · doi:10.48550/arxiv.1502.00873 · Cited by 842
Clinical Applications of Metabolomics in Oncology: A Review
Spratlin, J. L., Serkova, N. J., & Eckhardt, S. G. (2009) · Clinical Cancer Research · doi:10.1158/1078-0432.ccr-08-1059 · Cited by 752
Deep learning based tissue analysis predicts outcome in colorectal cancer
Bychkov, D., Linder, N., Turkki, R., Nordling, S., Kovanen, P. E., Verrill, C., Walliander, M., Lundin, M., Haglund, C., & Lundin, J. (2018) · Scientific Reports · doi:10.1038/s41598-018-21758-3 · Cited by 644
Stromal contribution to the colorectal cancer transcriptome
Isella, C., Terrasi, A., Bellomo, S. E., Petti, C., Galatola, G., Muratore, A., Mellano, A., Senetta, R., Cassenti, A., Sonetto, C., et al. (2015) · Nature Genetics · doi:10.1038/ng.3224 · Cited by 640
Becht, E., de Reyniès, A., Giraldo, N. A., Pilati, C., Buttard, B., Lacroix, L., Selves, J., Sautès-Fridman, C., Laurent-Puig, P., & Fridman, W. H. (2016) · Clinical Cancer Research · doi:10.1158/1078-0432.ccr-15-2879 · Cited by 590
Multi-class texture analysis in colorectal cancer histology
Kather, J. N., Weis, C.-A., Bianconi, F., Melchers, S. M., Schad, L. R., Gaiser, T., Marx, A., & Zöllner, F. G. (2016) · Scientific Reports · doi:10.1038/srep27988 · Cited by 578
Self-citationQuantitative Image Analysis of Cellular Heterogeneity in Breast Tumors Complements Genomic Profiling
Yuan, Y., Failmezger, H., Rueda, O. M., Ali, H. R., Gräf, S., Chin, S.-F., Schwarz, R. F., Curtis, C., Dunning, M. J., Bardwell, H., et al. (2012) · Science Translational Medicine · doi:10.1126/scitranslmed.3004330 · Cited by 426
Halama, N., Michel, S., Kloor, M., Zoernig, I., Benner, A., Spille, A., Pommerencke, T., von Knebel, D. M., Folprecht, G., Luber, B., et al. (2011) · Cancer Research · doi:10.1158/0008-5472.can-11-0268 · Cited by 421
Self-citationAutomatic Nuclei Segmentation in H&E Stained Breast Cancer Histopathology Images
Veta, M., van Diest, P. J., Kornegoor, R., Huisman, A., Viergever, M. A., & Pluim, J. P. W. (2013) · PLoS ONE · doi:10.1371/journal.pone.0070221 · Cited by 370
Huijbers, A., Tollenaar, R. A. �. �., van Pelt, G. W., Zeestraten, E. C. M., Dutton, S., McConkey, C. C., Domingo, E., Smit, V. T. H. B. M., Midgley, R. S., Warren, B. F., et al. (2012) · Annals of Oncology · doi:10.1093/annonc/mds246 · Cited by 346
van Dam, P., van der Stok, E. P., Teuwen, L.-A. M. N., den Eynden, G. G. V., Illemann, M., Frentzas, S., Majeed, A. W., Eefsen, R. L., van den Braak, R. R. J. C., Lazaris, A., et al. (2017) · British Journal of Cancer · doi:10.1038/bjc.2017.334 · Cited by 245
Wu, J., Liang, C., Chen, M., & Su, W. (2016) · Oncotarget · doi:10.18632/oncotarget.12135 · Cited by 216
Mezheyeuski, A., Bergsland, C. H., Backman, M., Djureinovic, D., Sjöblom, T., Bruun, J., & Micke, P. (2017) · The Journal of Pathology · doi:10.1002/path.5026 · Cited by 182
O’Connor, J. P. B., Jackson, A., Asselin, M., Buckley, D. L., Parker, G. J. M., & Jayson, G. C. (2008) · The Lancet Oncology · doi:10.1016/s1470-2045(08)70196-7 · Cited by 178
Genomics and emerging biomarkers for immunotherapy of colorectal cancer
Kather, J. N., Halama, N., & Jaeger, D. (2018) · Seminars in Cancer Biology · doi:10.1016/j.semcancer.2018.02.010 · Cited by 154
Self-citationLong-Term Risk of Colorectal Cancer After Negative Colonoscopy
Brenner, H., Chang-Claude, J. C., Seiler, C. M., & Hoffmeister, M. (2011) · Journal of Clinical Oncology · doi:10.1200/jco.2011.35.9307 · Cited by 150
Self-citationThe prognostic value of tumour-stroma ratio in triple-negative breast cancer
Moorman, A. M., Vink, R., Heijmans, H. J., van der Palen, J. A. M., & Kouwenhoven, E. A. (2012) · European Journal of Surgical Oncology · doi:10.1016/j.ejso.2012.01.002 · Cited by 136
Hoffmeister, M., Jansen, L., Rudolph, A., Tóth, C., Kloor, M., Roth, W., Bläker, H., Chang-Claude, J. C., & Brenner, H. (2015) · JNCI Journal of the National Cancer Institute · doi:10.1093/jnci/djv045 · Cited by 115
Self-citationTurkki, R., Linder, N., Kovanen, P. E., Pellinen, T. S., & Lundin, J. E. (2016) · Journal of Pathology Informatics · doi:10.4103/2153-3539.189703 · Cited by 109
Quantitative imaging biomarkers in neuro-oncology
Waldman, A. D., Jackson, A., Price, S. J., Clark, C. A., Booth, T. C., Auer, D. P., Tofts, P. S., Collins, D. J., Leach, M. O., & Rees, J. H. (2009) · Nature Reviews Clinical Oncology · doi:10.1038/nrclinonc.2009.92 · Cited by 104
Promise and pitfalls of quantitative imaging in oncology clinical trials
Kurland, B. F., Gerstner, E. R., Mountz, J. M., Schwartz, L. H., Ryan, C. W., Graham, M. M., Buatti, J. M., Fennessy, F. M., Eikman, E. A., Kumar, V., et al. (2012) · Magnetic Resonance Imaging · doi:10.1016/j.mri.2012.06.009 · Cited by 101
In Silico Modeling of Immunotherapy and Stroma-Targeting Therapies in Human Colorectal Cancer
Kather, J. N., Poleszczuk, J., Suarez‐Carmona, M., Krisam, J., Charoentong, P., Valous, N. A., Weis, C., Tavernar, L., Leiß, F., Herpel, E., et al. (2017) · Cancer Research · doi:10.1158/0008-5472.can-17-2006 · Cited by 100
Self-citationChromatin organisation and cancer prognosis: a pan-cancer study
Kleppe, A., Albregtsen, F., Vlatkovic, L., Pradhan, M., Nielsen, B., Hveem, T. S., Askautrud, H. A., Kristensen, G. B., Nesbakken, A., Trovik, J., et al. (2018) · The Lancet Oncology · doi:10.1016/s1470-2045(17)30899-9 · Cited by 87
Kather, J. N., Marx, A., Reyes‐Aldasoro, C. C., Schad, L. R., Zöllner, F. G., & Weis, C. (2015) · Oncotarget · doi:10.18632/oncotarget.4383 · Cited by 72
Self-citationPrognostic markers for colorectal cancer: estimating ploidy and stroma
Danielsen, H. E., Hveem, T. S., Domingo, E., Pradhan, M., Kleppe, A., Syvertsen, R. A., KOSTOLOMOV, I., Nesheim, J. A., Askautrud, H. A., Nesbakken, A., et al. (2017) · Annals of Oncology · doi:10.1093/annonc/mdx794 · Cited by 70
Akbar, S., Jordan, L. B., Purdie, C. A., Thompson, A. M., & McKenna, S. J. (2015) · British Journal of Cancer · doi:10.1038/bjc.2015.309 · Cited by 35
Moraleda, R. R., Xiong, W., Halama, N., Breitkopf‐Heinlein, K., Dooley, S., Salinas, L., Heermann, D. W., & Valous, N. A. (2017) · Medical Image Analysis · doi:10.1016/j.media.2017.02.009 · Cited by 33
Self-citationLarge-scale database mining reveals hidden trends and future directions for cancer immunotherapy
Kather, J. N., Berghoff, A. S., Ferber, D., Suarez‐Carmona, M., Reyes‐Aldasoro, C. C., Valous, N. A., Moraleda, R. R., Jäger, D., & Halama, N. (2018) · OncoImmunology · doi:10.1080/2162402x.2018.1444412 · Cited by 16
Self-citationKather, J. N., Charoentong, P., Zoernig, I., Jaeger, D., & Halama, N. (2018) · Journal of Clinical Oncology · doi:10.1200/jco.2018.36.15_suppl.e24113 · Cited by 2
Self-citation
Cited by
Sorted by citations
Artificial intelligence in digital pathology — new tools for diagnosis and precision oncology
Bera, K., Schalper, K. A., Rimm, D. L., Velcheti, V., & Madabhushi, A. (2019) · Nature Reviews Clinical Oncology · doi:10.1038/s41571-019-0252-y · Cited by 1,698
Kather, J. N., Pearson, A. T., Halama, N., Jäger, D., Krause, J., Loosen, S. H., Marx, A., Boor, P., Tacke, F., Neumann, U. P., et al. (2019) · Nature Medicine · doi:10.1038/s41591-019-0462-y · Cited by 1,458
Self-citationTowards a general-purpose foundation model for computational pathology
Chen, R. J., Ding, T., Lu, M. Y., Williamson, D. F. K., Jaume, G., Song, A. H., Chen, B., Zhang, A., Shao, D., Shaban, M., et al. (2024) · Nature Medicine · doi:10.1038/s41591-024-02857-3 · Cited by 1,560
Targeted drug delivery strategies for precision medicines
Manzari, M. T., Shamay, Y., Kiguchi, H., Rosen, N., Scaltriti, M., & Heller, D. A. (2021) · Nature Reviews Materials · doi:10.1038/s41578-020-00269-6 · Cited by 1,183
MedMNIST v2 - A large-scale lightweight benchmark for 2D and 3D biomedical image classification
Yang, J., Shi, R., Wei, D., Liu, Z., Zhao, L., Ke, B., Pfister, H., & Ni, B. (2023) · Scientific Data · doi:10.1038/s41597-022-01721-8 · Cited by 1,043
“The PathMNIST is based on a prior study 16,17 for predicting survival from colorectal cancer histology slides, providing a dataset”
Method
Metadata
- Authors
- Kather, J. N., Krisam, J., Charoentong, P., Luedde, T., Herpel, E., Weis, C.-A., Gaiser, T., Marx, A., Valous, N. A., Ferber, D., Jansen, L., Reyes-Aldasoro, C. C., Zörnig, I., Jäger, D., Brenner, H., Chang-Claude, J., Hoffmeister, M., & Halama, N.
- Affiliations
- German Cancer Research Center (DE)
- University Hospital Heidelberg (DE)
- Universitätsklinikum Aachen (DE)
- Heidelberg University (DE)
- University Medical Centre Mannheim (DE)
- Corresponding author
- Kather, Jakob Nikolas
- ORCID
- Venue
- PLOS Medicine
- Publisher
- Public Library of Science (PLoS)
- Published
- 2019-01-24
- Volume
- 16
- Issue
- 1
- Pages
- e1002730
- ISSN
- 1549-1277 (ISSN-L)
- 1549-1676
- PMC
- PMC6345440
- OpenAlex
- W2914568698
- Cited by
- 1,082
- References
- 52
- Citations by year
- 2026: 158 · 2025: 164 · 2024: 180 · 2023: 170 · 2022: 175 · 2021: 129 · 2020: 87 · 2019: 17
- FWCI
- 46.54
- Type
- journal article
- Language
- en
- Open access
- gold
- doi.org
- Licence
- Locations
- PLoS Medicine (publishedVersion, cc-by)
- Europe PMC (PubMed Central) (publishedVersion, cc-by)
- PubMed Central (publishedVersion, cc-by)
- PubMed (publishedVersion)
- City Research Online (City University London) (acceptedVersion)
- RWTH Publications (RWTH Aachen) (submittedVersion, cc-by)
- DOAJ (DOAJ: Directory of Open Access Journals) (submittedVersion, cc-by-sa)
- Figshare (submittedVersion, cc-by)
- RWTH Publications (RWTH Aachen)
- Funders
- Deutsches Krebsforschungszentrum (Heidelberg School of Oncology)
- Bundesministerium für Bildung und Forschung (13GW0091E, 01ER0814, 01ER0815, 01ER1505A, 01ER1505B)
- Deutsche Forschungsgemeinschaft (BR 1704/6-1, BR 1704/6-3, BR 1704/6-4, BR 1704/17-1, CH 117/1-1, and HO 5117/2-1)
- Topics
- Physical Sciences › Computer Science › Artificial Intelligence › AI in cancer detection
- Health Sciences › Medicine › Radiology, Nuclear Medicine and Imaging › Radiomics and Machine Learning in Medical Imaging
- Health Sciences › Medicine › Oncology › Colorectal Cancer Screening and Detection
- Keywords
- colorectal cancer, deep convolutional neural networks, tumor stroma, prognostic factors, overall survival, cancer-associated fibroblasts, cancer of unknown primary, relapse-free survival, TCGA, transfer learning, histopathology image analysis, digital pathology
- MeSH terms
- Deep Learning, Colon, Coloring Agents, Eosine Yellowish-(YS), Female, Hematoxylin, Humans, Image Interpretation, Computer-Assisted, Male, Prognosis, Rectum, Retrospective Studies, Colorectal Neoplasms
About these checks
Registry, retraction, Cites and statistics results are computed, not judged, with one exception: a printed reference that no index lists is read once by a model before it counts as a citation error. Claims are extracted by a model and kept only when their quote appears verbatim in the text; each cited source is then checked, with a model’s help, for whether it says what the claim relies on. Those verdicts can be wrong — read the claim’s quote and the cited source before relying on one.
Statistics and arithmetic are recomputed, not judged.
Confidence bands are shown only for fields calibrated on our annotated test set. None is calibrated yet, so no band is shown.
What counts as a claim ›How we measure confidence ›How we check this ›
Are you an author, or do you see a problem with this page? Request a review
