

The DOI matches its Crossref record; 51 of the 52 references it cites were found in a registry or an index.
A Post-Synaptic Scaffold at the Origin of the Animal Kingdom
Open accessAbstract
BACKGROUND: The evolution of complex sub-cellular structures such as the synapse requires the assembly of multiple proteins, each conferring added functionality to the integrated structure. Tracking the early evolution of synapses has not been possible without genomic information from the earliest branching animals. As the closest extant relatives to the Eumetazoa, Porifera (sponges) represent a pivotal group for understanding the evolution of nervous systems, because sponges lack neurons with clearly recognizable synapses, in contrast to eumetazoan animals. METHODOLOGY/PRINCIPAL FINDINGS: We show that the genome of the demosponge Amphimedon queenslandica possesses a nearly complete set of post-synaptic protein homologs whose conserved interaction motifs suggest assembly into a complex structure. In the critical synaptic scaffold gene, dlg, residues that make hydrogen bonds and van der Waals interactions with the PDZ ligand are 100% conserved between sponge and human, as is the motif organization of the scaffolds. Expression in Amphimedon of multiple post-synaptic gene homologs in larval flask cells further supports the existence of an assembled structure. Among the few post-synaptic genes absent from Amphimedon, but present in Eumetazoa, are receptor genes including the entire ionotropic glutamate receptor family. CONCLUSIONS/SIGNIFICANCE: Highly conserved protein interaction motifs and co-expression in sponges of multiple proteins whose homologs interact in eumetazoan synapses indicate that a complex protein scaffold was present at the origin of animals, perhaps predating nervous systems. A relatively small number of crucial innovations to this pre-existing structure may represent the founding changes that led to a post-synaptic element.
Overview
The claims and statistics of this paper haven’t been checked yet.
Run the check — free, no account needed. It reads the open-access text and checks the sources it cites.
Integrity signals
Registry
Cites
Statistics
Figures
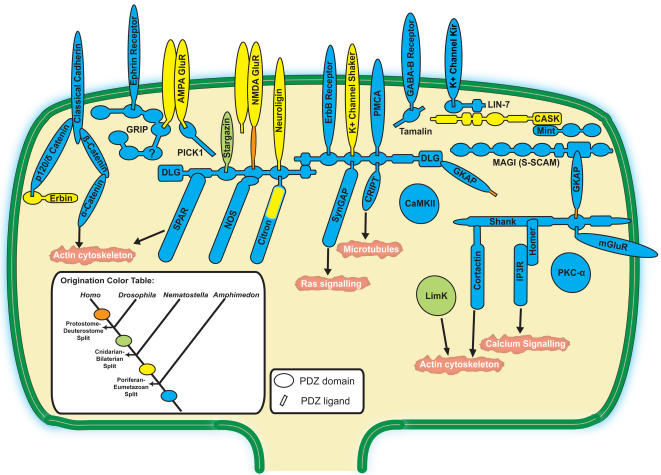
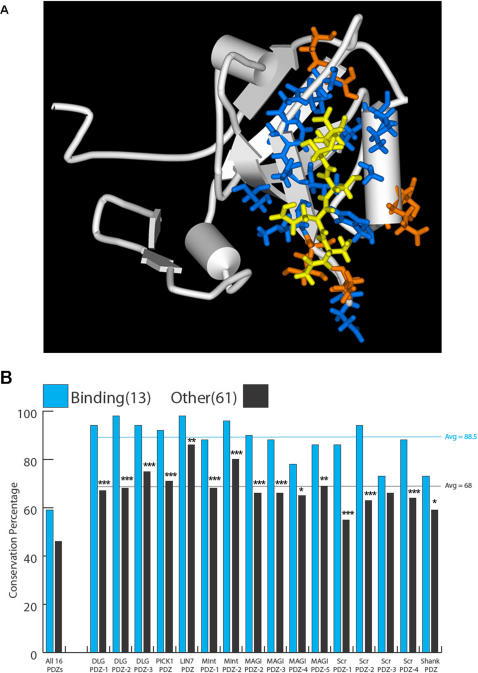
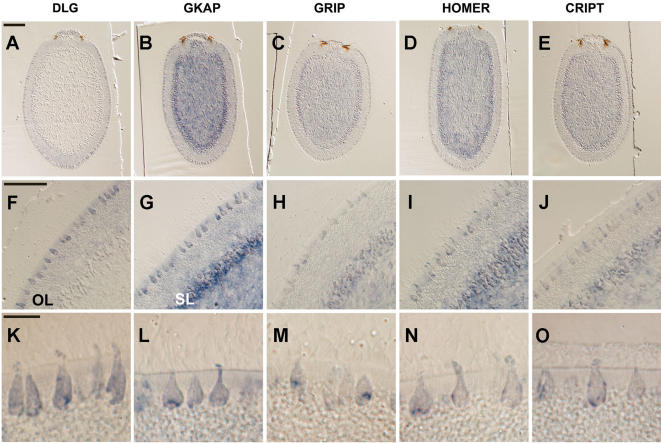
Verification
Claims the paper makes
The claims and statistics of this paper haven’t been checked yet.
Run the check — free, no account needed. It reads the open-access text and checks the sources it cites.
Claims other papers make about this one
Each is checked against this paper’s own text: does it say what the citing paper says it does?
In the citing paper
“An “ancestral complexity” of cnidarians in terms of synaptic proteins is therefore apparent [28,32].”
From Back to the Basics: Cnidarians Start to Fire (2017) · cites this paper as [28]
In the citing paper
“most of the structural components of the post-synaptic density (PSD) are present in the sponge Amphimedon [22,28], and some have clear homologs in choanoflagellates and other unicellular holozoans [29,30]”
From Back to the Basics: Cnidarians Start to Fire (2017) · cites this paper as [28]
Self-check
Percentages, sums and reported differences re-computed from the paper’s own numbers.
The self-check needs the paper’s full text.
Citations
Cites
Gapped BLAST and PSI-BLAST: a new generation of protein database search programs
Altschul, S. (1997) · Nucleic Acids Research · doi:10.1093/nar/25.17.3389 · Cited by 73,302
Thompson, J. D., Higgins, D. G., & Gibson, T. J. (1994) · Nucleic Acids Research · doi:10.1093/nar/22.22.4673 · Cited by 64,617
Berman, H. M. (2000) · Nucleic Acids Research · doi:10.1093/nar/28.1.235 · Cited by 40,196
MrBayes 3: Bayesian phylogenetic inference under mixed models
Ronquist, F., & Huelsenbeck, J. P. (2003) · Bioinformatics · doi:10.1093/bioinformatics/btg180 · Cited by 29,194
PROCHECK: a program to check the stereochemical quality of protein structures
Laskowski, R. A., MacArthur, M. W., Moss, D. S., & Thornton, J. M. (1993) · Journal of Applied Crystallography · doi:10.1107/s0021889892009944 · Cited by 24,581
MAFFT: a novel method for rapid multiple sequence alignment based on fast Fourier transform
Katoh, K. (2002) · Nucleic Acids Research · doi:10.1093/nar/gkf436 · Cited by 17,027
A Simple, Fast, and Accurate Algorithm to Estimate Large Phylogenies by Maximum Likelihood
Guindon, S., & Gascuel, O. (2003) · Systematic Biology · doi:10.1080/10635150390235520 · Cited by 16,923
All-Atom Empirical Potential for Molecular Modeling and Dynamics Studies of Proteins
MacKerell, A. D., Bashford, D., Bellott, M., Dunbrack, R. L., Evanseck, J. D., Field, M. J., Fischer, S., Gao, J., Guo, H., Ha, S., et al. (1998) · The Journal of Physical Chemistry B · doi:10.1021/jp973084f · Cited by 14,429
The Pfam Protein Families Database
Bateman, A. G. (2002) · Nucleic Acids Research · doi:10.1093/nar/30.1.276 · Cited by 14,075
CHARMM: A program for macromolecular energy, minimization, and dynamics calculations
Brooks, B., Bruccoleri, R., Olafson, B. D., States, D., Swaminathan, S., & Karplus, M. (1983) · Journal of Computational Chemistry · doi:10.1002/jcc.540040211 · Cited by 13,736
Cited by
Sorted by citations
Items 201–290 of 290
Evolution of sodium channels and the new view of early nervous system evolution
Liebeskind, B. J. (2011) · Communicative & Integrative Biology · doi:10.4161/cib.17069 · Cited by 12
The Central Nervous System of Invertebrates
Hartenstein, V. (2016) · Wiley eBooks · doi:10.1002/9781118316757.ch8 · Cited by 12
Xiang, X., Gomez, A. A. V., Blomberg, S. P., Yuan, H., Degnan, B. M., & Degnan, B. M. (2023) · Frontiers in Neural Circuits · doi:10.3389/fncir.2023.1250694 · Cited by 11
Self-citationElectrical Signaling Beyond Neurons
Monk, T., Dennler, N., Ralph, N. O., Rastogi, S., Afshar, S., Urbizagastegui, P. A. D. A., Jarvis, R. J., André, V. S., & Adamatzky, A. (2024) · Neural Computation · doi:10.1162/neco_a_01696 · Cited by 11
A Comparative Genomics Perspective on the Origin of Multicellularity and Early Animal Evolution
Srivastava, M. (2015) · Advances in marine genomics · doi:10.1007/978-94-017-9642-2_14 · Cited by 10
Cytoskeletal Control of Planar Polarity in Root Hair Development
Takatsuka, H., & Ito, M. A. (2020) · Frontiers in Plant Science · doi:10.3389/fpls.2020.580935 · Cited by 9
Ruggiero, R. N., Bueno-Júnior, L. S., Ross, J. B. D., Fachim, H., Padovan‐Neto, F. E., Merlo, S., Rohner, C. J. S., Ikeda, E. T., Brusco, J., & Moreira, J. E. (2011) · Medicina (Ribeirão Preto) · doi:10.11606/issn.2176-7262.v44i2p143-156 · Cited by 9
From traveler to homebody: Which signaling mechanisms sponge larvae use to become adult sponges?
Borisenko, I., Podgornaya, O. I., & Ereskovsky, A. V. (2019) · Advances in protein chemistry and structural biology · doi:10.1016/bs.apcsb.2019.02.002 · Cited by 8
Predicting protein–protein interactions in the post synaptic density
Bar-Shira, O., & Chechik, G. (2013) · Molecular and Cellular Neuroscience · doi:10.1016/j.mcn.2013.04.004 · Cited by 7
Evolutionary origins of chemical synapses
Ovsepian, S. V., O’Leary, V. B., & Vesselkin, N. P. (2020) · Vitamins and hormones · doi:10.1016/bs.vh.2020.04.009 · Cited by 10
Colgren, J. J., & Burkhardt, P. (2025) · Nature reviews. Neuroscience · doi:10.1038/s41583-025-00983-6 · Cited by 7
Dynamic self-guiding analysis of Alzheimer's disease
Kurakin, A. V., & Bredesen, D. E. (2015) · Oncotarget · doi:10.18632/oncotarget.4221 · Cited by 8
Do thermal treatments influence the ultrafast opto-thermal processes of eumelanin?
Brunetti, A., Arciuli, M., Triggiani, L., Sallustio, F., Gallone, A., & Tommasi, R. (2019) · European Biophysics Journal · doi:10.1007/s00249-018-1342-y · Cited by 7
Back Through Time: How Cnidarians and Basal Metazoans Shed Light on Ancient Nervous Systems
Watanabe, H. (2017) · Diversity and commonality in animals · doi:10.1007/978-4-431-56469-0_3 · Cited by 8
Molecular Responses of Sponges to Climate Change
Aguilar-Camacho, J. M., & McCormack, G. P. (2017) · Springer eBooks · doi:10.1007/978-3-319-59008-0_4 · Cited by 7
The Evolutionary Origin of Nervous Systems and Implications for Neural Computation
Monk, T. (2014) · Otago University Research Archive (University of Otago) · Cited by 7
Cavalier‐Smith, T. (2017) · Philosophical Transactions of the Royal Society B Biological Sciences · doi:10.1098/rstb.2017.0336 · Cited by 6
Gaidos, E. J., & Knoll, A. H. (2012) · Cambridge University Press eBooks · doi:10.1017/cbo9780511902574.011 · Cited by 6
Invertebrate Genomics Provide Insights Into the Origin of Synaptic Transmission
Abrams, T. W., & Sossin, W. S. (2018) · Oxford University Press eBooks · doi:10.1093/oxfordhb/9780190456757.013.4 · Cited by 6
Basal Metazoan Sensory Evolution
Jacobs, D. K., Gold, D. A., Nakanishi, N., Yuan, D., Camara, A., Nichols, S., & Hartenstein, V. (2010) · Science Publishers eBooks · doi:10.1201/b10425-11 · Cited by 6
Kenny, N. J., Francis, W. R., Rivera-Vicéns, R. E., Juravel, K., de Mendoza, A., Díez-Vives, C., Lister, R., Bezares-Calderon, L., Grombacher, L., Roller, M., et al. (2020) · bioRxiv (Cold Spring Harbor Laboratory) · doi:10.1101/2020.02.18.954784 · Cited by 6
A history of Evo-Devo research in Spain
Baguñ, J. (2009) · The International Journal of Developmental Biology · doi:10.1387/ijdb.072427jb · Cited by 5
Model Systems for Exploring the Evolutionary Origins of the Nervous System
Whitmer, K. M. H. (2018) · Results and problems in cell differentiation · doi:10.1007/978-3-319-92486-1_10 · Cited by 5
van Elburg, R. A. J., de Wiljes, O. O., Biehl, M. L., & Keijzer, F. (2012) · arXiv (Cornell University) · doi:10.48550/arxiv.1212.3470 · Cited by 5
Fraction of life-bearing planets on which intelligent life emerges, fi, 1961 to the present
Marino, L. (2015) · Cambridge University Press eBooks · doi:10.1017/cbo9781139683593.013 · Cited by 3
Constraints of Biological Neural Networks and Their Consideration in AI Applications
Stafford, R. (2009) · Advances in Artificial Intelligence · doi:10.1155/2010/845723 · Cited by 4
Rendsvig, J. K. H., Futyma, M. E., Jarczynska, Z. D., & Mortensen, U. H. (2020) · Springer eBooks · doi:10.1007/978-3-030-49924-2_10 · Cited by 4
Sponges as sensitive animals: sensory systems and energetics of filtration in demosponges
Ludeman, D. A. (2015) · ERA: Education and Research Archive (University of Alberta) · doi:10.7939/r3rx93n3m · Cited by 4
Evolution of neuroglia: From worm to man
Pękowska, A., Verkhratsky, A., & Falcone, C. (2025) · Handbook of clinical neurology · doi:10.1016/b978-0-443-19104-6.00004-8 · Cited by 3
Introduction to the Global Scenario of Marine Sponge Research
Bramhachari, P. V., Ehrlich, H., & Pallela, R. (2016) · Springer eBooks · doi:10.1007/978-81-322-2794-6_1 · Cited by 3
Schlosser, G. (2020) · Elsevier eBooks · doi:10.1016/b978-0-12-809324-5.24136-9 · Cited by 3
Hehmeyer, J., Plessier, F., & Marlow, H. Q. (2024) · Annual Review of Cell and Developmental Biology · doi:10.1146/annurev-cellbio-111822-124041 · Cited by 3
Low and high voltage electroporation of in vitro human ovarian adenocarcinoma cells
Sundararajan, R., Natarajan, A., Sankaranarayanan, K., Reece, L. M., & Vernon, B. L. (2014) · Elsevier eBooks · doi:10.1533/9781908818294.199 · Cited by 3
Phylogenetic Inference for Multidomain Proteins
Stolzer, M. (2011) · KiltHub Repository · doi:10.1184/r1/6721055 · Cited by 3
Literature Review and Commentary
Begemann, G. (2011) · Zebrafish · doi:10.1089/zeb.2011.9998 · Cited by 3
Exaptation and functional shift in evolutionary computing
Graham, L. (2009) · doi:10.22215/etd/2009-06169 · Cited by 3
Temporal Relativism and the Objective Present
Smith, S.-A. (2021) · Journal of Posthuman Studies · doi:10.5325/jpoststud.5.1.0039 · Cited by 2
Zhan, L., Deng, W., Bao, L., Lv, Q., Ma, C., Li, F., Xu, L., & Qin, C. (2012) · Indian Journal of Virology · doi:10.1007/s13337-012-0076-1 · Cited by 2
Preface to Molluscan Neurobiology: Recent Advances and New Vistas
Katz, P. S. (2009) · Brain Behavior and Evolution · doi:10.1159/000258663 · Cited by 2
Visual Neuroscience: Retinotopy Meets Percept-otopy?
Huk, A. C. (2008) · Current Biology · doi:10.1016/j.cub.2008.09.015 · Cited by 2
Nickel, M. (2010) · Science Publishers eBooks · doi:10.1201/b10425-8 · Cited by 2
"A Key Innovation in Animal Evolution, the Emergence of Neurogenesis
Galliot, B. (2010) · Science Publishers eBooks · doi:10.1201/b10425-9 · Cited by 3
Development of sponges from the class Demospongiae Sollas, 1885
Ereskovsky, A. V. (2010) · Springer eBooks · doi:10.1007/978-90-481-8575-7_3 · Cited by 2
Can host reaction animal models be used to predict and modulate skin regeneration?
Santos, T. C., Reis, R. L., & Marques, A. P. (2016) · Journal of Tissue Engineering and Regenerative Medicine · doi:10.1002/term.2128 · Cited by 2
Perspective—Evolution of Neural Cell Types
Arendt, D. (2015) · doi:10.1093/acprof:oso/9780199682201.003.0004 · Cited by 2
Aspects of the Ongoing Debate on Animal Communication. (Zoo)semiotics and Cognitive Ethology
Gensini, S. (2019) · Perspectives in pragmatics, psychology & philosophy · doi:10.1007/978-3-030-22090-7_13 · Cited by 2
Genotyping Individual Amphimedon Embryos, Larvae, and AdultsPreprint
Degnan, B. M., Craigie, A., & Degnan, B. M. (2008) · Cold Spring Harbor Protocols · doi:10.1101/pdb.prot5098 · Cited by 2
Self-citationCadherin evolution and the origin of animals
Sigg, M. A. (2010) · eScholarship (California Digital Library) · Cited by 2
Early evolution of the LIM homeobox gene family
Srivastava, M., Larroux, C., Lu, D. R., Mohanty, K., Chapman, J., Degnan, B. M., & Rokhsar, D. S. (2010) · BMC Biology · doi:10.1186/1741-7007-8-4 · Cited by 1
Self-citationSensory perception in marine larvae
Modepalli, V. (2025) · Advances in marine biology · doi:10.1016/bs.amb.2025.09.003 · Cited by 1
Evolution of the Tri-PDZ Domain in PSD95 (DLG-4 Gene)
Nilkant, R., Mesrop, L. Y., Lobo, S., Sakarya, O., Shea, J., Shell, M. S., Yi, S. V., & Kosik, K. S. (2025) · Molecular Biology and Evolution · doi:10.1093/molbev/msaf309 · Cited by 1
Self-citationHartenstein, V., Sprecher, S., & Martinez, P. (2025) · Elsevier eBooks · doi:10.1016/b978-0-443-27380-3.00043-9 · Cited by 1
Ferrier, D. E. K., & Martı́nez, P. (2009) · Genomics · doi:10.1016/j.ygeno.2009.07.001 · Cited by 1
Galliot, B. (2010) · Archive ouverte UNIGE (University of Geneva) · Cited by 1
Phanerozoic evolution—Ediacaran biota
Cabej, N. R. (2019) · Elsevier eBooks · doi:10.1016/b978-0-12-814311-7.00002-0 · Cited by 2
Leys, S. P., & Farrar, N. R. (2015) · Oxford University Press eBooks · doi:10.1093/acprof:oso/9780199682201.003.0003 · Cited by 1
Smith, S.-A. (2023) · Journal of Posthuman Studies · doi:10.5325/jpoststud.7.1.0080 · Cited by 2
Evolutionary Distribution of the δ-Opioid Receptor: From Invertebrates to Humans
Hinchliffe, T. E., & Xia, Y. (2015) · Springer eBooks · doi:10.1007/978-3-319-25495-1_3 · Cited by 1
Pretorius, M. (2016) · HTS Teologiese Studies / Theological Studies · doi:10.4102/hts.v72i4.3472 · Cited by 1
Cabej, N. R. (2019) · Elsevier eBooks · doi:10.1016/b978-0-12-814311-7.00001-9 · Cited by 1
Andrade, M. P., Santos, D., Bueno, G. M., & Santos, C. M. D. (2021) · Evolutionary Biology · doi:10.1007/s11692-021-09551-z · Cited by 1
Outline of a new approach to the nature of mindPreprint
Gelepithis, P. A. M. (2009) · CogPrints (University of Southampton) · Cited by 1
Literature Review and Commentary
Begemann, G. (2008) · Zebrafish · doi:10.1089/zeb.2008.9985 · Cited by 1
Ivanišević, J. (2011) · theses.fr (ABES) · doi:10.70675/6797e502z87aaz4438z85eez039ab1ede89b · Cited by 1
Baguñà, J. (2009) · RACO (Revistes Catalanes amb Accés Obert) (Consorci de Serveis Universitaris de Catalunya)
Evolution and Individual Development of Sponges: Regularities and Directions
Ereskovsky, A. V. (2010) · Springer eBooks · doi:10.1007/978-90-481-8575-7_7
Animal Models of Behavioral and Neural Plasticity
de Belle, J. S. (2008) · Advances in psychology · doi:10.1016/s0166-4115(08)10018-8
Hbv X Protein: Elucidating a Role in Oncogenesis
Feitelson, M. A., Reis, H. M. G. P. V., Pan, J., Clayton, M. M., Sun, B. S., Şatıroğlu-Tufan, N. L., & Lian, Z. (2008) · Future Virology · doi:10.2217/17460794.3.5.455
Insights from Sponge Transcriptomes & Physiology about the Early Evolution of Nervous Systems
Farrar, N. R. (2014) · ERA: Education and Research Archive (University of Alberta) · doi:10.7939/r3183485q
Ruggiero, R. N., Bueno-Júnior, L. S., Ross, J. B. D., Fachim, H., Padovan‐Neto, F. E., Merlo, S., Rohner, C. J. S., Ikeda, E. T., Brusco, J., & Moreira, J. E. (2011)
Nichols, S. (2016) · Elsevier eBooks · doi:10.1016/b978-0-12-800049-6.00268-7
From Cnidaria to “Higher Metazoa” in One Step
Boero, F., & Piraino, S. (2010) · Science Publishers eBooks · doi:10.1201/b10425-10
МИТОХОНДРИЈАЛНИ ГЕНОМИ КЛАСЕ DEMOSPONGIAE SOLLAS 1885
Елез-Бурњаковић, Н., Smajlović, A., & Kulić, M. (2016) · СИМПОЗИЈУМ БИОЛОГА И ЕКОЛОГА РЕПУБЛИКЕ СРПСКЕ · doi:10.7251/pmfskup1607065e
Johard, L., Lippi, V., Safina, L., & Mazzara, M. (2017) · Advances in computational intelligence and robotics book series · doi:10.4018/978-1-5225-1947-8.ch004
A membrana e seus canais: um modelo computacional de neurônio.
Correale, T. G. (2017) · Digital Library of Theses and Dissertations (Universidade de São Paulo) · doi:10.11606/t.3.2017.tde-28062017-095334
Sica, R. E. P., Caccuri, R. L., Quarracino, C., & Capani, F. (2016)
Singh, R. (2018) · Journal of Morphological Sciences · doi:10.1055/s-0038-1675617
From skin to brain: modelling a whole-body coordination scenario of nervous system origin
de Wiljes, O. (2020) · University of Groningen research database (University of Groningen / Centre for Information Technology) · doi:10.33612/diss.123420732
Striedter, G. F., & Northcutt, R. G. (2019) · Oxford University Press eBooks · doi:10.1093/oso/9780195125689.003.0001
原, 成. (2012) · 日本プランクトン学会報 · doi:10.24763/bpsj.59.1_35
Raible, F., & Steinmetz, P. R. H. (2010) · Springer eBooks · doi:10.1007/978-90-481-8639-6_5
Evolution of Metazoans and Their Control System
Cabej, N. R. (2011) · Elsevier eBooks · doi:10.1016/b978-0-12-415831-3.00012-4
Imagerie médicale et création artistique
Hasbani-Villard, M. (2013) · doi:10.70675/3b26671eza51ez444bza4b6z57d1261ce694
Developmental Expression of Transcription Factors and Wnt Ligands in Sponge Halisarca Dujardinii
Borisenko, I., Shaporev, D., & Ereskovsky, A. V. (2026) · Molecular Reproduction and Development · doi:10.1002/mrd.70121
Counting Your Chickens Before They Hatch: A Framework for Responsible AI Consciousness Development
Robichaud, C. (2026) · Zenodo (CERN European Organization for Nuclear Research) · doi:10.5281/zenodo.19152942
Structure and function of sea urchin neuropeptides
Rowe, M. L. (2010) · OpenGrey (Institut de l'Information Scientifique et Technique)
Metadata
- Authors
- Sakarya, O., Armstrong, K. A., Adamska, M., Adamski, M., Wang, I.-F., Tidor, B., Degnan, B. M., Oakley, T. H., & Kosik, K. S.
- Affiliations
- University of California, Santa Barbara (US)
- MIT Computer Science and Artificial Intelligence Laboratory (US)
- The University of Queensland (AU)
- Corresponding author
- Kosik, Kenneth S.
- ORCID
- Venue
- PLoS ONE
- Publisher
- Public Library of Science (PLoS)
- Published
- 2007-06-06
- Volume
- 2
- Issue
- 6
- Pages
- e506
- ISSN
- 1932-6203 (ISSN-L)
- PMC
- PMC1876816
- OpenAlex
- W2079236594
- Cited by
- 291
- References
- 52
- Citations by year
- 2026: 2 · 2025: 5 · 2024: 6 · 2023: 2 · 2022: 3 · 2021: 8 · 2020: 13 · 2019: 15 · 2018: 8 · 2017: 16 · 2016: 21 · 2015: 28 · 2014: 20 · 2013: 12 · 2012: 18
- FWCI
- 24.18
- Type
- journal article
- Language
- en
- Open access
- gold
- doi.org
- Locations
- PLoS ONE (publishedVersion, cc-by)
- PubMed Central (publishedVersion, cc-by)
- PubMed (publishedVersion)
- DOAJ (DOAJ: Directory of Open Access Journals) (submittedVersion, cc-by-sa)
- Figshare (submittedVersion, cc-by)
- OSTI OAI (U.S. Department of Energy Office of Scientific and Technical Information) (submittedVersion)
- Funders
- U.S. Department of Energy
- Joint Genome Institute
- Topics
- Life Sciences › Agricultural and Biological Sciences › Animal Science and Zoology › Marine Invertebrate Physiology and Ecology
- Life Sciences › Neuroscience › Cellular and Molecular Neuroscience › Neuroscience and Neuropharmacology Research
- Life Sciences › Biochemistry, Genetics and Molecular Biology › Molecular Biology › Developmental Biology and Gene Regulation
- Keywords
- sponge genome, Amphimedon queenslandica, PDZ domain, protein interaction motifs, ionotropic glutamate receptors, Eumetazoa, protein complex formation
- MeSH terms
- Animals, Humans, Nerve Tissue Proteins, Porifera, Synapses, Genome, Evolution, Molecular
About these checks
Registry, retraction, Cites and statistics results are computed, not judged, with one exception: a printed reference that no index lists is read once by a model before it counts as a citation error. Claims are extracted by a model and kept only when their quote appears verbatim in the text; each cited source is then checked, with a model’s help, for whether it says what the claim relies on. Those verdicts can be wrong — read the claim’s quote and the cited source before relying on one.
Statistics and arithmetic are recomputed, not judged.
Confidence bands are shown only for fields calibrated on our annotated test set. None is calibrated yet, so no band is shown.
What counts as a claim ›How we measure confidence ›How we check this ›
Are you an author, or do you see a problem with this page? Request a review
