

The DOI matches its Crossref record; 60 of the 62 references it cites were found in a registry or an index.
Sex-Related Differences in Gene Expression in Human Skeletal Muscle
Open accessAbstract
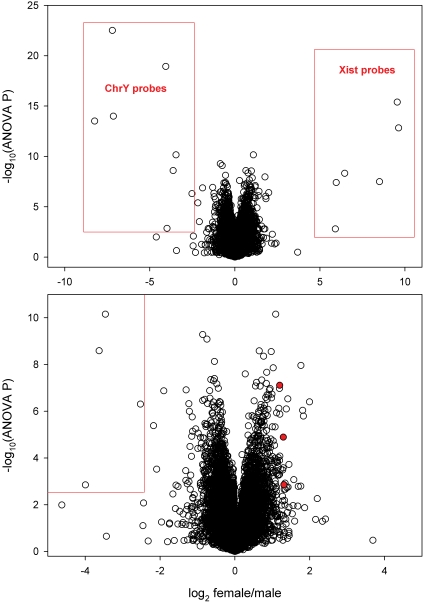
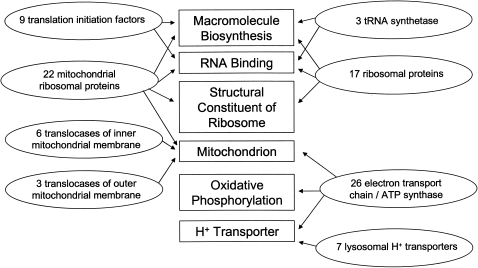
There is sexual dimorphism of skeletal muscle, the most obvious feature being the larger muscle mass of men. The molecular basis for this difference has not been clearly defined. To identify genes that might contribute to the relatively greater muscularity of men, we compared skeletal muscle gene expression profiles of 15 normal men and 15 normal women by using comprehensive oligonucleotide microarrays. Although there were sex-related differences in expression of several hundred genes, very few of the differentially expressed genes have functions that are obvious candidates for explaining the larger muscle mass of men. The men tended to have higher expression of genes encoding mitochondrial proteins, ribosomal proteins, and a few translation initiation factors. The women had >2-fold greater expression than the men (P<0.0001) of two genes that encode proteins in growth factor pathways known to be important in regulating muscle mass: growth factor receptor-bound 10 (GRB10) and activin A receptor IIB (ACVR2B). GRB10 encodes a protein that inhibits insulin-like growth factor-1 (IGF-1) signaling. ACVR2B encodes a myostatin receptor. Quantitative RT-PCR confirmed higher expression of GRB10 and ACVR2B genes in these women. In an independent microarray study of 10 men and 9 women with facioscapulohumeral dystrophy, women had higher expression of GRB10 (2.7-fold, P<0.001) and ACVR2B (1.7-fold, P<0.03). If these sex-related differences in mRNA expression lead to reduced IGF-1 activity and increased myostatin activity, they could contribute to the sex difference in muscle size.
Overview
The claims and statistics of this paper haven’t been checked yet.
Run the check — free, no account needed. It reads the open-access text and checks the sources it cites.
Integrity signals
Registry
Cites
Statistics
Figures
Verification
Claims the paper makes
The claims and statistics of this paper haven’t been checked yet.
Run the check — free, no account needed. It reads the open-access text and checks the sources it cites.
Claims other papers make about this one
Each is checked against this paper’s own text: does it say what the citing paper says it does?
In the citing paper
“Previous studies have identified over 3,000 genes that are differentially expressed in male and female skeletal muscle.”
From Sex-Based Differences in Skeletal Muscle Kinetics and Fiber-Type Composition (2015) · cites this paper as [96]
In the citing paper
“Analysis of mRNA from both male and female vastus lateralis biopsies by microarray shows (when normalized to α-actinin) that the female muscle has 35% more MyHC-I/β, 30% less MyHC-IIa, and 15% less MyHC-IIx mRNA than the corresponding male muscle (96).”
From Sex-Based Differences in Skeletal Muscle Kinetics and Fiber-Type Composition (2015) · cites this paper as [96]
In the citing paper
“In this study, the authors focus on two particular genes that are upregulated in women compared with men and that are known to code for proteins that are in signaling pathways of growth factors known to regulate muscle mass: growth factor receptor-bound protein 10 (GRB10) and activin receptor type-2A (ACVR2A).”
From Sex-Based Differences in Skeletal Muscle Kinetics and Fiber-Type Composition (2015) · cites this paper as [96]
In the citing paper
“The identification of over 3,000 genes differentially regulated in male and female muscle highlights the complex differences that occur in skeletal muscle from both sexes (96).”
From Sex-Based Differences in Skeletal Muscle Kinetics and Fiber-Type Composition (2015) · cites this paper as [96]
Self-check
Percentages, sums and reported differences re-computed from the paper’s own numbers.
The self-check needs the paper’s full text.
Citations
Cites
Subramanian, A., Tamayo, P., Mootha, V. K., Mukherjee, S., Ebert, B. L., Gillette, M. A., Paulovich, A., Pomeroy, S. L., Golub, T. R., Lander, E. S., et al. (2005) · Proceedings of the National Academy of Sciences · doi:10.1073/pnas.0506580102 · Cited by 53,625
In silico prediction of protein-protein interactions in human macrophages
Souiai, O., Guerfali, F. Z., Miled, S. B., Brun, C., & Benkahla, A. (2014) · BMC Research Notes · doi:10.1186/1756-0500-7-157 · Cited by 10,785
Exploration, normalization, and summaries of high density oligonucleotide array probe level data
Irizarry, R. A. (2003) · Biostatistics · doi:10.1093/biostatistics/4.2.249 · Cited by 10,603 · cited 5×
“This method was chosen after comparing it the standard Affymetrix method, a modified version of the Affymetrix comparison analysis algorithm that was used for our analyses of age-related differences [53], and RMA [54], because it had the best performance in accounting for non-specific hybridization (expression scores…”
InfluentialSignificance analysis of microarrays applied to the ionizing radiation response
Tusher, V. G., Tibshirani, R., & Chu, G. (2001) · Proceedings of the National Academy of Sciences · doi:10.1073/pnas.091062498 · Cited by 10,568
Regulation of skeletal muscle mass in mice by a new TGF-p superfamily member
McPherron, A. C., Lawler, A. M., & Lee, S.-J. (1997) · Nature · doi:10.1038/387083a0 · Cited by 4,013 · cited 1×
“Myostatin has a major role in determining muscle size. Constitutive myostatin knockout in mice leads to a hypermuscular phenotype caused by an increased number of fibers and fiber enlargement”
BackgroundSandri, M., Sandri, C., Gilbert, A., Skurk, C., Calabria, E., Picard, A., Walsh, K., Schiaffino, S., Lecker, S. H., & Goldberg, A. L. (2004) · Cell · doi:10.1016/s0092-8674(04)00400-3 · Cited by 3,012 · cited 1×
“In its active non-phosphorylated state, this transcription factor stimulates expression of the ubiquitin ligase atrogin-1 (also known as MAFbx or F-box protein 32) [47].”
Identifying biological themes within lists of genes with EASE
Hosack, D. A., Dennis, G., Sherman, B. T., Lane, H. C., & Lempicki, R. A. (2003) · Genome biology · doi:10.1186/gb-2003-4-10-r70 · Cited by 1,961 · cited 4×
“The EASE program (Version 2.0) was provided by the National Institutes of Health [27].”
InfluentialMultiple types of skeletal muscle atrophy involve a common program of changes in gene expression
Lecker, S. H., Jagoe, R. T., Gilbert, A., Gomes, M., Baracos, V., Bailey, J., Price, S. R., Mitch, W. E., & Goldberg, A. L. (2004) · The FASEB Journal · doi:10.1096/fj.03-0610com · Cited by 1,539 · cited 1×
“Atrogin-1 is upregulated under conditions associated with muscle atrophy [48].”
Myostatin Mutation Associated with Gross Muscle Hypertrophy in a Child
Schuelke, M., Wagner, K. R., Stolz, L. E., Hübner, C., Riebel, T., Kömen, W., Braun, T., Tobin, J. F., & Lee, S.-J. (2004) · New England Journal of Medicine · doi:10.1056/nejmoa040933 · Cited by 1,399
Skeletal muscle hypertrophy and atrophy signaling pathways
Glass, D. J. (2005) · The International Journal of Biochemistry & Cell Biology · doi:10.1016/j.biocel.2005.04.018 · Cited by 1,106 · cited 1×
“It is well accepted that IGF-1 has an anabolic effect on muscle [28].”
Cited by
Sorted by citations
Items 101–200 of 224
Yoshihara, T., Takaragawa, M., Dobashi, S., & Naıto, H. (2022) · The Journal of Physiological Sciences · doi:10.1186/s12576-022-00830-8 · Cited by 16
Xu, L., Mei, T.-T., Cai, Y.-Q., Chen, W., Zheng, S., Wang, L., Chen, X.-D., & Huang, Y. (2022) · Frontiers in Oncology · doi:10.3389/fonc.2022.851091 · Cited by 15
“This may be explained by the sexual dimorphism of skeletal muscle mass that is attributed to differences in hormone levels and gene expression between males and females (36, 37) and can also lead to differences in muscle loss associated with aging.”
BackgroundZhou, E. F. M., Wong, A. Y. L., Zheng, Y., Lam, K. H. S., & Fu, S. N. (2024) · Ultrasound in Medicine & Biology · doi:10.1016/j.ultrasmedbio.2023.12.021 · Cited by 15
Noh, K.-W., Seo, E.-K., & Park, S. (2024) · Medicina · doi:10.3390/medicina60071186 · Cited by 15
Wood, N., Critchlow, A. J., Cheng, C. W., Straw, S., Hendrickse, P. W., Pereira, M. G., Wheatcroft, S. B., Egginton, S., Witte, K. K., Roberts, L. D., et al. (2024) · Circulation Heart Failure · doi:10.1161/circheartfailure.123.011471 · Cited by 17
Acevedo, L. M., Raya, A. I., Ríos, R., Aguilera‐Tejero, E., & Rivero, J. L. L. (2017) · Journal of Applied Physiology · doi:10.1152/japplphysiol.00282.2017 · Cited by 15
“Female rats were selected because of the broader role that testosterone plays in the maintenance of skeletal muscle phenotype compared with estrogens and progestins (62) and also because serum testosterone levels are diminished in the genetically obese male Zucker rat (66).”
BackgroundLiu, T., Yi, X., Ge, J., Zhang, J., Tan, F., Song, K., Liu, H., & Tang, M. L. K. (2022) · Frontiers in Nutrition · doi:10.3389/fnut.2022.884586 · Cited by 14
“One reason for the sex difference might be the discrepancy in muscle and fat mass between men and women, since testosterone level which has an anabolic effect on the muscle is higher in men (29).”
BackgroundExtensive differential gene expression and regulation by sex in human skeletal muscle
Hanks, S. C., Mauger, A. S., Varshney, A., Ciotlos, D. L., Manickam, N., Narisu, N., Shumway, A. J., Orchard, P., Erdos, M. R., Sweeney, M. D., et al. (2025) · Cell Genomics · doi:10.1016/j.xgen.2025.100915 · Cited by 12
Exercise Physiology in Men and Women
Lundsgaard, A., Fritzen, A. M., & Kiens, B. (2017) · Principles of Gender-Specific Medicine · doi:10.1016/b978-0-12-803506-1.00017-6 · Cited by 14
Longman, D. P., Dolan, E., Wells, J. C. K., & Stock, J. T. (2023) · Comparative Biochemistry and Physiology Part A Molecular & Integrative Physiology · doi:10.1016/j.cbpa.2023.111422 · Cited by 14
“This may be due to female athletes ’ increased adiposity (Wells, 2006), reduced muscle mass (Welle et al., 2008), reduced thermosensitivity in the whole-body sudomotor response when hot (Gagnon and Kenny, 2011) and reduced sweat gland output at high exercise intensity (Gagnon and Kenny, 2012)…”
BackgroundOnambélé-Pearson, G. L., Tomlinson, D. J., Morse, C. I., & Degens, H. (2021) · PLoS ONE · doi:10.1371/journal.pone.0250813 · Cited by 13
“What is also widely known is that there are over 3000 genes that are differentially expressed in males vs female skeletal muscle [9].”
BackgroundPark, M. A., Whelan, C. J., Ahmed, S., Boeringer, T., Brown, J. S., Carson, T., Crowder, S. L., Gage, K. L., Gregg, C. J., Jeong, D. K., et al. (2024) · Cancers · doi:10.3390/cancers16132364 · Cited by 12
“Retreat participants reviewed current therapeutic approaches and recognized that while working to fill the unmet need for FDA-approved pharmaceutical agents [4,5], great merit exists for the continued development and testing of, (a) novel CAC animal model systems, (b) nonpharmaceutical…”
BackgroundDivergent multiomic acute exercise responses reveal the impact of sex as a biological variable
Lavin, K. M., O’Bryan, S. M., Pathak, K. V., Garcia‐Mansfield, K., Graham, Z., McAdam, J. S., Drummer, D. J., Bell, M. B., Kelley, C. J., Lixandrão, M. E., et al. (2025) · Physiological Genomics · doi:10.1152/physiolgenomics.00055.2024 · Cited by 14
Kataoka, R., Spitz, R. W., Wong, V. H. Y., Bell, Z. W., Yamada, Y., Song, J. S., Hammert, W. B., Dankel, S. J., Abe, T., & Loenneke, J. P. (2023) · American Journal of Human Biology · doi:10.1002/ajhb.23862 · Cited by 12
“…function (Inglis & Gabriel, 2020; Trevino et al., 2019), and gene expression (Welle et al., 2008) may exist between males and females, “relative” strength might be similar between sexes (Bishop et al., 1987; Castro et al., 1995; Heyward et al., 1986; Schantz et al., 1983; Welle et al., 2008).”
BackgroundFemale excellence in rock climbing likely has an evolutionary origin
Carroll, C. (2021) · Current Research in Physiology · doi:10.1016/j.crphys.2021.01.004 · Cited by 11
Uncovering hidden duplicated content in public transcriptomics data
Rosikiewicz, M., Comte, A., Niknejad, A., Robinson‐Rechavi, M., & Bastian, F. (2013) · Database · doi:10.1093/database/bat010 · Cited by 12
“Yet this information is not available to automatic tools; in the majority of cases, the authors did not update the first experiment submitted to add links to the later one (i.e. GSE9676 has no link to GSE10760).”
MethodLongman, D. P., Murray, A. A., Roberts, R., Oakley, S., Wells, J. C. K., & Stock, J. T. (2021) · Evolutionary Human Sciences · doi:10.1017/ehs.2021.17 · Cited by 12
Acevedo, L. M., Peralta-Ramírez, A., López, I., Chamizo, V. E., Pineda, C., Rodríguez-Ortiz, M. E., Rodríguez, M., Aguilera‐Tejero, E., & Rivero, J. L. L. (2015) · American Journal of Physiology-Renal Physiology · doi:10.1152/ajprenal.00195.2015 · Cited by 11
Bolsterlee, B., Chow, B. V. Y., Yu, J., Davies, S. R., Morgan, C., Rae, C. D., Warton, D. I., Novak, I., Lancaster, A., Popovic, G. C., et al. (2025) · Proceedings of the National Academy of Sciences · doi:10.1073/pnas.2416660122 · Cited by 10
“Sex differences in muscle size are due to genetic factors ( 39 ), but could also be explained by differences in activity levels.”
Effects of Resistance Exercise on Older Individuals with Sarcopenia: Sex Differences in Humans
Noh, K.-W., & Park, S. (2023) · Exercise Science · doi:10.15857/ksep.2023.00346 · Cited by 8
“Men possess more skeletal muscle than women, which contributes to greater maximal muscle strength [68,69].”
BackgroundCasciaro, F., Persico, G., Rusin, M., Amatori, S., Montgomery, C. B., Rutkowsky, J. M., Ramsey, J. J., Cortopassi, G. A., Fanelli, M., & Giorgio, M. (2021) · Epigenomes · doi:10.3390/epigenomes5040026 · Cited by 9
“These results indicate that sex differences of histone modifications distribution in the cortex of PSAPP mice occur to a lesser extent in comparison to the gastrocnemius, whose fiber composition and gene expression is influenced by sex [36,37].”
BackgroundThe importance of biological sex in cardiac cachexia
Holder, E. R., Alibhai, F. J., Caudle, S. L., McDermott, J. C., & Tobin, S. W. (2022) · American Journal of Physiology-Heart and Circulatory Physiology · doi:10.1152/ajpheart.00187.2022 · Cited by 9
Furse, S., Morgan, H. L., Koulman, A., & Watkins, A. J. (2023) · International Journal of Molecular Sciences · doi:10.3390/ijms24031814 · Cited by 13
“In addition, the sexual dimorphic patterns of gene expression have been reported in rodent and human tissues including the heart [54], skeletal muscle [55] and brain [56].”
BackgroundNoh, K.-W., & Park, S. (2023) · Physical Activity and Nutrition · doi:10.20463/pan.2023.0033 · Cited by 10
“Males have more skeletal muscles than females, which contributes to greater maximum muscle strength in males 76,77 .”
BackgroundJung, J., & Im, Y.-G. (2022) · CRANIO® · doi:10.1080/08869634.2022.2142234 · Cited by 9
“Slow type I and -IIA fibers associated with lower contractile velocity are more prevalent in women than men [35].”
Landen, S., Jacques, M., Hiam, D., Alvarez‐Romero, J., Harvey, N. R., Haupt, L. M., Griffiths, L. R., Ashton, K. J., Lamon, S., Voisin, S. A. C., et al. (2021) · bioRxiv (Cold Spring Harbor Laboratory) · doi:10.1101/2021.03.16.435733 · Cited by 9
Luigi, L. D., Antinozzi, C., Duranti, G., Dimauro, I., & Sgrò, P. (2023) · International Journal of Molecular Sciences · doi:10.3390/ijms242417382 · Cited by 8
“…is scarcity of in vitro studies considering the sex-chromosome-related approach in the investigation of muscle endocrine physiology and responses to anabolic hormones [3–6]. sex-chromosome-related approach in the investigation of muscle endocrine physiology and responses to anabolic hormones [3–6].”
BackgroundIdentifying gender independent biomarkers responsible for human muscle aging using microarray data
Sifakis, E. G., Valavanis, I. K., Papadodima, O., & Chatziioannou, A. A. (2013) · IEEE International Conference on Bioinformatics and Bioengineering (BIBE) · doi:10.1109/bibe.2013.6701530 · Cited by 8
Sexual Dimorphism in Laryngeal Volumetric Measurements Using Magnetic Resonance Imaging
Hamdan, A., Khalifee, E., Ziade, G., & Semaan, S. (2019) · Ear Nose & Throat Journal · doi:10.1177/0145561319840568 · Cited by 8
Ouali, E. M. E., Bosquet, L., Elgharbaoui, B., Laziri, F., Laher, I., Hackney, A. C., Ibrahimi, A., Taïb, B., Harane, S. E., Weiss, K., et al. (2023) · Frontiers in Physiology · doi:10.3389/fphys.2023.1256440 · Cited by 9
Paul, R. G., McMahon, C. D., Elston, M. S., & Conaglen, J. V. (2018) · Growth Hormone & IGF Research · doi:10.1016/j.ghir.2018.12.001 · Cited by 8
Skeletal Muscle Transcriptomic Comparison Between Men and Women in Response to Acute Sprint Exercise
Nie, M., Liu, Q., & Yan, C. (2022) · Frontiers in Genetics · doi:10.3389/fgene.2022.860815 · Cited by 8
Emmert, M. E., Aggarwal, P., Shay‐Winkler, K., Lee, S., Goh, Q., & Cornwall, R. (2022) · eLife · doi:10.7554/elife.81121 · Cited by 8
Role of Peptides in Skeletal Muscle Wasting: A Scoping Review
Naumovski, P., Spiegeleer, B. M. J. D., Garedow, A. W., de Wiele, C. V., Mouly, V., Goljanek‐Whysall, K., da Costa, K. S., de Oliveira, E. C. L., Wynendaele, E., & Spiegeleer, A. D. (2025) · Journal of Cachexia Sarcopenia and Muscle · doi:10.1002/jcsm.70109 · Cited by 7
Liu, Q., Li, R., Chen, G., Wang, J., Hu, B., Li, C., Zhu, X., & Lu, Y. (2019) · Molecular Medicine Reports · doi:10.3892/mmr.2019.10189 · Cited by 7
Sesillo, F. B., Rajesh, V., Wong, M., Duran, P., Rudell, J. B., Rundio, C. P., Baynes, B. B., Laurent, L. C., Sacco, A., Christman, K. L., et al. (2022) · npj Regenerative Medicine · doi:10.1038/s41536-022-00264-1 · Cited by 7
“At the transcriptional level, numerous genes involved in the regulation of muscle mass are differentially expressed in male vs. female muscles, resulting in abundant differences, including fi ber phenotype and contractility 16,17 .”
Fluctuating asymmetry, a marker of poor growth quality, is associated with adult male metabolic rate
Longman, D. P., Oyama, S., Cracknell, J., Thompson, N., Gordon, D. A., Stock, J. T., & Wells, J. C. K. (2021) · American Journal of Physical Anthropology · doi:10.1002/ajpa.24276 · Cited by 8
“(Welle et al., 2008) and lower fat mass relative to body weight (Wells, 2007) relative to women.”
BackgroundAcevedo, L. M., Vidal, Á., Aguilera‐Tejero, E., & Rivero, J. L. L. (2022) · American Journal of Physiology-Cell Physiology · doi:10.1152/ajpcell.00306.2022 · Cited by 6
Sexual Dimorphism in Substrate Metabolism During Exercise
Abo, S. M. C., Casella, E., & Layton, A. T. (2024) · Bulletin of Mathematical Biology · doi:10.1007/s11538-023-01242-4 · Cited by 6
“These differences are most prevalent in the liver, muscle, and adipose tissue (Gustafsson et al. 1983; Welle et al. 2008; Karastergiou et al. 2012).”
Yoshikawa, N., Oda, A., Yamazaki, H., Yamamoto, M., Souta-Kuribara, A., Uehara, M., & Tanaka, H. (2021) · Endocrine Research · doi:10.1080/07435800.2021.1884874 · Cited by 6
Gender disparities in myotonic dystrophy 1
Chakraborty, D., Borthakur, S., Sarkar, R., & Singh, M. D. (2025) · Life Sciences · doi:10.1016/j.lfs.2025.123659 · Cited by 5
Han, J. Y., Jang, W., & Park, J. (2022) · Genes · doi:10.3390/genes13081465 · Cited by 5
“Different characteristics of skeletal muscle tissue between males and females have been associated with significant differences in gene expression patterns and metabolic properties [50].”
BackgroundΤσεκούρα, Μ., Bakirtzi, S., Papadimitropoulou, S., Billis, E. V., Fousekis, K., Kastrinis, A., & Tsepis, E. (2023) · Advances in experimental medicine and biology · doi:10.1007/978-3-031-31986-0_48 · Cited by 6
Sex-Based Differences in Muscle Stem Cell Regulation Following Exercise
Beaudry, K. M., & Lisio, M. D. (2024) · Exercise and Sport Sciences Reviews · doi:10.1249/jes.0000000000000337 · Cited by 5
de Zevallos, J. O., Hogwood, A. C., Kruse, K., Guzman, J. D., Buckley, M., Lempke, A. F. D., WELTMAN, A. L., & Allen, J. D. (2024) · Journal of Applied Physiology · doi:10.1152/japplphysiol.00321.2024 · Cited by 5
Dorak, M. T. (2017) · Principles of Gender-Specific Medicine · doi:10.1016/b978-0-12-803506-1.00007-3 · Cited by 5
Sex Differences in Renal Cell Carcinoma: The Importance of Body Composition
Dahlmann, S., Bressem, K. K., Bashian, B., Ulas, S. T., Rattunde, M., Busch, F., Makowski, M. R., Ziegeler, K., & Adams, L. C. (2022) · Annals of Surgical Oncology · doi:10.1245/s10434-022-12738-z · Cited by 5
“to result from different hormone levels such as testosterone and estrogen, as well as differences in gene expression.(40) A previous study showed that older men experienced a higher”
ResultUzun, S., Barut, Z. I. O., Eren, B., Mağat, G., & Kurt, M. H. (2025) · BMC Oral Health · doi:10.1186/s12903-025-05990-8 · Cited by 4
“Masseter muscle thickness is affected by physical activity, the type, size and number of fibers that make up the muscles, genetic factors and androgenic steroids [40, 41].”
Androgen action on myogenesis throughout the lifespan; comparison with neurogenesis
Barsky, S. T., & Monks, D. A. (2023) · Frontiers in Neuroendocrinology · doi:10.1016/j.yfrne.2023.101101 · Cited by 6
Yang, C., & Côté, J. N. (2022) · BMC Musculoskeletal Disorders · doi:10.1186/s12891-022-05566-5 · Cited by 4
Sex-Specific Effects on Exercise Metabolism
Lundsgaard, A., Fritzen, A. M., & Kiens, B. (2022) · Physiology in health and disease · doi:10.1007/978-3-030-94305-9_15 · Cited by 4
Evangelista, T., Kandji, M., Lacène, E., Chanut, A., Bui, M. T., Marty, R., Buffat, L., Kenneth Knoblauch, B., Rudkin, B. B., & Romero, N. B. (2022) · EBioMedicine · doi:10.1016/j.ebiom.2022.104367 · Cited by 4
Himeda, C. L., Jones, T. I., & Jones, P. L. (2024) · Human Gene Therapy · doi:10.1089/hum.2024.041 · Cited by 4
“Genes in human muscle that are differentially expressed between the sexes fall mainly into pathways that regulate muscle mass and do not include Ckm. 28 Indeed, a recent transcriptomic study showed that Ckm was expressed equally between male and female mice.”
Zhang, Y., Li, Q., & Liu, J. (2025) · BMC Musculoskeletal Disorders · doi:10.1186/s12891-025-08528-9 · Cited by 4
Kennedy, A. P., Vasdev, S., Randell, E. W., Xie, Y., Green, K., Zhang, H., & Sun, G. (2009) · Clinical Medicine Insights Endocrinology and Diabetes · doi:10.4137/cmed.s2974 · Cited by 4
PROBE-LEVEL UNIVERSAL SEARCH (PLUS) ALGORITHM FOR GENDER DIFFERENTIATION IN AFFYMETRIX DATASETS
KARYAGYNA, A. S., Vasiliev, M. O., Ershova, A. S., Nurtdinov, R., & LOSSEV, I. S. (2010) · Journal of Bioinformatics and Computational Biology · doi:10.1142/s0219720010004823 · Cited by 4
Wang, J., Ma, S., Wu, Q., Xu, Q., Zhang, R., Bai, L., Li, L., & Liu, H. (2023) · British Poultry Science · doi:10.1080/00071668.2023.2176741 · Cited by 3
“In humans there is strong evidence which suggests sexual dimorphism exists in skeletal muscle, as the most apparent feature is the presence of larger muscle mass in males than in females (Welle et al. 2008).”
BackgroundThe role of genes and abuse in the etiology of offending
Vaske, J. C. (2009) · OhioLink ETD Center (Ohio Library and Information Network) · Cited by 3
Sex Differences in Murine Sternohyoid Muscle Tolerance of Acute Severe Hypoxic Stress
Lewis, P., & O’Halloran, K. D. (2016) · Physiological Research · doi:10.33549/physiolres.933169 · Cited by 3
“Welle et al. (2008) found hundreds of genes that are differentially expressed in male and female vastus lateralis muscle including several genes encoding metabolic proteins.”
BackgroundResistance exercise and mechanical overload upregulate vimentin for skeletal muscle remodeling
Godwin, J. S., Michel, J. M., Libardi, C. A., Kavazis, A. N., Fry, C. S., Frugé, A. D., McCashland, M., Vechetti, I. J., McCarthy, J. J., Mobley, C. B., et al. (2025) · American Journal of Physiology-Cell Physiology · doi:10.1152/ajpcell.01028.2024 · Cited by 2
Lee, E. H., Park, S., & Jeong, K. (2025) · Biogerontology · doi:10.1007/s10522-025-10238-7 · Cited by 2
“Furthermore, male and female skeletal muscles exhibit well-documented differences across multiple biological layers including transcriptomic, proteomic, and epigenetic profiles, as well as in their responses to exercise training (Landen et al. 2023; Landen et al. 2021; Welle et al. 2008).”
The hallmarks of skeletal muscle health
Vainshtein, A., Blaauw, B., Bock, K. D., Muñoz‐Cánoves, P., Olson, E. N., Ottenheijm, C. A. C., Richter, E. A., Ruas, J. L., Schaeffer, L., Spiegelman, B. M., et al. (2026) · Nature Metabolism · doi:10.1038/s42255-026-01595-9 · Cited by 4
“At the molecular level, thousands of genes are differentially expressed between male and female skeletal muscle 344 , influencing muscle characteristics such as fibre size, contractile properties, fibre-type composition and metabolic programming 345,346 .”
The novel candidate gene Grb10 regulates the growth performance of Guizhou white goats
Dai, L., Chen, X., An, D., Xiao, M., Huang, J., Xu, J., & Ruan, Y. (2024) · Small Ruminant Research · doi:10.1016/j.smallrumres.2024.107267 · Cited by 2
Puppa, M., & Carson, J. A. (2025) · Advances in experimental medicine and biology · doi:10.1007/978-3-031-88361-3_12 · Cited by 2
Vitai, M., Buday, B., Kulcsár, E., Literáti-Nagy, B., Vecsei, I., Bezzegh, K., Péterfai, É., Kurucz, I., & Koranyi, L. I. (2009) · Orvosi Hetilap · doi:10.1556/oh.2009.28729 · Cited by 2
Rossato, L. T., Barbosa, C. D., Nahas, P. C., Orsatti, F. L., & de Oliveira, E. P. (2018) · Clinical Nutrition ESPEN · doi:10.1016/j.clnesp.2018.01.069 · Cited by 2
Sex-Related Adaptation to Disuse-Induced Skeletal Muscle Wasting
Yoshihara, T. (2019) · Biomedical Journal of Scientific & Technical Research · doi:10.26717/bjstr.2019.14.002546 · Cited by 1
Determination of Complete Sequence Mutation of Myostatin Gene in Fast- and Slow-Growing Chicken
Khaerunnisa, I., Furqon, A., Anwar, S., Jakaria, J., Budiman, C., Arief, I. I., Sumantri, C., & Kim, Y. S. (2022) · HAYATI Journal of Biosciences · doi:10.4308/hjb.30.1.148-158 · Cited by 3
Jodoin, H. L., Hinks, A., Roussel, O. P., Contento, V. S., Dalton, B. H., & Power, G. A. (2023) · Journal of sport and health science/Journal of Sport and Health Science · doi:10.1016/j.jshs.2023.02.001 · Cited by 2
Sarcopenia and malnutrition: impact on the outcome in hospitalized patients
Remelli, F., & Volpato, S. (2018) · Geriatric Care · doi:10.4081/gc.2018.7723 · Cited by 2
Dreher, S. I., Goj, T., von Toerne, C., Hoene, M., Irmler, M., Ouni, M., Jähnert, M., Beckers, J., de Angelis, M. H., Peter, A., et al. (2024) · bioRxiv (Cold Spring Harbor Laboratory) · doi:10.1101/2024.12.12.627717 · Cited by 2
The sex-chromosomes related cellular dimorphism in physiology and pathology
Antinozzi, C., Sgrò, P., & Luigi, L. D. (2025) · Molecular and Cellular Endocrinology · doi:10.1016/j.mce.2025.112630 · Cited by 1
Schoeberlein, M. I., Hudgins, J. H., DeVelasco, O., & Wilkins, B. W. (2025) · Journal of Applied Physiology · doi:10.1152/japplphysiol.00913.2025 · Cited by 2
Jordan, M. J., McClean, Z. J., Aagaard, P., Pasanen, K., Fontana, H. D. B., & Herzog, W. (2026) · Scientific Reports · doi:10.1038/s41598-025-34475-5 · Cited by 1
“…with increases in V max , such as the addition of sarcomeres in series 29–32 or a greater area and proportion of type 2 muscle fibres 21,33,34 , are expected to enhance maximal concentric muscle force production at a given shortening velocity 35 , with minimal impact on maximal eccentric…”
Bridging the gap: multi-omic insights into exercise responses in postmenopausal women
Aiyanna, R. K., Wang, S., Grolaux, R., Reisman, E. G., Jones, B., & Eynon, N. (2026) · American Journal of Physiology-Endocrinology and Metabolism · doi:10.1152/ajpendo.00172.2026 · Cited by 1
Dreder, A., Tahir, M. A., Şeker, H., & Anwar, M. U. (2016) · International Journal on Bioinformatics & Biosciences · doi:10.5121/ijbb.2016.6201 · Cited by 1
Exercise physiology in women and men
Lundsgaard, A., Fritzen, A. M., & Kiens, B. (2023) · Principles of Gender-Specific Medicine · doi:10.1016/b978-0-323-88534-8.00040-7 · Cited by 1
Воловик, М. Г., & Долгов, И. М. (2024) · Medical alphabet · doi:10.33667/2078-5631-2024-22-41-46 · Cited by 1
Detopoulou, P., Magni, O., Pylarinou, I., Levidi, D., Dedes, V., Tzoutzou, M., Argyri, K., Fappa, E., Gioxari, A., & Panoutsopoulos, G. (2024) · Diseases · doi:10.3390/diseases13010003 · Cited by 1
“It is also noteworthy that more than 3000 genes are differentially expressed in skeletal muscle between males and females [96].”
Correlation between Olink and SomaScan proteomics platforms in adults with a Fontan circulation
Assi, I., Landzberg, M. J., Becker, K. C. D., Renaud, D., Reyes, F. B., Leone, D. M., Benson, M., Michel, M., Gerszten, R. E., & Opotowsky, A. R. (2025) · International Journal of Cardiology Congenital Heart Disease · doi:10.1016/j.ijcchd.2025.100584 · Cited by 1
Sexual Dimorphism in Stem Cell–Based Therapies for the Musculoskeletal System
Sohn, J., & Huard, J. (2016) · Operative Techniques in Orthopaedics · doi:10.1053/j.oto.2016.06.006 · Cited by 1
Basic Genetics and Epigenetics of Childhood Lung Disease
Willis‐Owen, S. A. G., & Moffatt, M. F. (2012) · Elsevier eBooks · doi:10.1016/b978-1-4377-1984-0.00002-4 · Cited by 1
Vassallo, J. D. (2012) · Cited by 1
Psychological and physical cues to vulnerability: Antagonism, empathy, and sex effects
Jonason, P. K., & Gregorio, M. D. (2021) · Personality and Individual Differences · doi:10.1016/j.paid.2021.111189 · Cited by 1
“1 With less bone density (e.g., Kelly et al., 1990), less musculature (e.g., Welle et al., 2008), and a greater tendency towards emotional instability, dependent personality disorder, anxiety, and depression (Archer, 2019; Bornstein et al., 1993; Nolen-Hoeksema, 1987; Schmitt et al., 2008), women…”
BackgroundRienecker, K. D. A., Chavasse, A. T., Moorwood, K., Ward, A., & Isles, A. R. (2018) · bioRxiv (Cold Spring Harbor Laboratory) · doi:10.1101/493692 · Cited by 1
Computer Science & Information Technology ( CS & IT )
(2016) · doi:10.5121/csit.2016.60600 · Cited by 1
The role of steroid hormones in skeletal muscle metabolism
Salehzadeh, F. (2011) · Figshare
Clarke, K. (2014) · University of Birmingham Institutional Research Archive (University of Birmingham)
An Entropy-based Statistical Workflow Provides Noise-Minimizing Biological Annotation for
Aging, M., Koutsandreas, T., Valavanis, I. K., Pilalis, E. D., & Chatziioannou, A. A. (2014) · IEEE International Conference on Systems Biology · doi:10.1109/isb.2014.6990749
Molecular dissection of pathways regulating glucose and lipid metabolism using siRNA
Rune, A. (2009) · Figshare
Pöllänen, E. (2011) · Jyväskylä University Digital Archive (University of Jyväskylä)
Koutsandreas, T., Valavanis, I. K., Pilalis, E. D., & Chatziioannou, A. A. (2014) · doi:10.13140/2.1.1415.2644
Dreder, A., Tahir, M. A., Şeker, H., & Anwar, M. N. (2016) · doi:10.5121/csit.2016.60619
“Sexual dimorphism of skeletal muscle can occur due to age [1] and many of these age-related changes in skeletal muscle appear to be influenced by gender [2], [17], [18].”
BackgroundCharacterization of Myopathy in Mice Overexpressing Androgen Receptor in Skeletal Muscle
Musa, M. (2010) · TSpace (University of Toronto)
Myocyte Androgen Receptor Modulates Body Composition and Metabolic Parameters
Fernando, S. M. (2010) · TSpace (University of Toronto)
Ormoni e plasticità delle fibre del muscolo scheletrico. Ruolo nella patogenesi della sarcopenia
Galfano, V., & Donini, L. M. (2018) · L Endocrinologo · doi:10.1007/s40619-018-00470-4
Vadopalas, K., Brazaitis, M., Skurvydas, A., & Eimantas, N. (2018) · Baltic Journal of Sport and Health Sciences · doi:10.33607/bjshs.v2i77.385
Qomi, M. H., Arshadi, S., Banaeifar, A., & Kazemzadeh, Y. (2019) · Nutrition and Food Sciences Research · doi:10.29252/nfsr.6.4.9
“In the current study, increased expression of myostatin was seen in rats after 31 min of extroversion activity (25).”
BackgroundMohammadi, R., Ghouroghchi, A. P., & Khajehlandi, M. (2021) · مجله علمی دانشگاه علوم پزشکی رفسنجان · doi:10.52547/jrums.20.1.53
Omosule, C. L. (2021) · MOspace Institutional Repository (University of Missouri) · doi:10.32469/10355/90078
Metadata
- Authors
- Welle, S., Tawil, R., & Thornton, C. A.
- Affiliations
- University of Rochester Medicine (US)
- Corresponding author
- Welle, Stephen
- Venue
- PLoS ONE
- Publisher
- Public Library of Science (PLoS)
- Published
- 2008-01-02
- Volume
- 3
- Issue
- 1
- Pages
- e1385
- ISSN
- 1932-6203 (ISSN-L)
- PMC
- PMC2148100
- OpenAlex
- W2094746410
- Cited by
- 224
- References
- 62
- Citations by year
- 2026: 8 · 2025: 22 · 2024: 19 · 2023: 27 · 2022: 24 · 2021: 23 · 2020: 9 · 2019: 12 · 2018: 16 · 2017: 5 · 2016: 8 · 2015: 6 · 2014: 9 · 2013: 5 · 2012: 4
- FWCI
- 3.42
- Type
- journal article
- Language
- en
- Open access
- gold
- doi.org
- Locations
- PLoS ONE (publishedVersion, cc-by)
- Europe PMC (PubMed Central) (publishedVersion, cc-by)
- PubMed Central (publishedVersion, cc-by)
- PubMed (publishedVersion)
- DOAJ (DOAJ: Directory of Open Access Journals) (submittedVersion, cc-by-sa)
- Funders
- University of Rochester
- National Institutes of Health
- National Institute on Aging (AG18254, AG17891, P30AG018254, R01AG017891)
- National Institute of Arthritis and Musculoskeletal and Skin Diseases (AR/NS48143, K24AR048143)
- National Center for Research Resources (RR-00044, M01RR000044)
- Topics
- Life Sciences › Biochemistry, Genetics and Molecular Biology › Molecular Biology › Muscle Physiology and Disorders
- Life Sciences › Biochemistry, Genetics and Molecular Biology › Genetics › Genetics and Physical Performance
- Health Sciences › Nursing › Nutrition and Dietetics › Muscle metabolism and nutrition
- Keywords
- sex differences, skeletal muscle, gene expression, sexual dimorphism, muscle mass, Grb10, ACVR2B, IGF-1 signaling, facioscapulohumeral muscular dystrophy, mitochondrial proteins, ribosomal proteins, growth factor pathways
- MeSH terms
- Adult, Aged, Female, Gene Expression Regulation, Humans, Male, Middle Aged, Sex Factors, Muscle, Skeletal, Oligonucleotide Array Sequence Analysis
About these checks
Registry, retraction, Cites and statistics results are computed, not judged, with one exception: a printed reference that no index lists is read once by a model before it counts as a citation error. Claims are extracted by a model and kept only when their quote appears verbatim in the text; each cited source is then checked, with a model’s help, for whether it says what the claim relies on. Those verdicts can be wrong — read the claim’s quote and the cited source before relying on one.
Statistics and arithmetic are recomputed, not judged.
Confidence bands are shown only for fields calibrated on our annotated test set. None is calibrated yet, so no band is shown.
What counts as a claim ›How we measure confidence ›How we check this ›
Are you an author, or do you see a problem with this page? Request a review
