

The DOI matches its Crossref record; 2 of the 2 references it cites were found in a registry or an index.
The Genomic Analysis of Erythrocyte microRNA Expression in Sickle Cell Diseases
Overview
The claims and statistics of this paper haven’t been checked yet.
Run the check — free, no account needed. It reads the open-access text and checks the sources it cites.
Integrity signals
Registry
Cites
Statistics
Figures
Verification
Claims the paper makes
The claims and statistics of this paper haven’t been checked yet.
Run the check — free, no account needed. It reads the open-access text and checks the sources it cites.
Claims other papers make about this one
Each is checked against this paper’s own text: does it say what the citing paper says it does?
The cited source says what the claim attributes to it.
In the citing paper
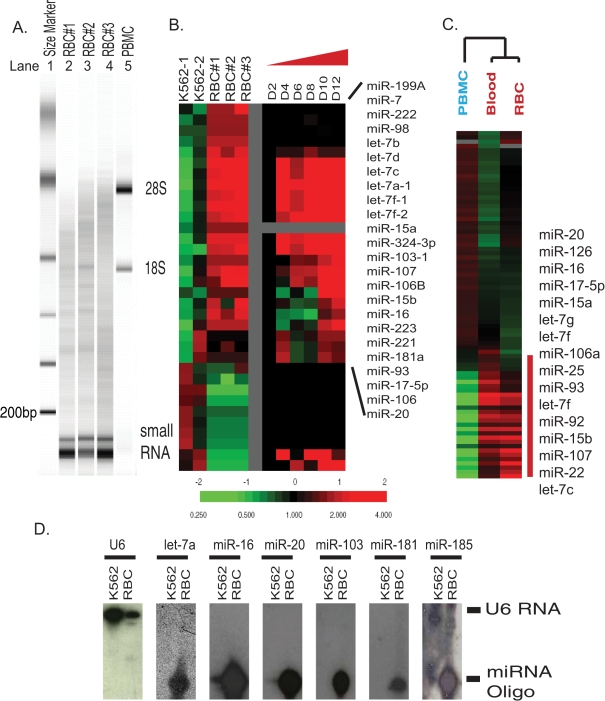
“Interestingly, many miRNAs that are up- or downregulated during erythropoiesis may not be removed or degraded but selectively retained in mature red blood cells (RBCs)”
From Red Blood Cells as Potential Repositories of MicroRNAs in the Circulatory System (2020) · cites this paper as Chen et al., 2008
The cited source says what the claim attributes to it.
In the citing paper
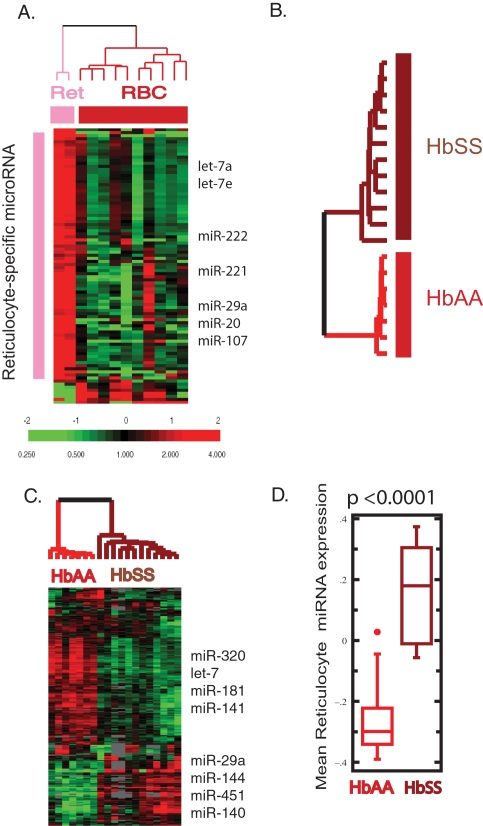
“MiRNAs in erythrocytes have a very unique expression pattern compared with human reticulocytes, which indicates that miRNAs are likely selectively retained and function in mature RBCs”
From Red Blood Cells as Potential Repositories of MicroRNAs in the Circulatory System (2020) · cites this paper as Chen et al., 2008
In the citing paper
“However, recent research has indicated that red blood cells contain abundant miRNAs and mature red blood cell miRNAs account for the vast majority of the entire miRNAs in the blood89.”
From Selection of urinary sediment miRNAs as specific biomarkers of IgA nephropathy (2016) · cites this paper as [8]
In the citing paper
“The amount of erythrocyte-derived microRNAs (miRNAs) represents the majority of miRNAs expressed in whole blood.”
From Red Blood Cells as Potential Repositories of MicroRNAs in the Circulatory System (2020) · cites this paper as Chen et al., 2008
In the citing paper
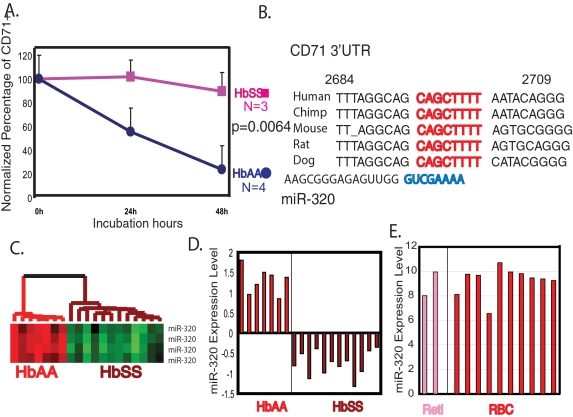
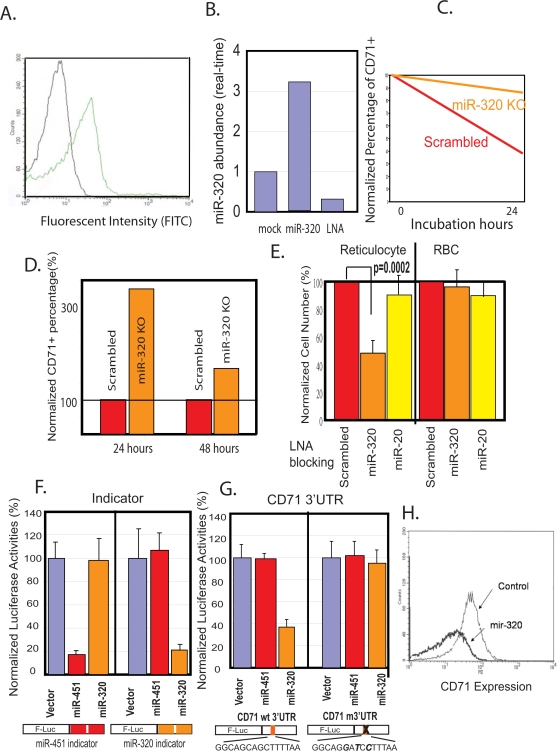
“MiR-320 downregulation has been correlated with the upregulation of the CD71 protein (a key protein in the terminal differentiation process of reticulocytes) in erythrocytes from patients with sickle cell anemia”
From Red Blood Cells as Potential Repositories of MicroRNAs in the Circulatory System (2020) · cites this paper as Chen et al., 2008
In the citing paper
“which indicates that miRNAs are likely selectively retained and function in mature RBCs”
From Red Blood Cells as Potential Repositories of MicroRNAs in the Circulatory System (2020) · cites this paper as Chen et al., 2008
In the citing paper
“Chen et al. (2008) discovered that RBCs were the major contributors of miRNA expression in whole blood.”
From Red Blood Cells as Potential Repositories of MicroRNAs in the Circulatory System (2020) · cites this paper as Chen et al. (2008)
Self-check
Percentages, sums and reported differences re-computed from the paper’s own numbers.
The self-check needs the paper’s full text.
Citations
Cites
Combinatorial microRNA target predictions
Krek, A., Grün, D., Poy, M. N., Wolf, R., Rosenberg, L., Epstein, E. J., MacMenamin, P., da Piedade, I., Gunsalus, K. C., Stoffel, M., et al. (2005) · Nature Genetics · doi:10.1038/ng1536 · Cited by 4,603
The Widespread Impact of Mammalian MicroRNAs on mRNA Repression and Evolution
Farh, K. K.-H., Grimson, A., Jan, C., Lewis, B. P., Johnston, W. K., Lim, L. P., Burge, C. B., & Bartel, D. P. (2005) · Science · doi:10.1126/science.1121158 · Cited by 1,484
Research works printed but not linked: 44
- SH Goh, 2004, Hembase: browser and genome portal for hematology and erythroid biology., Nucleic Acids Res, 32, D572, 10.1093/nar/gkh129 · DOI
- T Harrison, 2003, Erythrocyte G Protein-Coupled Receptor Signaling in Malarial Infection., Science, 301, 1734, 10.1126/science.1089324 · DOI
- R Zennadi, 2004, Epinephrine acts through erythroid signaling pathways to activate sickle cell adhesion to endothelium via LW-alphavbeta3 interactions., Blood, 104, 3774, 10.1182/blood-2004-01-0042 · DOI
- G Linda, 1986, Thiazole orange: A new dye for reticulocyte analysis., Cytometry, 7, 508, 10.1002/cyto.990070603 · DOI
- L Rainen, 2002, Stabilization of mRNA Expression in Whole Blood Samples., Clin Chem, 48, 1883, 10.1093/clinchem/48.11.1883 · DOI
- AR Whitney, 2003, Individuality and variation in gene expression patterns in human blood., Proc Natl Acad Sci U S A, 100, 1896, 10.1073/pnas.252784499 · DOI
- T Rathjen, 2006, Analysis of short RNAs in the malaria parasite and its red blood cell host., FEBS Lett, 580, 5185, 10.1016/j.febslet.2006.08.063 · DOI · Paper page
- WF Bahou, 2004, Platelet transcriptome: the application of microarray analysis to platelets., Semin Thromb Hemost, 30, 473, 10.1055/s-2004-833482 · DOI
- Q Zen, 2004, B-CAM/LU expression and the role of B-CAM/LU activation in binding of low- and high-density red cells to laminin in sickle cell disease., Am J Hematol, 75, 63, 10.1002/ajh.10442 · DOI
- DP Bartel, 2004, MicroRNAs: genomics, biogenesis, mechanism, and function., Cell, 116, 281, 10.1016/S0092-8674(04)00045-5 · DOI
- J Shingara, 2005, An optimized isolation and labeling platform for accurate microRNA expression profiling., Rna, 11, 1461, 10.1261/rna.2610405 · DOI · Paper page
- CZ Chen, 2004, MicroRNAs modulate hematopoietic lineage differentiation., Science, 303, 83, 10.1126/science.1091903 · DOI · Paper page
- J Lu, 2005, MicroRNA expression profiles classify human cancers., Nature, 435, 834, 10.1038/nature03702 · DOI
- ML Choong, 2007, MicroRNA expression profiling during human cord blood-derived CD34 cell erythropoiesis., Exp Hematol, 35, 551, 10.1016/j.exphem.2006.12.002 · DOI · Paper page
- M Zhan, 2007, MicroRNA expression dynamics during murine and human erythroid differentiation., Exp Hematol, 35, 1015, 10.1016/j.exphem.2007.03.014 · DOI
- K Lao, 2006, Multiplexing RT-PCR for the detection of multiple miRNA species in small samples., Biochem Biophys Res Commun, 343, 85, 10.1016/j.bbrc.2006.02.106 · DOI
- F Tang, 2006, MicroRNA expression profiling of single whole embryonic stem cells., Nucleic Acids Res, 34, e9, 10.1093/nar/gnj009 · DOI
- VG Tusher, 2001, Significance analysis of microarrays applied to the ionizing radiation response., Proc Natl Acad Sci U S A, 98, 5116, 10.1073/pnas.091062498 · DOI · Paper page
- N Felli, 2005, MicroRNAs 221 and 222 inhibit normal erythropoiesis and erythroleukemic cell growth via kit receptor down-modulation., Proc Natl Acad Sci U S A, 102, 18081, 10.1073/pnas.0506216102 · DOI · Paper page
- RS Eisenstein, 2000, Iron regulatory proteins and the molecular control of mammalian iron metabolism., Annu Rev Nutr, 20, 627, 10.1146/annurev.nutr.20.1.627 · DOI
- O Skadberg, 2003, Human reticulocytes isolated from peripheral blood: maturation time and hemoglobin synthesis., Lab Hematol, 9, 198
- E Birney, 2004, Ensembl 2004., Nucleic Acids Res, 32 Database issue, D468, 10.1093/nar/gkh038 · DOI
- BP Lewis, 2005, Conserved seed pairing, often flanked by adenosines, indicates that thousands of human genes are microRNA targets., Cell, 120, 15, 10.1016/j.cell.2004.12.035 · DOI · Paper page
- B John, 2004, Human MicroRNA targets., PLoS Biol, 2, e363, 10.1371/journal.pbio.0020363 · DOI · Paper page
- JL Miller, 2004, A genome-based approach for the study of erythroid biology and disease., Blood Cells Mol Dis, 32, 341, 10.1016/j.bcmd.2004.01.003 · DOI
- DV Gnatenko, 2003, Transcript profiling of human platelets using microarray and serial analysis of gene expression., Blood, 101, 2285, 10.1182/blood-2002-09-2797 · DOI
- RW Georgantas 3rd, 2007, CD34+ hematopoietic stem-progenitor cell microRNA expression and function: a circuit diagram of differentiation control., Proc Natl Acad Sci U S A, 104, 2750, 10.1073/pnas.0610983104 · DOI
- B Wang, 2006, Recapitulation of short RNA-directed translational gene silencing in vitro., Mol Cell, 22, 553, 10.1016/j.molcel.2006.03.034 · DOI
- Q Wang, 2007, MicroRNA miR-24 inhibits erythropoiesis by targeting activin type I receptor ALK4., Blood
- AJ Giraldez, 2006, Zebrafish MiR-430 Promotes Deadenylation and Clearance of Maternal mRNAs., Science
- L Wu, 2006, From the Cover: MicroRNAs direct rapid deadenylation of mRNA., Proc Natl Acad Sci U S A, 103, 4034, 10.1073/pnas.0510928103 · DOI
- CL Jopling, 2005, Modulation of hepatitis C virus RNA abundance by a liver-specific MicroRNA., Science, 309, 1577, 10.1126/science.1113329 · DOI
- CH Lecellier, 2005, A cellular microRNA mediates antiviral defense in human cells., Science, 308, 557, 10.1126/science.1108784 · DOI
- EP Browne, 2005, Virus-host interactions: new insights from the small RNA world., Genome Biol, 6, 238, 10.1186/gb-2005-6-11-238 · DOI
- S Pfeffer, 2004, Identification of virus-encoded microRNAs., Science, 304, 734, 10.1126/science.1096781 · DOI
- E Gottwein, 2007, A viral microRNA functions as an orthologue of cellular miR-155., Nature, 450, 1096, 10.1038/nature05992 · DOI
- G Pasvol, 1978, Cellular mechanism for the protective effect of haemoglobin S against P. falciparum malaria., Nature, 274, 701, 10.1038/274701a0 · DOI
- MJ Friedman, 1978, Erythrocytic mechanism of sickle cell resistance to malaria., Proc Natl Acad Sci U S A, 75, 1994, 10.1073/pnas.75.4.1994 · DOI
- B Zhang, 2008, microRNAs: a new emerging class of players for disease diagnostics and gene therapy., J Cell Mol Med, 12, 3, 10.1111/j.1582-4934.2007.00196.x · DOI
- SA Waggoner, 2003, Regulation of {alpha}-Globin mRNA Stability., Experimental Biology and Medicine, 228, 387, 10.1177/153537020322800409 · DOI · Paper page
- RM Johnstone, 1989, Reticulocyte maturation and exosome release: transferrin receptor containing exosomes shows multiple plasma membrane functions., Blood, 74, 1844, 10.1182/blood.V74.5.1844.1844 · DOI · Paper page
- AK Leung, 2007, microRNAs: a safeguard against turmoil?, Cell, 130, 581, 10.1016/j.cell.2007.08.010 · DOI
- J Shingara, 2005, An optimized isolation and labeling platform for accurate microRNA expression profiling., RNA, 11, 1461, 10.1261/rna.2610405 · DOI · Paper page
- MB Eisen, 1998, Cluster analysis and display of genome-wide expression patterns., Proc Natl Acad Sci U S A, 95, 14863, 10.1073/pnas.95.25.14863 · DOI · Paper page
Cited by
Sorted by citations
Blood–spinal cord barrier breakdown and pericyte reductions in amyotrophic lateral sclerosis
Winkler, E. A., Sengillo, J. D., Sullivan, J. S., Henkel, J. S., Appel, S. H., & Zlokovic, B. V. (2013) · Acta Neuropathologica · doi:10.1007/s00401-012-1039-8 · Cited by 354
Red Blood Cells as Potential Repositories of MicroRNAs in the Circulatory System
Sun, L., Yu, Y., Niu, B., & Wang, D. (2020) · Frontiers in Genetics · doi:10.3389/fgene.2020.00442 · Cited by 83
Selection of urinary sediment miRNAs as specific biomarkers of IgA nephropathy
Duan, Z.-Y., Cai, G.-Y., Bu, R., Lu, Y., Hou, K., & Chen, X.-M. (2016) · Scientific Reports · doi:10.1038/srep23498 · Cited by 61
Circulating microRNA profile throughout the menstrual cycle
Rekker, K., Saare, M., Roost, A. M., Salumets, A., & Peters, M. (2013) · PLoS ONE · doi:10.1371/journal.pone.0081166 · Cited by 52
Metadata
- Authors
- Chen, S.-Y., Wang, Y., Telen, M. J., & Chi, J.-T.
- Venue
- PLoS ONE
- Publisher
- Public Library of Science (PLoS)
- Published
- 2008-06-04
- Volume
- 3
- Issue
- 6
- Pages
- e2360
- ISSN
- 1932-6203
- PMC
- PMC2408759
- Cited by
- 163
- References
- 2
- Language
- en
About these checks
Registry, retraction, Cites and statistics results are computed, not judged, with one exception: a printed reference that no index lists is read once by a model before it counts as a citation error. Claims are extracted by a model and kept only when their quote appears verbatim in the text; each cited source is then checked, with a model’s help, for whether it says what the claim relies on. Those verdicts can be wrong — read the claim’s quote and the cited source before relying on one.
Statistics and arithmetic are recomputed, not judged.
Confidence bands are shown only for fields calibrated on our annotated test set. None is calibrated yet, so no band is shown.
What counts as a claim ›How we measure confidence ›How we check this ›
Are you an author, or do you see a problem with this page? Request a review
