

The DOI matches its Crossref record; 55 of the 55 references it cites were found in a registry or an index.
Genome-Wide Association of Histone H3 Lysine Nine Methylation with CHG DNA Methylation in Arabidopsis thaliana
Open accessAbstract
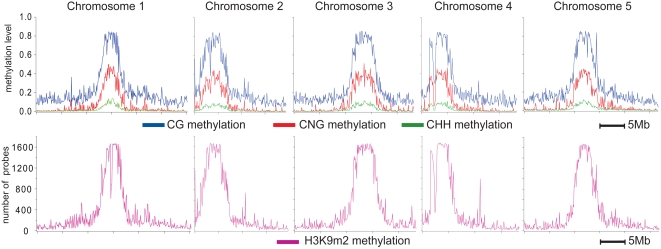
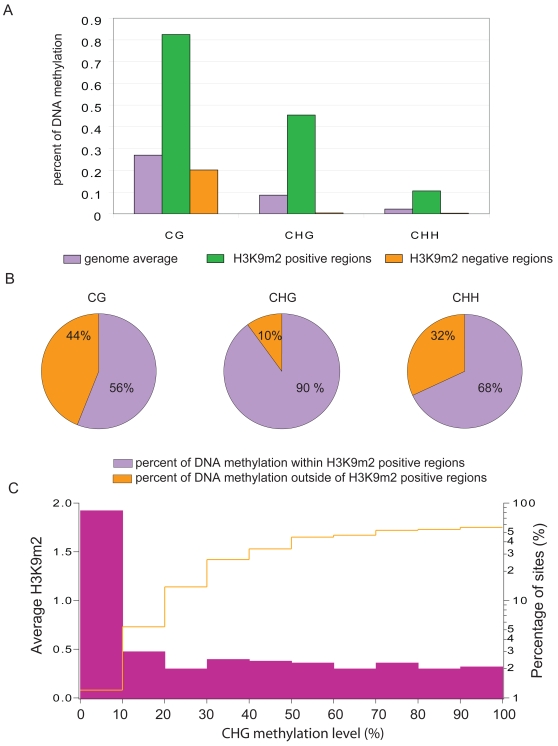
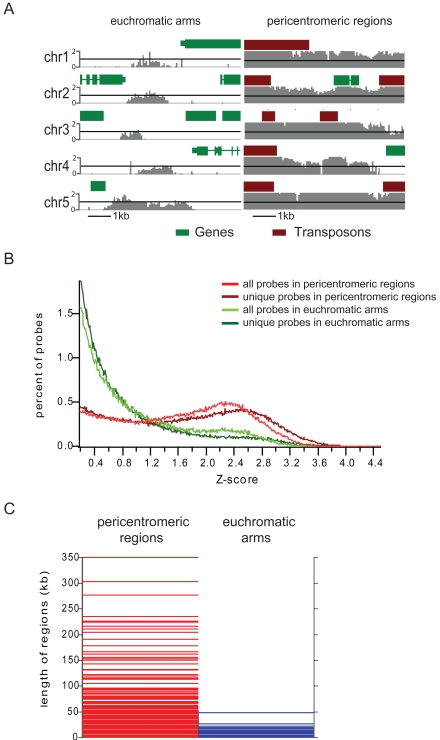
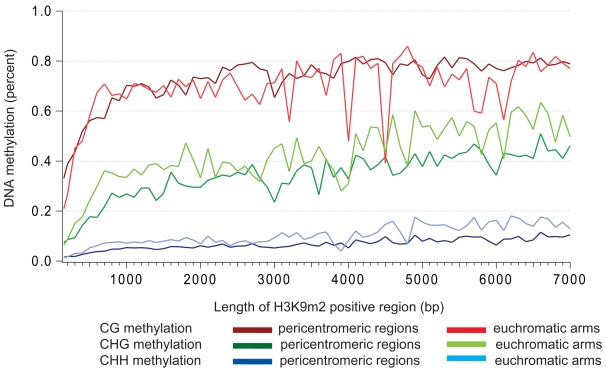
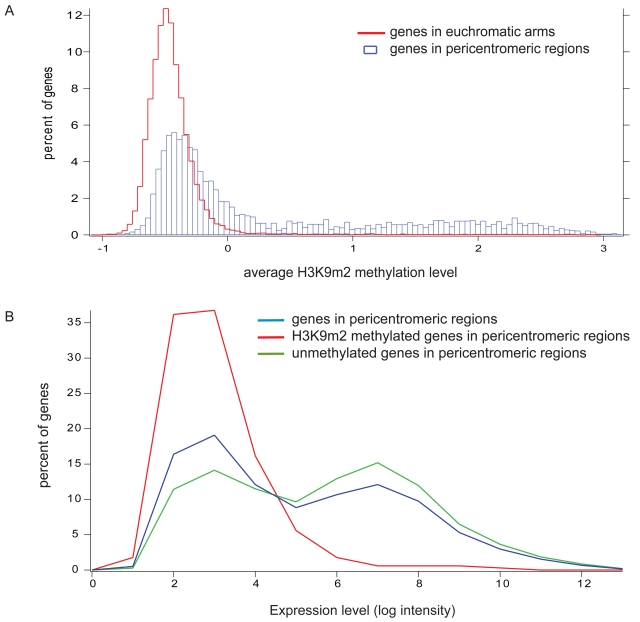
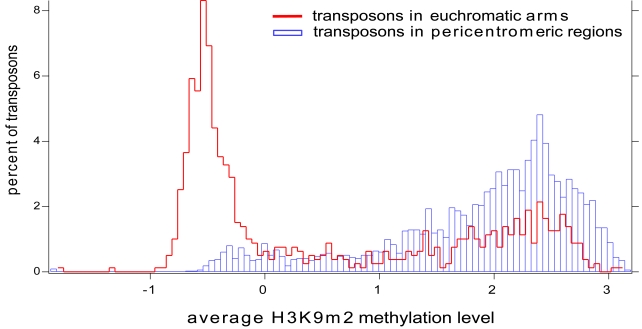
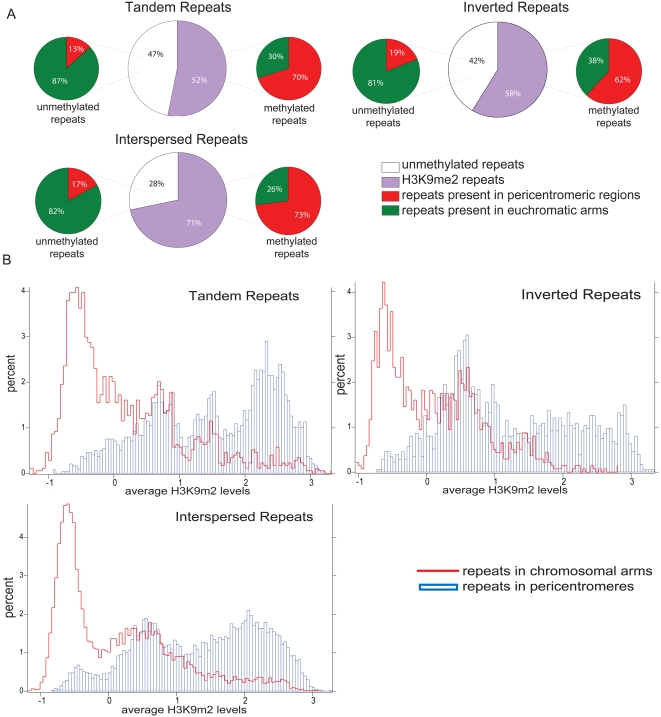
Methylation of histone H3 lysine 9 (H3K9) is a hallmark of transcriptional silencing in many organisms. In Arabidopsis thaliana, dimethylation of H3K9 (H3K9m2) is important in the silencing of transposons and in the control of DNA methylation. We constructed a high-resolution genome-wide map of H3K9m2 methylation by using chromatin immunoprecipitation coupled with whole genome Roche Nimblegen microarrays (ChIP-chip). We observed a very high coincidence between H3K9m2 and CHG methylation (where H is either A,T or C) throughout the genome. The coding regions of genes that are associated exclusively with methylation in a CG context did not contain H3K9m2. In addition, we observed two distinct patterns of H3K9m2. Transposons and other repeat elements present in the euchromatic arms contained small islands of H3K9m2 present at relatively low levels. In contrast, pericentromeric/centromeric regions of Arabidopsis chromosomes contained long, rarely interrupted blocks of H3K9m2 present at much higher average levels than seen in the chromosome arms. These results suggest a complex interplay between H3K9m2 and different types of DNA methylation and suggest that distinct mechanisms control H3K9m2 in different compartments of the genome.
Overview
The claims and statistics of this paper haven’t been checked yet.
Run the check — free, no account needed. It reads the open-access text and checks the sources it cites.
Integrity signals
Registry
Cites
Statistics
Figures
Verification
Claims the paper makes
The claims and statistics of this paper haven’t been checked yet.
Run the check — free, no account needed. It reads the open-access text and checks the sources it cites.
Claims other papers make about this one
Each is checked against this paper’s own text: does it say what the citing paper says it does?
The source backs part of the claim, not all of it — or backs it for a different population, condition or comparison.
In the citing paper
“For example, it is well known that modifications such as the ubiquitination of H2BK143, mono-, di-, and trimethylation of H3K4, H3K36, and H3 and H4 lysine acetylation are associated, in Arabidopsis genome, with gene activation, while the mono-, di- and trimethylation of H3H9, H3K27, and H4K20, and the dimethylation of H4R3, are associated with gene inactivation [90,91,92,93]).”
From Somaclonal Variation—Advantage or Disadvantage in Micropropagation of the Medicinal Plants (2023) · cites this paper as [92]
Experimental — accuracy not yet measured
Self-check
Percentages, sums and reported differences re-computed from the paper’s own numbers.
The self-check needs the paper’s full text.
Citations
Cites
Two new Later Stone Age sites from the Final Pleistocene in the Falémé Valley, eastern Senegal
Ndiaye, M., Lespez, L., Tribolo, C., Rassé, M., Hadjas, I., Davidoux, S., Huysecom, É., & Douze, K. (2024) · Monash University Research Portal (Monash University) · doi:10.3929/ethz-b-000667478 · Cited by 24,214
Chromatin modifications and their function
Kouzarides, T. (2007) · Cell · doi:10.1016/j.cell.2007.02.005 · Cited by 10,883
<tt>BLAT</tt> —The <tt>BLAST</tt> -Like Alignment Tool
Kent, W. J. (2002) · Genome Research · doi:10.1101/gr.229202 · Cited by 8,480
A gene expression map of Arabidopsis thaliana development
Schmid, M., Davison, T. S., Henz, S. R., Pape, U. J., Demar, M., Vingron, M., Schölkopf, B., Weigel, D., & Lohmann, J. U. (2005) · Nature Genetics · doi:10.1038/ng1543 · Cited by 2,524
Highly Integrated Single-Base Resolution Maps of the Epigenome in Arabidopsis
Lister, R., O’Malley, R. C., Tonti‐Filippini, J., Gregory, B. D., Berry, C. C., Millar, A. H., & Ecker, J. R. (2008) · Cell · doi:10.1016/j.cell.2008.03.029 · Cited by 2,424
Shotgun bisulphite sequencing of the Arabidopsis genome reveals DNA methylation patterning
Cokus, S. J., Feng, S.-H., Zhang, X.-Y., Chen, Z., Merriman, B., Haudenschild, C., Pradhan, S., Nelson, S., Pellegrini, M., & Jacobsen, S. (2008) · Nature · doi:10.1038/nature06745 · Cited by 2,278
Self-citationEUKARYOTIC CYTOSINE METHYLTRANSFERASES
Goll, M. G., & Bestor, T. H. (2005) · Annual Review of Biochemistry · doi:10.1146/annurev.biochem.74.010904.153721 · Cited by 2,162
The DNA methyltransferases of mammals
Bestor, T. H. (2000) · Human Molecular Genetics · doi:10.1093/hmg/9.16.2395 · Cited by 2,078
Genome-wide High-Resolution Mapping and Functional Analysis of DNA Methylation in Arabidopsis
Zhang, X., Yazaki, J., Sundaresan, A., Cokus, S. J., Chan, S. W.-L., Chen, H., Henderson, I. R., Shinn, P., Pellegrini, M. A., Jacobsen, S. E., et al. (2006) · Cell · doi:10.1016/j.cell.2006.08.003 · Cited by 1,850
Self-citationLoss of the Suv39h Histone Methyltransferases Impairs Mammalian Heterochromatin and Genome Stability
Peters, A. H. F. M., O'Carroll, D., Scherthan, H., Mechtler, K., Sauer, S., Schöfer, C., Weipoltshammer, K., Pagani, M., Lachner, M., Kohlmaier, A., et al. (2001) · Cell · doi:10.1016/s0092-8674(01)00542-6 · Cited by 1,766
Cited by
Sorted by citations
Items 101–200 of 338
Epimutations are associated with CHROMOMETHYLASE 3-induced de novo DNA methylation
Wendte, J. M., Zhang, Y., Ji, L., Shi, X., Hazarika, R. R., Shahryary, Y., Johannes, F. M., & Schmitz, R. J. (2019) · eLife · doi:10.7554/elife.47891 · Cited by 74
FACT complex is required for DNA demethylation at heterochromatin during reproduction in Arabidopsis
Frost, J. M., Kim, M. Y., Park, G. T., Hsieh, P.-H., Nakamura, M., Lin, S. J. H., Yoo, H., Choi, J., Ikeda, Y., Kinoshita, T., et al. (2018) · Proceedings of the National Academy of Sciences · doi:10.1073/pnas.1713333115 · Cited by 71
Arabidopsisreplacement histone variant H3.3 occupies promoters of regulated genes
Shu, H., Nakamura, M., Siretskiy, A., Borghi, L., Moraes, I., Wildhaber, T., Gruissem, W., & Hennig, L. (2014) · Genome biology · doi:10.1186/gb-2014-15-4-r62 · Cited by 81
Moissiard, G., Bischof, S., Husmann, D., Pastor, W. A., Hale, C. J., Yen, L., Stroud, H., Papikian, A., Vashisht, A. A., Wohlschlegel, J. A., et al. (2014) · Proceedings of the National Academy of Sciences · doi:10.1073/pnas.1406611111 · Cited by 69
Self-citationThe role of DNA methylation, nucleosome occupancy and histone modifications in paramutation
Haring, M., Bader, R., Louwers, M., Schwabe, A., DRIEL, R. V., & Stam, M. E. (2010) · The Plant Journal · doi:10.1111/j.1365-313x.2010.04245.x · Cited by 71
Transcriptional control and exploitation of an immune‐responsive family of plant retrotransposons
Zervudacki, J., Yu, A., Amesefe, D., Wang, J., Drouaud, J., Navarro, L., & Deleris, A. (2018) · The EMBO Journal · doi:10.15252/embj.201798482 · Cited by 68
Evolutionarily Conserved Histone Methylation Dynamics during Seed Life-Cycle Transitions
Müller, K., Bouyer, D., Schnittger, A., & Kermode, A. R. (2012) · PLoS ONE · doi:10.1371/journal.pone.0051532 · Cited by 66
Garg, R., Kumari, R., Tiwari, S., & Goyal, S. (2014) · PLoS ONE · doi:10.1371/journal.pone.0088947 · Cited by 67
Thermal stress acceleratesArabidopsis thalianamutation ratePreprint
Belfield, E. J., Brown, C., Ding, Z. J., Chapman, L., Luo, M., Hinde, E., van Es, S. W., Johnson, S. L., Ning, Y., Zheng, S. J., et al. (2020) · Genome Research · doi:10.1101/gr.259853.119 · Cited by 68
DDM1 Represses Noncoding RNA Expression and RNA-Directed DNA Methylation in Heterochromatin
Tan, F., Lu, Y., Jiang, W. J., Wu, T., Zhang, R., Zhao, Y. J., & Zhou, D. (2018) · PLANT PHYSIOLOGY · doi:10.1104/pp.18.00352 · Cited by 64
Writing and Reading Histone H3 Lysine 9 Methylation in Arabidopsis
Xu, L., & Jiang, H. L. (2020) · Frontiers in Plant Science · doi:10.3389/fpls.2020.00452 · Cited by 61
Feng, W., & Michaels, S. D. (2015) · Annual Review of Genetics · doi:10.1146/annurev-genet-112414-055048 · Cited by 60
Veiseth, S. V., Rahman, M. A., Yap, K. L., Fischer, A., Egge-Jacobsen, W. M., Reuter, G., Zhou, M., Aalen, R. B., & Thorstensen, T. (2011) · PLoS Genetics · doi:10.1371/journal.pgen.1001325 · Cited by 66
Wang, X., Zhi, P., Fan, Q., Zhang, M., & Chang, C. (2018) · Journal of Experimental Botany · doi:10.1093/jxb/ery377 · Cited by 61
Lai, Y., Lu, X. M., Daron, J., Pan, S., Wang, J., Wang, W., Tsuchiya, T., Holub, E. B., McDowell, J. M., Slotkin, R. K., et al. (2020) · PLoS Genetics · doi:10.1371/journal.pgen.1008993 · Cited by 59
The impact of chromatin dynamics on plant light responses and circadian clock function
Barnèche, F., Malapeira, J., & Más, P. (2014) · Journal of Experimental Botany · doi:10.1093/jxb/eru011 · Cited by 61
Verkest, A., Byzova, M., Martens, C., Willems, P., Verwulgen, T., Slabbinck, B., Rombaut, D., de Velde, J. V., Vandepoele, K., Standaert, E., et al. (2015) · PLANT PHYSIOLOGY · doi:10.1104/pp.15.00155 · Cited by 58
Meller, B., Kuźnicki, D., Arasimowicz‐Jelonek, M., Deckert, J., & Floryszak‐Wieczorek, J. (2018) · Frontiers in Plant Science · doi:10.3389/fpls.2018.01228 · Cited by 58
Gill, R. A., Scossa, F., King, G. J. W., Golicz, A. A., Tong, C., Snowdon, R. J., Fernie, A. R., & Liu, S. (2021) · Critical Reviews in Plant Sciences · doi:10.1080/07352689.2021.1920731 · Cited by 57
Genomics-Assisted Plant Breeding in the 21st Century: Technological Advances and Progress
Siva, P., Buyyarapu, R., Abdurakhmonov, I. Y., & Ja'far, A. K. (2012) · InTech eBooks · doi:10.5772/37458 · Cited by 56
High-throughput approaches for plant epigenomic studies
Schmitz, R. J., & Zhang, X. (2011) · Current Opinion in Plant Biology · doi:10.1016/j.pbi.2011.03.010 · Cited by 57
Self-citationCaro, E., Stroud, H., Greenberg, M., Bernatavichute, Y. V., Feng, S., Groth, M. Z., Vashisht, A. A., Wohlschlegel, J. A., & Jacobsen, S. E. (2012) · PLoS Genetics · doi:10.1371/journal.pgen.1002995 · Cited by 57
Self-citationArabidopsis thaliana telomeres exhibit euchromatic features
Vaquero-Sedas, M. I., Gámez‐Arjona, F. M., & Vega-Palas, M. A. (2010) · Nucleic Acids Research · doi:10.1093/nar/gkq1119 · Cited by 55
Arabidopsis ATRX Modulates H3.3 Occupancy and Fine-Tunes Gene Expression
Duc, C., Benoit, M., Détourné, G., Simon, L., Poulet, A., Jung, M., Veluchamy, A., Latrasse, D., Goff, S. L., Cotterell, S., et al. (2017) · The Plant Cell · doi:10.1105/tpc.16.00877 · Cited by 55
Insights into Chromatin Structure and Dynamics in Plants
Rosa, S., & Shaw, P. (2013) · Biology · doi:10.3390/biology2041378 · Cited by 62
Light behind the curtain: photoregulation of nuclear architecture and chromatin dynamics in plants
Perrella, G., & Kaiserli, E. (2016) · New Phytologist · doi:10.1111/nph.14269 · Cited by 56
Beyond the genetic code in leaf senescence
Yolcu, S., Li, X., Li, S., & Kim, Y. J. (2017) · Journal of Experimental Botany · doi:10.1093/jxb/erx401 · Cited by 54
Zubko, E., Gentry, M., Kunova, A., & Meyer, P. (2012) · The Plant Journal · doi:10.1111/j.1365-313x.2012.05051.x · Cited by 55
Signaling Pathways and Downstream Effectors of Host Innate Immunity in Plants
Kumar, J., Ramlal, A., Kumar, K., Rani, A., & Mishra, V. (2021) · International Journal of Molecular Sciences · doi:10.3390/ijms22169022 · Cited by 52
Zuchegna, C., Aceto, F., Bertoni, A., Romano, A., Perillo, B., Laccetti, P., Gottesman, M. E., Avvedimento, E. V., & Porcellini, A. (2014) · Nucleic Acids Research · doi:10.1093/nar/gku823 · Cited by 52
The transcription factor OsSUF4 interacts with SDG725 in promoting H3K36me3 establishment
Liu, B., Liu, Y., Wang, B., Luo, Q., Shi, J., Gan, J., Shen, W., Yu, Y., & Dong, A. (2019) · Nature Communications · doi:10.1038/s41467-019-10850-5 · Cited by 50
Rambani, A., Pantalone, V. R., Yang, S., Rice, J. H., Song, Q., Mazarei, M., Arelli, P. R., Meksem, K., Stewart, C. N., & Hewezi, T. (2020) · New Phytologist · doi:10.1111/nph.16511 · Cited by 51
Du, J.-L., Zhang, S.-W., Huang, H., Cai, T., Li, L., Chen, S., & He, X. (2015) · Molecular Plant · doi:10.1016/j.molp.2015.02.003 · Cited by 48
BORDER proteins protect expression of neighboring genes by promoting 3′ Pol II pausing in plants
Yu, X., Martin, P. G. P., & Michaels, S. D. (2019) · Nature Communications · doi:10.1038/s41467-019-12328-w · Cited by 49
SWI3B and HDA6 interact and are required for transposon silencing in Arabidopsis
Yang, J., Yuan, L., Yen, M., Zheng, F., Ji, R., Peng, T., Gu, D., Yang, S., Cui, Y., Chen, P., et al. (2019) · The Plant Journal · doi:10.1111/tpj.14666 · Cited by 52
Cambiagno, D. A., Nota, F., Zavallo, D., Rius, S. P., Casati, P., Asurmendi, S., & Álvarez, M. E. (2018) · The Plant Journal · doi:10.1111/tpj.14098 · Cited by 47
A Nucleosome Bridging Mechanism for Activation of a Maintenance DNA Methyltransferase
Stoddard, C. I., Feng, S., Campbell, M. G., Liu, W., Wang, H., Zhong, X., Bernatavichute, Y. V., Cheng, Y., Jacobsen, S. E., & Narlikar, G. J. (2018) · Molecular Cell · doi:10.1016/j.molcel.2018.10.006 · Cited by 46
Self-citationCRISPR–Cas-mediated transcriptional control and epi-mutagenesis
Gardiner, J., Ghoshal, B., Wang, M., & Jacobsen, S. E. (2022) · PLANT PHYSIOLOGY · doi:10.1093/plphys/kiac033 · Cited by 46
Self-citationAzizi, P., Hanafi, M. M., Sahebi, M., Harikrishna, J. A., Taheri, S., Yassoralipour, A., & Nasehi, A. (2020) · Functional Plant Biology · doi:10.1071/fp19077 · Cited by 46
pENCODE: A Plant Encyclopedia of DNA Elements
Lane, A. K., Niederhuth, C. E., Ji, L., & Schmitz, R. J. (2014) · Annual Review of Genetics · doi:10.1146/annurev-genet-120213-092443 · Cited by 42
5-Hydroxymethylcytosine Is Not Present in Appreciable Quantities in Arabidopsis DNA
Erdmann, R. M., Souza, A. L., Clish, C. B., & Gehring, M. A. (2014) · G3 Genes Genomes Genetics · doi:10.1534/g3.114.014670 · Cited by 46
METHIONINE SYNTHASE1 Is Involved in Chromatin Silencing by Maintaining DNA and Histone Methylation
Yan, X., Ma, L., Pang, H., Wang, P., Liu, L., Cheng, Y., Cheng, J., Guo, Y., & Li, Q. (2019) · PLANT PHYSIOLOGY · doi:10.1104/pp.19.00528 · Cited by 44
Histone H1 protects telomeric repeats from H3K27me3 invasion in Arabidopsis
Teano, G., Concia, L., Wolff, L., Carron, L., Biocanin, I., Adamusová, K., Fojtová, M., Bourge, M., Kramdi, A., Colot, V., et al. (2023) · Cell Reports · doi:10.1016/j.celrep.2023.112894 · Cited by 44
Cooperation between the H3K27me3 chromatin marker and non-CG methylation in epigenetic regulation
Zhou, S., Liu, X., Zhou, C., Zhou, Q., Zhao, Y. J., Li, G., & Zhou, D. (2016) · PLANT PHYSIOLOGY · doi:10.1104/pp.16.01238 · Cited by 42
Inácio, V., Martins, M. T., Graça, J., & Morais–Cecílio, L. (2018) · Frontiers in Plant Science · doi:10.3389/fpls.2018.01194 · Cited by 41
Liu, Y., Yuan, J., Jia, G., Ye, W., Chen, Z. J., & Song, Q. (2020) · The Plant Journal · doi:10.1111/tpj.15063 · Cited by 41
The roles of cross-talk epigenetic patterns inArabidopsis thaliana
Wang, J., Meng, X., Yuan, C., Harrison, A., & Chen, M. (2015) · Briefings in Functional Genomics · doi:10.1093/bfgp/elv025 · Cited by 44
Arabidopsis proteins with a transposon-related domain act in gene silencing
Ikeda, Y., Pélissier, T., Bourguet, P., Becker, C., Pouch-Pélissier, M.-N., Pogorelcnik, R., Weingartner, M., Weigel, D., Deragon, J., & Mathieu, O. (2017) · Nature Communications · doi:10.1038/ncomms15122 · Cited by 40
Roessler, K., Bousios, A., Meca, E., & Gaut, B. S. (2018) · Genome Biology and Evolution · doi:10.1093/gbe/evy043 · Cited by 39
Dong, X., Reimer, J. J., Göbel, U., Engelhorn, J., He, F., Schoof, H., & Turck, F. (2012) · Genome biology · doi:10.1186/gb-2012-13-12-r117 · Cited by 40
Gan, E., Huang, J., & Ito, T. (2013) · International review of cytology · doi:10.1016/b978-0-12-407695-2.00003-2 · Cited by 40
Epigenetic control of abiotic stress signaling in plants
Chung, S., Kwon, C., & Lee, J. (2021) · Genes & Genomics · doi:10.1007/s13258-021-01163-3 · Cited by 38
Sasaki, T., Kobayashi, A., Saze, H., & Kakutani, T. (2012) · The Plant Journal · doi:10.1111/j.1365-313x.2012.04911.x · Cited by 38
Epigenetic Dynamics: Role of Epimarks and Underlying Machinery in Plants Exposed to Abiotic Stress
Dhar, M. K., Vishal, P., Sharma, R., & Kaul, S. (2014) · International Journal of Genomics · doi:10.1155/2014/187146 · Cited by 38
Noy-Malka, C., Yaari, R., Itzhaki, R., Mosquna, A., Gershovitz, N. A., Katz, A., & Ohad, N. (2013) · Plant Molecular Biology · doi:10.1007/s11103-013-0165-6 · Cited by 38
Fan, D., Dai, Y., Wang, X., Wang, Z., He, H., Yang, H., Cao, Y., Deng, X. W., & Ma, L. (2012) · Nucleic Acids Research · doi:10.1093/nar/gks647 · Cited by 37
Hung, F., Feng, Y., Hsin, K., Shih, Y., Chang, C., Zhong, W., Lai, Y., Xu, Y., Yang, S., Sugimoto, K., et al. (2023) · Communications Biology · doi:10.1038/s42003-023-04607-6 · Cited by 36
Xie, G., Du, X., Hu, H., & Du, J. (2025) · Annual Review of Plant Biology · doi:10.1146/annurev-arplant-083123-054357 · Cited by 36
Genome architecture: from linear organisation of chromatin to the 3D assembly in the nucleus
Sequeira‐Mendes, J., & Gutiérrez, C. (2015) · Chromosoma · doi:10.1007/s00412-015-0538-5 · Cited by 36
siRNA-mediated DNA methylation and H3K9 dimethylation in plants
Xu, C., Tian, J., & Mo, B. (2013) · Protein & Cell · doi:10.1007/s13238-013-3052-7 · Cited by 36
Epigenetic marks for mitigating abiotic stresses in plants
Ali, S., Khan, N., & Tang, Y. (2022) · Journal of Plant Physiology · doi:10.1016/j.jplph.2022.153740 · Cited by 40
Zhu, A., Greaves, I. K., Dennis, E. S., & Peacock, W. J. (2017) · BMC Genomics · doi:10.1186/s12864-017-3542-8 · Cited by 35
Gene activation and cell fate control in plants: a chromatin perspective
Engelhorn, J., Blanvillain, R., & Carles, C. C. (2014) · Cellular and Molecular Life Sciences · doi:10.1007/s00018-014-1609-0 · Cited by 38
Structural biology-based insights into combinatorial readout and crosstalk among epigenetic marks
Du, J., & Patel, D. J. (2014) · Biochimica et Biophysica Acta (BBA) - Gene Regulatory Mechanisms · doi:10.1016/j.bbagrm.2014.04.011 · Cited by 32
Liu, J., Sandoval, J., Doh, S. T., Cai, L., López‐Rodas, G., & Casaccia, P. (2010) · PLoS ONE · doi:10.1371/journal.pone.0013023 · Cited by 32
The Regulation and Function of Histone Methylation
Niu, Y., Bai, J., & Zheng, S. (2018) · Journal of Plant Biology · doi:10.1007/s12374-018-0176-6 · Cited by 33
Dinh, T. T., Gao, L., Liu, X., Li, D., Li, S., Zhao, Y., O'Leary, M. L., Le, B. H., Schmitz, R. J., Manavella, P. A., et al. (2014) · PLoS Genetics · doi:10.1371/journal.pgen.1004446 · Cited by 32
Regulation by Polycomb and Trithorax Group Proteins in Arabidopsis
Álvarez-Venegas, R. (2010) · The Arabidopsis Book · doi:10.1199/tab.0128 · Cited by 36
Desvoyes, B., Sánchez, M. D. L. P., Ramírez-Parra, E., & Gutiérrez, C. (2010) · Heredity · doi:10.1038/hdy.2010.50 · Cited by 32
JMJ24 targets CHROMOMETHYLASE3 for proteasomal degradation inArabidopsisPreprint
Deng, S., Jang, I., Su, L., Xu, J., & Chua, N. (2016) · Genes & Development · doi:10.1101/gad.274647.115 · Cited by 32
DNA Methylation in Algae and Its Impact on Abiotic Stress Responses
Ferrari, M., Muto, A., Bruno, L., & Cozza, R. (2023) · Plants · doi:10.3390/plants12020241 · Cited by 32
Kumar, R., Chauhan, P. K., & Khurana, A. (2016) · Functional & Integrative Genomics · doi:10.1007/s10142-016-0502-3 · Cited by 31
Karim, R., Nuruzzaman, M., Khalid, N., & Harikrishna, J. A. (2016) · Annals of Applied Biology · doi:10.1111/aab.12280 · Cited by 31
Trejo‐Arellano, M. S., Mahrez, W., Nakamura, M., Moreno‐Romero, J., Nanni, P., Köhler, C., & Hennig, L. (2017) · The Plant Journal · doi:10.1111/tpj.13489 · Cited by 30
Epigenetic regulation of centromere function
Wong, C. Y. Y., Lee, B. C. H., & Yuen, K. W. Y. (2020) · Cellular and Molecular Life Sciences · doi:10.1007/s00018-020-03460-8 · Cited by 30
Quality control and evaluation of plant epigenomics data
Schmitz, R. J., Marand, A. P., Zhang, X., Mosher, R. A., Turck, F., Chen, X., Axtell, M. J., Zhong, X., Brady, S. M., Megraw, M. S., et al. (2021) · The Plant Cell · doi:10.1093/plcell/koab255 · Cited by 28
Self-citationEARLY FLOWERING IN SHORT DAYS (EFS) regulates the seed size in Arabidopsis
Cheng, L., Shafiq, S., Xu, W. M., & Sun, Q. (2018) · Science China Life Sciences · doi:10.1007/s11427-017-9236-x · Cited by 29
Plant Immunity Is Regulated by Biological, Genetic, and Epigenetic Factors
Movahedi, A., Dargiri, S. A., Barati, B., Kadkhodaei, S., Wei, H., Sangari, S., Yang, L., & Xu, C. (2022) · Agronomy · doi:10.3390/agronomy12112790 · Cited by 29
Lai, Y., Cuzick, A., Lu, X. M., Wang, J., Katiyar, N., Tsuchiya, T., Roch, K. G. L., McDowell, J. M., Holub, E. B., & Eulgem, T. (2018) · The Plant Journal · doi:10.1111/tpj.14148 · Cited by 28
Epigenetic Regulation of Plant Gametophyte Development
Ashapkin, V. V., Kutueva, L. I., Aleksandrushkina, N. I., & Vanyushin, B. F. (2019) · International Journal of Molecular Sciences · doi:10.3390/ijms20123051 · Cited by 28
Tsuchiya, T., & Eulgem, T. (2013) · Scientific Reports · doi:10.1038/srep01701 · Cited by 26
Kawanabe, T., Osabe, K., Itabashi, E., Okazaki, K., Dennis, E. S., & Fujimoto, R. (2016) · Genes & Genetic Systems · doi:10.1266/ggs.15-00058 · Cited by 29
Junaid, M. D., Chaudhry, U. K., Şanlı, B. A., Gökçe, A. F., & Gökçe, Z. N. Ö. (2024) · Functional & Integrative Genomics · doi:10.1007/s10142-024-01354-7 · Cited by 30
Non-coding RNAs and DNA methylation in plants
Zhao, Y., & Chen, X. (2014) · National Science Review · doi:10.1093/nsr/nwu003 · Cited by 30
Seifert, M., Cortijo, S., Colomé‐Tatché, M., Johannes, F. M., Roudier, F., & Colot, V. (2012) · Bioinformatics · doi:10.1093/bioinformatics/bts562 · Cited by 27
Arabidopsis Histone Reader EMSY-LIKE 1 Binds H3K36 and Suppresses Geminivirus Infection
Coursey, T. L., Milutinović, M., Regedanz, E., Brkljacić, J., & Bisaro, D. M. (2018) · Journal of Virology · doi:10.1128/jvi.00219-18 · Cited by 26
Takahashi, S., Osabe, K., Fukushima, N., Takuno, S., Miyaji, N., Shimizu, M., Takasaki-Yasuda, T., Suzuki, Y., Dennis, E. S., Seki, M., et al. (2018) · DNA Research · doi:10.1093/dnares/dsy021 · Cited by 25
Araujo, N. D. S., & Arias, M. C. (2021) · Scientific Reports · doi:10.1038/s41598-020-75432-8 · Cited by 28
siRNA-mediated chromatin maintenance and its function in Arabidopsis thaliana
Kanno, T., & Habu, Y. (2011) · Biochimica et Biophysica Acta (BBA) - Gene Regulatory Mechanisms · doi:10.1016/j.bbagrm.2011.05.002 · Cited by 26
Natural variation of H3K27me3 modification in two Arabidopsis accessions and their hybrid
Yang, M., Wang, X., Huang, H., Ren, D., Su, Y., Zhu, P., Zhu, D., Fan, L., Chen, L., He, G., et al. (2015) · Journal of Integrative Plant Biology · doi:10.1111/jipb.12443 · Cited by 24
Comprehensive assembly and analysis of the transcriptome of maritime pine developing embryos
Rodrigues, A., Vega, J. J. D., & Miguel, C. M. G. (2018) · BMC Plant Biology · doi:10.1186/s12870-018-1564-2 · Cited by 24
Huang, X., Pan, Q., Lin, Y., Gu, T., & Li, Y. (2020) · Plant Methods · doi:10.1186/s13007-020-0556-z · Cited by 24
Nicolau, M., Picault, N., Descombin, J., Jami‐Alahmadi, Y., Feng, S., Bucher, E., Jacobsen, S. E., Deragon, J., Wohlschlegel, J. A., & Moissiard, G. (2020) · PLoS Genetics · doi:10.1371/journal.pgen.1008324 · Cited by 26
Self-citationStructure and Mechanism of Plant DNA Methyltransferases
Leichter, S. M., Du, J., & Zhong, X. (2022) · Advances in experimental medicine and biology · doi:10.1007/978-3-031-11454-0_6 · Cited by 23
Epigenetic Repression of Male Gametophyte-Specific Genes in the Arabidopsis Sporophyte
Hoffmann, R. D., & Palmgren, M. B. (2013) · Molecular Plant · doi:10.1093/mp/sst100 · Cited by 21
DNA polymerase epsilon is required for heterochromatin maintenance in Arabidopsis
Bourguet, P., López‐González, L., Gómez‐Zambrano, Á., Pélissier, T., Hesketh, A., Potok, M. E., Pouch-Pélissier, M.-N., Perez, M., Ines, O. D., Latrasse, D., et al. (2020) · Genome biology · doi:10.1186/s13059-020-02190-1 · Cited by 20
Self-citationBennett, M., Piya, S., Baum, T. J., & Hewezi, T. (2022) · PLANT PHYSIOLOGY · doi:10.1093/plphys/kiac228 · Cited by 22
Sidler, C. L., Li, D., Kovalchuk, O., & Kovalchuk, I. (2015) · Radiation Research · doi:10.1667/rr13840.1 · Cited by 23
Li, C., Wu, K., Fu, G., Li, Y., Zhong, Y., Lin, X., Zhou, Y., Tian, L., & Huang, S. (2009) · Journal of Experimental Botany · doi:10.1093/jxb/erp275 · Cited by 22
Deng, S., Dai, H., Arenas‐Huertero, C., Wang, H., Niu, Q., & Chua, N. (2014) · Plant and Cell Physiology · doi:10.1093/pcp/pcu025 · Cited by 22
Metadata
- Authors
- Bernatavichute, Y. V., Zhang, X., Cokus, S., Pellegrini, M., & Jacobsen, S. E.
- Affiliations
- University of California, Los Angeles (US)
- University of Georgia (US)
- Howard Hughes Medical Institute (US)
- Corresponding author
- Pellegrini, Matteo
- Jacobsen, Steven E.
- Venue
- PLoS ONE
- Publisher
- Public Library of Science (PLoS)
- Published
- 2008-09-08
- Volume
- 3
- Issue
- 9
- Pages
- e3156
- ISSN
- 1932-6203 (ISSN-L)
- PMC
- PMC2522283
- OpenAlex
- W1999644599
- Cited by
- 333
- References
- 55
- Citations by year
- 2026: 8 · 2025: 4 · 2024: 13 · 2023: 13 · 2022: 13 · 2021: 15 · 2020: 26 · 2019: 18 · 2018: 23 · 2017: 11 · 2016: 19 · 2015: 19 · 2014: 26 · 2013: 24 · 2012: 43
- FWCI
- 7.96
- Type
- journal article
- Language
- en
- Open access
- gold
- doi.org
- Locations
- PLoS ONE (publishedVersion, cc-by)
- PubMed Central (publishedVersion, cc-by)
- PubMed (publishedVersion)
- DOAJ (DOAJ: Directory of Open Access Journals) (submittedVersion)
- eScholarship (California Digital Library) (submittedVersion)
- eScholarship (California Digital Library) (submittedVersion, cc-by)
- Figshare (submittedVersion, cc-by)
- Funders
- Howard Hughes Medical Institute
- National Institutes of Health (GM60398, grant GM60398)
- U.S. Public Health Service (GM07104)
- National Institute of General Medical Sciences (T32GM007104, GM60398, R37GM060398, R01GM060398)
- Jonsson Cancer Center Foundation
- Topics
- Life Sciences › Biochemistry, Genetics and Molecular Biology › Molecular Biology › Epigenetics and DNA Methylation
- Life Sciences › Biochemistry, Genetics and Molecular Biology › Molecular Biology › Genomics and Chromatin Dynamics
- Life Sciences › Agricultural and Biological Sciences › Plant Science › Plant Molecular Biology Research
- Keywords
- H3K9 dimethylation, histone methylation, DNA methylation, transcriptional silencing, transposon silencing, centromeric heterochromatin, pericentromeric regions, CG methylation, repetitive elements, Arabidopsis thaliana, genome-wide methylation mapping
- MeSH terms
- Chromatin, DNA Transposable Elements, Heterochromatin, Histones, Lysine, Methylation, Transcription, Genetic, Genes, Plant, Arabidopsis, Genome, Plant, DNA Methylation, Arabidopsis Proteins, RNA, Small Interfering, Epigenesis, Genetic, Chromatin Immunoprecipitation, Genome-Wide Association Study
About these checks
Registry, retraction, Cites and statistics results are computed, not judged, with one exception: a printed reference that no index lists is read once by a model before it counts as a citation error. Claims are extracted by a model and kept only when their quote appears verbatim in the text; each cited source is then checked, with a model’s help, for whether it says what the claim relies on. Those verdicts can be wrong — read the claim’s quote and the cited source before relying on one.
Statistics and arithmetic are recomputed, not judged.
Confidence bands are shown only for fields calibrated on our annotated test set. None is calibrated yet, so no band is shown.
What counts as a claim ›How we measure confidence ›How we check this ›
Are you an author, or do you see a problem with this page? Request a review
