

The DOI matches its Crossref record; 60 of the 60 references it cites were found in a registry or an index.
Glutamine Deprivation Induces Abortive S-Phase Rescued by Deoxyribonucleotides in K-Ras Transformed Fibroblasts
Open accessAbstract
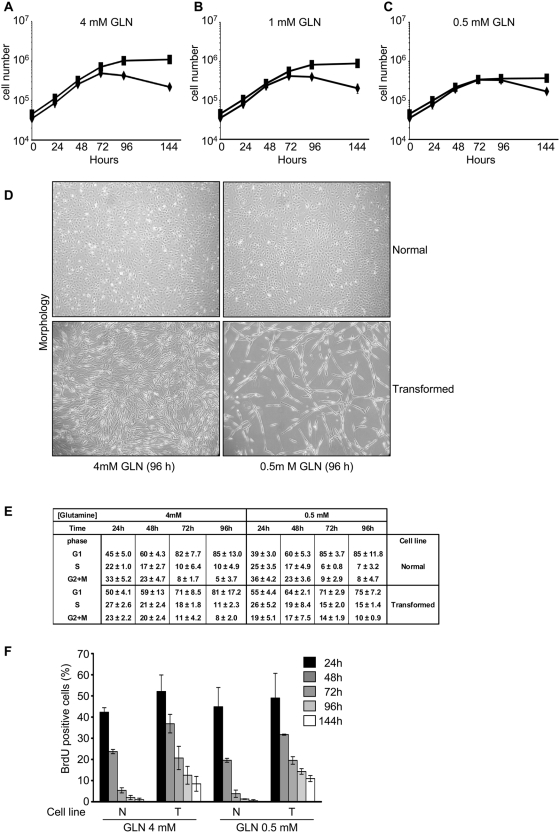
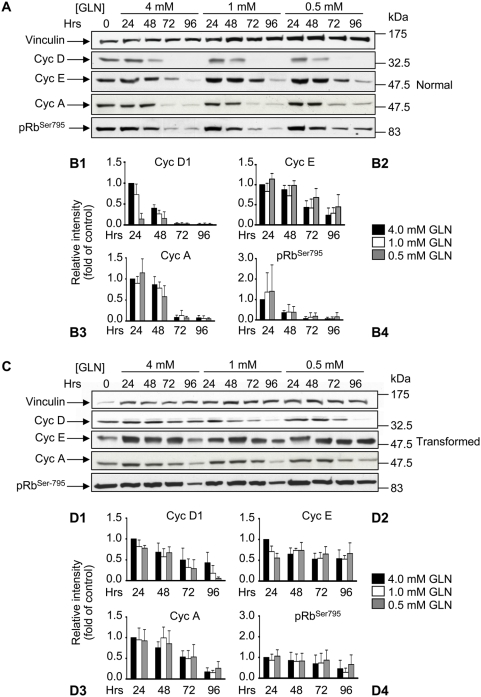
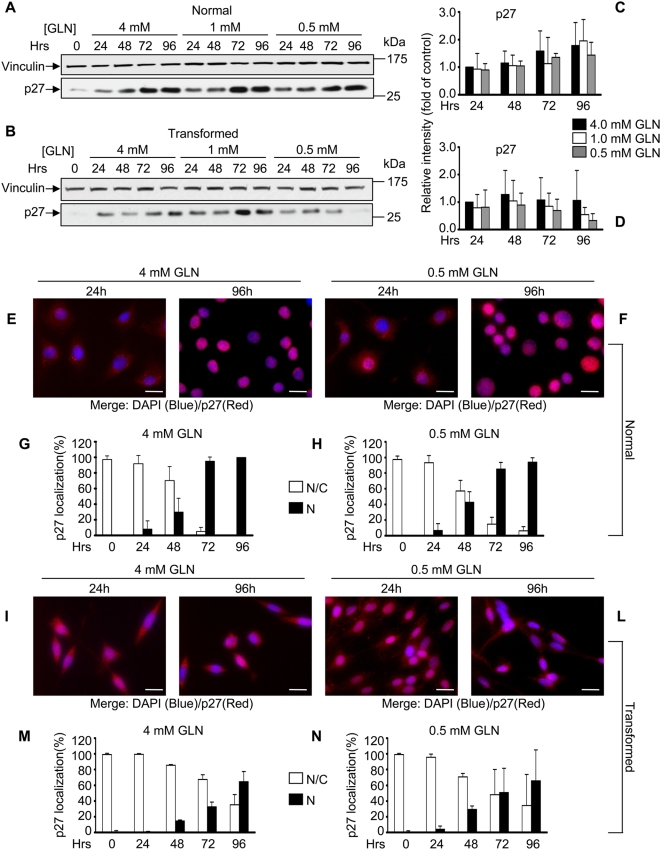
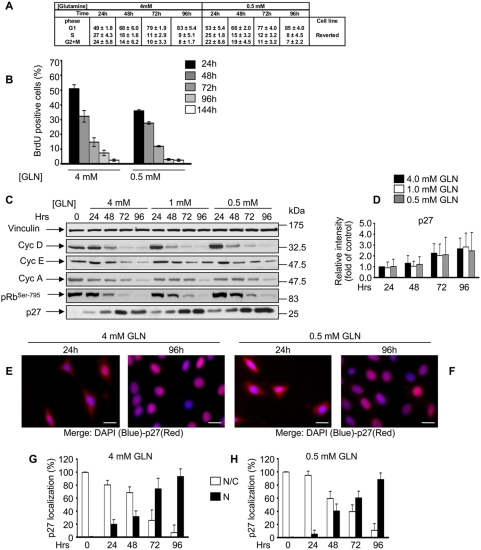
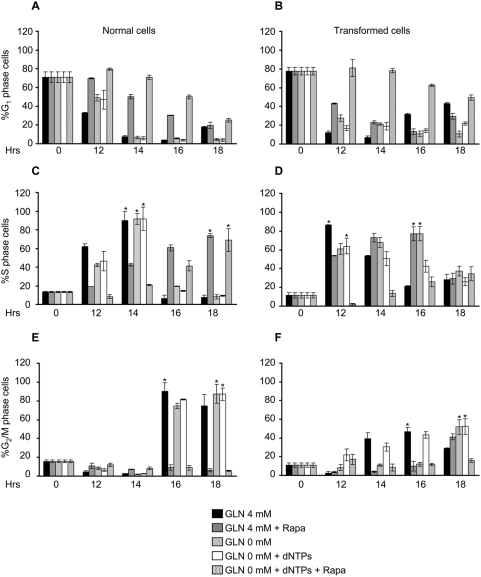
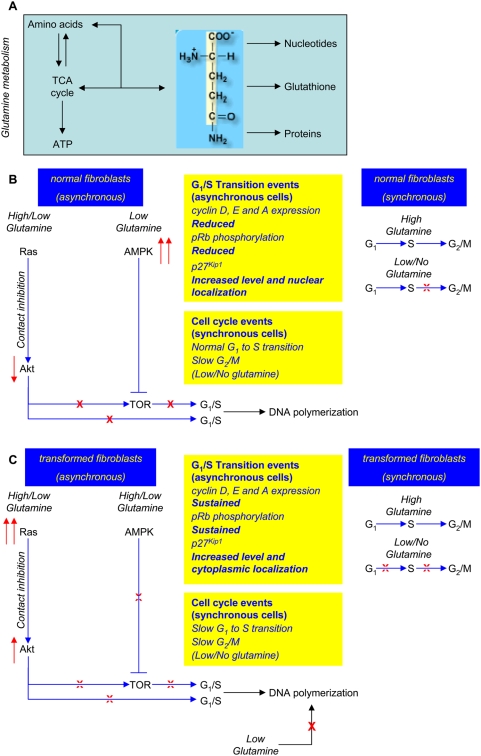
BACKGROUND: Oncogene activation plays a role in metabolic reprogramming of cancer cells. We have previously shown that K-ras transformed fibroblasts have a stronger dependence on glycolysis and a reduced oxidative phosphorylation ability as compared to their normal counterparts. Another metabolic adaptation of cancer cells, that has long been established, is their propensity to exhibit increased glutamine consumption, although the effects induced by glutamine deprivation on cancer cells are still controversial. METHODOLOGY AND PRINCIPAL FINDINGS: Here, by using nutritional perturbations and molecular physiology, we show that reduction or complete depletion of glutamine availability in K-ras transformed fibroblasts causes a strong decrease of proliferation ability and a slower re-entry of synchronized cells into the cell cycle. The reduced proliferation is accompanied by sustained expression of cyclin D and E, abortive S phase entrance and is dependent on Ras signalling deregulation, since it is rescued by expression of a dominant negative guanine nucleotide exchange factor. The growth potential of transformed cells as well as the ability to execute the G(1) to S transition is restored by adding the four deoxyribonucleotides, indicating that the arrest of proliferation of K-ras transformed cells induced by glutamine depletion is largely due to a reduced supply of DNA in the presence of signalling pathways promoting G(1) to S transition. CONCLUSIONS AND SIGNIFICANCE: Our results suggest that the differential effects of glutamine and glucose on cell viability are not a property of the transformed phenotype per se, but rather depend on the specific pathway being activated in transformation. For instance, myc-overexpressing cells have been reported to die under glutamine depletion and not under glucose shortage, while the opposite holds for ras-transformed fibroblasts as shown in this paper. These different responses of transformed cells to nutritional stress should be taken into account when designing anti-cancer therapies that aim to exploit metabolic differences between normal and transformed cells.
Overview
The claims and statistics of this paper haven’t been checked yet.
Run the check — free, no account needed. It reads the open-access text and checks the sources it cites.
Integrity signals
Registry
Cites
Statistics
Figures
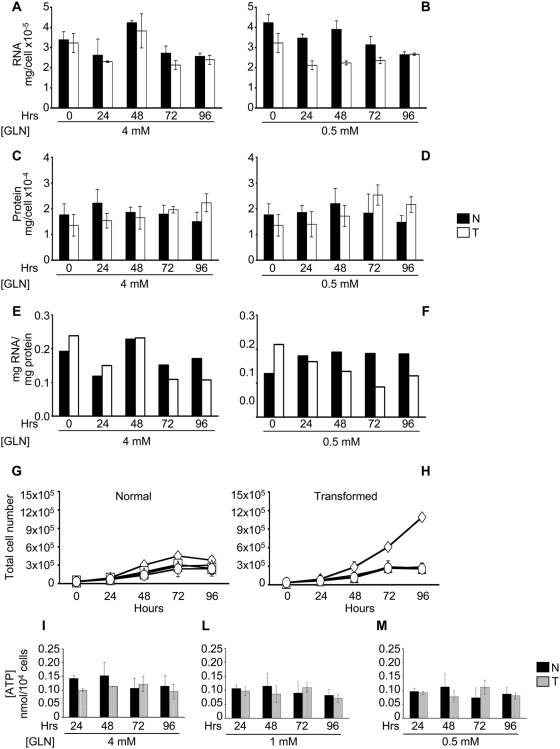
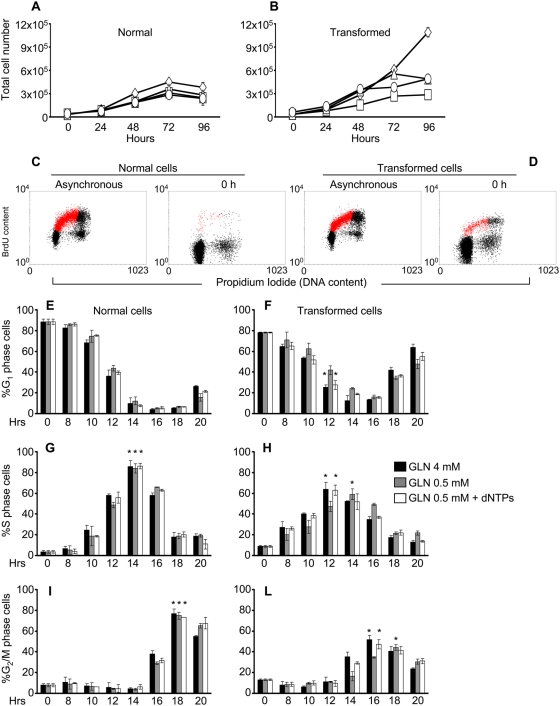
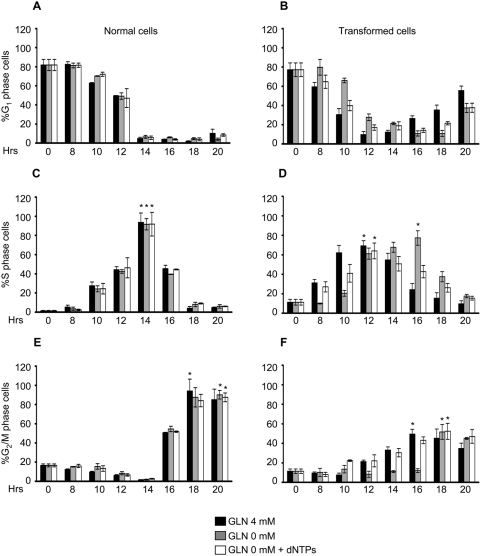
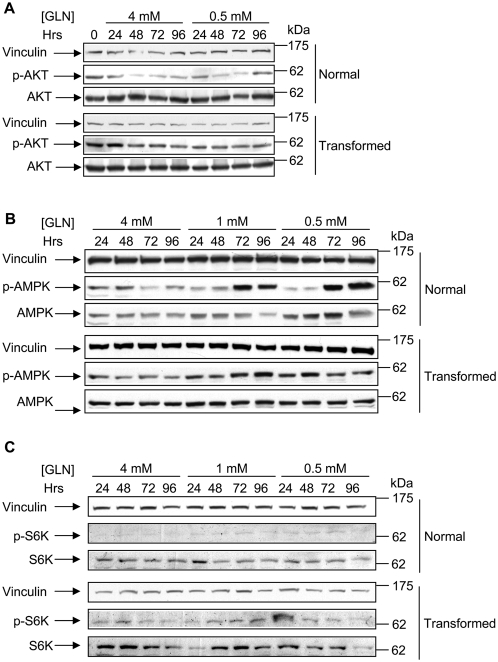
Verification
Claims the paper makes
The claims and statistics of this paper haven’t been checked yet.
Run the check — free, no account needed. It reads the open-access text and checks the sources it cites.
Claims other papers make about this one
Each is checked against this paper’s own text: does it say what the citing paper says it does?
In the citing paper
“Accordingly, glutamine levels have been shown to be rate-limiting for cell cycle progression, and glutamine deprivation leads to cell cycle arrest in the S-phase in certain cellular contexts (Fontenelle and Henderson, 1969; Gaglio et al., 2009).”
From The emerging hallmarks of cancer metabolism (2016) · cites this paper as Gaglio et al., 2009
In the citing paper
“Accordingly, glutamine levels have been shown to be rate-limiting for cell cycle progression, and glutamine deprivation leads to cell cycle arrest in the S-phase in certain cellular contexts (Fontenelle and Henderson, 1969; Gaglio et al., 2009).”
From The emerging hallmarks of cancer metabolism (2016) · cites this paper as Gaglio et al., 2009
Self-check
Percentages, sums and reported differences re-computed from the paper’s own numbers.
The self-check needs the paper’s full text.
Citations
Cites
Warburg, O. (1956) · Science · doi:10.1126/science.123.3191.309 · Cited by 13,425
Why Do Cancers Have High Aerobic Glycolysis?
Gatenby, R. A., & Gillies, R. J. (2004) · Nature reviews. Cancer · doi:10.1038/nrc1478 · Cited by 4,784
The Biology of Cancer: Metabolic Reprogramming Fuels Cell Growth and Proliferation
DeBerardinis, R. J., Lum, J. J., Hatzivassiliou, G., & Thompson, C. B. (2008) · Cell Metabolism · doi:10.1016/j.cmet.2007.10.002 · Cited by 4,088
Wallace, D. C. (2005) · Annual Review of Genetics · doi:10.1146/annurev.genet.39.110304.095751 · Cited by 3,185
DeBerardinis, R. J., Mancuso, A., Daikhin, E., Nissim, I., Yudkoff, M., Wehrli, S., & Thompson, C. B. (2007) · Proceedings of the National Academy of Sciences · doi:10.1073/pnas.0709747104 · Cited by 2,622
The Rb/E2F pathway: expanding roles and emerging paradigms
Harbour, J. W., & Dean, D. C. (2000) · Genes & Development · doi:10.1101/gad.813200 · Cited by 1,153
Cheng, M., Olivier, P., Diehl, J. A., Fero, M., Roussel, M. F., Roberts, J. M., & Sherr, C. J. (1999) · The EMBO Journal · doi:10.1093/emboj/18.6.1571 · Cited by 1,142 · cited 10×
“Notably both Cdk2 and Cdk4 kinase complexes phosphorylate, during the G1 to S transition, pRb protein on Ser 795.”
BackgroundInfluentialPKB/Akt phosphorylates p27, impairs nuclear import of p27 and opposes p27-mediated G1 arrest
Liang, J., Zubovitz, J., Petrocelli, T., Kotchetkov, R., Connor, M. K., Han, K. C.-Z., Lee, J.-H., Ciarallo, S., Catzavelos, C., Beniston, R., et al. (2002) · Nature Medicine · doi:10.1038/nm761 · Cited by 952
Transforming p21 Mutants and c-Ets-2 Activate the Cyclin D1 Promoter through Distinguishable Regions
Albanese, C., Johnson, J., Watanabe, G., Eklund, N., Vu, D., Arnold, A., & Pestell, R. G. (1995) · Journal of Biological Chemistry · doi:10.1074/jbc.270.40.23589 · Cited by 802
Shin, I., Yakes, F. M., Rojo, F., Shin, N.-Y., Bakin, A. V., Baselga, J. M., & Arteaga, C. L. (2002) · Nature Medicine · doi:10.1038/nm759 · Cited by 797
Viglietto, G., Motti, M. L., Bruni, P., Melillo, R. M., D’Alessio, A., Califano, D., Vinci, F., Chiappetta, G., Tsichlis, P. N., Bellacosa, A., et al. (2002) · Nature Medicine · doi:10.1038/nm762 · Cited by 706
Deficiency in glutamine but not glucose induces MYC-dependent apoptosis in human cells
Yuneva, M., Zamboni, N., Oefner, P., Sachidanandam, R., & Lazebnik, Y. (2007) · The Journal of Cell Biology · doi:10.1083/jcb.200703099 · Cited by 690
GADD45 induction of a G 2 /M cell cycle checkpoint
Wang, X. W., Zhan, Q., Coursen, J. D., Khan, M. A., Kontny, H. U., Yu, L., Hollander, M. C., O’Connor, P. M., Fornace, A. J., & Harris, C. C. (1999) · Proceedings of the National Academy of Sciences · doi:10.1073/pnas.96.7.3706 · Cited by 634
Mitochondrial defects in cancer.
Carew, J. S., & Huang, P. (2002) · Molecular Cancer · doi:10.1186/1476-4598-1-9 · Cited by 586
Molecular mechanisms of glutamine action
Curi, R., Lagranha, C. J., Doi, S. Q., Sellitti, D. F., Procopio, J., Pithon‐Curi, T. C., Corless, M., & Newsholme, P. (2005) · Journal of Cellular Physiology · doi:10.1002/jcp.20339 · Cited by 497
Regulation of human thymidine kinase during the cell cycle.
Sherley, J. L., & Kelly, T. J. (1988) · Journal of Biological Chemistry · doi:10.1016/s0021-9258(18)68484-4 · Cited by 448
Pyruvate Dehydrogenase Complex Activity Controls Metabolic and Malignant Phenotype in Cancer Cells
McFate, T., Mohyeldin, A., Lu, H., Thakar, J. H., Henriques, J., Halim, N. D., Wu, H., Schell, M. J., Tsang, T. M., Teahan, O., et al. (2008) · Journal of Biological Chemistry · doi:10.1074/jbc.m801765200 · Cited by 395
Perturbational profiling of a cell-line model of tumorigenesis by using metabolic measurements
Ramanathan, A., Wang, C., & Schreiber, S. L. (2005) · Proceedings of the National Academy of Sciences · doi:10.1073/pnas.0502267102 · Cited by 362
DNA precursor metabolism and genomic stability
Mathews, C. K. (2006) · The FASEB Journal · doi:10.1096/fj.06-5730rev · Cited by 311
Mitochondrial dysfunction in cancer
Modica-Napolitano, J. S., & Singh, K. K. (2004) · Mitochondrion · doi:10.1016/j.mito.2004.07.027 · Cited by 299
Induction of cyclin D1 overexpression by activated ras.
Filmus, J., Robles, A. I., Shi, W., Wong, M. J. H., Colombo, L. L., & Conti, C. J. (1994) · PubMed · Cited by 295
MACLENNAN, P. A., Brown, R. A., & Rennie, M. J. (1987) · FEBS Letters · doi:10.1016/0014-5793(87)80139-4 · Cited by 283
Deviant energetic metabolism of glycolytic cancer cells
Baggetto, L. G. (1992) · Biochimie · doi:10.1016/0300-9084(92)90016-8 · Cited by 268
Zhuang, Y., & Miskimins, W. K. (2008) · Journal of Molecular Signaling · doi:10.1186/1750-2187-3-18 · Cited by 251
Mathupala, S. P., Rempel, A., & Pedersen, P. L. (1997) · Journal of Bioenergetics and Biomembranes · doi:10.1023/a:1022494613613 · Cited by 250
K-ras as a target for cancer therapy
Friday, B. B., & Adjei, A. A. (2005) · Biochimica et Biophysica Acta (BBA) - Reviews on Cancer · doi:10.1016/j.bbcan.2005.08.001 · Cited by 248
Eriksson, S., Gräslund, A., Skog, S., Thelander, L., & Tribukait, B. (1984) · Journal of Biological Chemistry · doi:10.1016/s0021-9258(20)71265-2 · Cited by 245
Glutamine: a major energy source for cultured mammalian cells.
Zielke, H. R., Zielke, C. L., & Pt, O. (1984) · PubMed · Cited by 240
Zhao, J. J., Cheng, H.-L. M., Jia, S., Wang, L., Gjoerup, O. V., Mikami, A., & Roberts, T. M. (2006) · Proceedings of the National Academy of Sciences · doi:10.1073/pnas.0607899103 · Cited by 234
ras gene Amplification and malignant transformation.
Pulciani, S., Santos, E., Long, L. K., Sorrentino, V., & Barbacid, M. (1985) · Molecular and Cellular Biology · doi:10.1128/mcb.5.10.2836 · Cited by 202
Mazurek, S., & EIGENBRODT, E. (2003) · PubMed · Cited by 136
Thinking globally and acting locally with TOR
Arsham, A. M., & Neufeld, T. P. (2006) · Current Opinion in Cell Biology · doi:10.1016/j.ceb.2006.09.005 · Cited by 127
Ras-dependent carbon metabolism and transformation in mouse fibroblasts
Chiaradonna, F., Sacco, E., Manzoni, R., Giorgio, M., Vanoni, M., & Alberghina, L. (2006) · Oncogene · doi:10.1038/sj.onc.1209528 · Cited by 118
Self-citationMolecular Context of theEGFRMutations: Evidence for the Activation of mTOR/S6K Signaling
Conde, E., Angulo, B., Tang, M., Morente, M. M., Torres‐Lanzas, J., Encuentra, Á. L., López‐Ríos, F., & Sánchez‐Céspedes, M. (2006) · Clinical Cancer Research · doi:10.1158/1078-0432.ccr-05-1362 · Cited by 115
Purine nucleosides and nucleotides stimulate proliferation of a wide range of cell types
Rathbone, M. P., Middlemiss, P. J., Gysbers, J. W., Deforge, S., Costello, P., & Maestro, R. F. D. (1992) · In Vitro Cellular & Developmental Biology - Animal · doi:10.1007/bf02634137 · Cited by 112
Agarwal, M. L., Agarwal, A. M., Taylor, W. R., Chernova, O. B., Sharma, Y., & Stark, G. R. (1998) · Proceedings of the National Academy of Sciences · doi:10.1073/pnas.95.25.14775 · Cited by 110
Regulation of Translation Initiation by Amino Acids in Eukaryotic Cells
Kimball, S. R. (2001) · Progress in molecular and subcellular biology · doi:10.1007/978-3-642-56688-2_6 · Cited by 106
Glutamine modulates phenotype and stimulates proliferation in human colon cancer cell lines.
Turowski, G. A., Rashid, Z., Fu, H., Madri, J. A., & Basson, M. D. (1994) · PubMed · Cited by 105
Effect of Glutamine on Protein Synthesis in Isolated Intestinal Epithelial Cells
Higashiguchi, T., Hasselgren, P.-O. J., Wagner, K. R., & Fischer, J. E. (1993) · Journal of Parenteral and Enteral Nutrition · doi:10.1177/0148607193017004307 · Cited by 101
Effect of amino acid deprivation on initiation of protein synthesis in rat hepatocytes
Everson, W. V., Flaim, K. E., Susco, D. M., Kimball, S. R., & Jefferson, L. S. (1989) · American Journal of Physiology-Cell Physiology · doi:10.1152/ajpcell.1989.256.1.c18 · Cited by 88
Chiaradonna, F., Gaglio, D., Vanoni, M., & Alberghina, L. (2006) · Biochimica et Biophysica Acta (BBA) - Bioenergetics · doi:10.1016/j.bbabio.2006.08.001 · Cited by 79
Self-citationControlling cell growth and survival through regulated nutrient transporter expression
Edinger, A. L. (2007) · Biochemical Journal · doi:10.1042/bj20070490 · Cited by 77
Kokkinakis, D. M., Liu, X., & Neuner, R. (2005) · Molecular Cancer Therapeutics · doi:10.1158/1535-7163.mct-05-0141 · Cited by 75
Glutamine Deprivation Induces the Expression ofGADD45 and GADD153 Primarily by mRNA Stabilization
Abcouwer, S. F., Schwarz, C., & Meguid, R. A. (1999) · Journal of Biological Chemistry · doi:10.1074/jbc.274.40.28645 · Cited by 73
Glutamine as a Regulator of DNA and Protein Biosynthesis in Human Solid Tumor Cell Lines
Wasa, M., Bode, B. P., Abcouwer, S. F., Collins, C. L., Tanabe, K. K., & Souba, W. W. (1996) · Annals of Surgery · doi:10.1097/00000658-199608000-00012 · Cited by 70
Role of glutamine on the de novo purine nucleotide synthesis in Caco-2 cells
Bozá, J., Moënnoz, D., Bournot, C. E., Blum, S., Zbinden, I., Finot, P. A., & Ballèvre, O. P. (2000) · European Journal of Nutrition · doi:10.1007/s003940050074 · Cited by 64
Acute L ‐glutamine deprivation compromises VEGF‐a upregulation in A549/8 human carcinoma cells
Drogat, B., Bouchecareilh, M., North, S., Petibois, C., Déléris, G., Chevet, É., Bikfalvi, A., & Moenner, M. (2007) · Journal of Cellular Physiology · doi:10.1002/jcp.21044 · Cited by 62
Agarwal, M. K., Hastak, K., Jackson, M. W., Breit, S. N., Stark, G. R., & Agarwal, M. L. (2006) · Proceedings of the National Academy of Sciences · doi:10.1073/pnas.0607210103 · Cited by 62
Rates of DNA synthesis during the S-phase of HeLa cells.
Collins, J. M. (1978) · Journal of Biological Chemistry · doi:10.1016/s0021-9258(17)34330-2 · Cited by 62
The c-K-ras gene and human cancer (review).
Kahn, S., Yamamoto, F., Almoguera, C., Winter, E., Forrester, K., Jordano, J., & Perucho, M. (1987) · PubMed · Cited by 55
Leung‐Pineda, V., Pan, Y., Chen, H., & Kilberg, M. S. (2004) · Biochemical Journal · doi:10.1042/bj20031383 · Cited by 51
P21Cip1 induced by Raf is associated with increased Cdk4 activity in hematopoietic cells
Chang, F., & McCubrey, J. A. (2001) · Oncogene · doi:10.1038/sj.onc.1204564 · Cited by 48
Effects of glutamine deprivation on protein synthesis in a model of human enterocytes in culture
Bacquer, O. L., Nazih, H., Blottière, H. M., Meynial‐Denis, D., LABOISSE, C. L., & Darmaun, D. (2001) · American Journal of Physiology-Gastrointestinal and Liver Physiology · doi:10.1152/ajpgi.2001.281.6.g1340 · Cited by 44
Activation of a human c-K-rasoncogeoe
Yamamoto, F., & Perucho, M. (1984) · Nucleic Acids Research · doi:10.1093/nar/12.23.8873 · Cited by 42
Bossù, P., Vanoni, M., Wanke, V., Cesaroni, M. P., Tropea, F., Melillo, G., Asti, C., Porzio, S., Ruggiero, P., Cioccio, V. D., et al. (2000) · Oncogene · doi:10.1038/sj.onc.1203539 · Cited by 36
Self-citationDeoxyribonucleoside triphosphate metabolism and the mammalian cell cycle
Eriksson, S., Skog, S., Tribukait, B., & Jäderberg, K. (1984) · Experimental Cell Research · doi:10.1016/0014-4827(84)90774-2 · Cited by 30
Vanoni, M., Bertini, R., Sacco, E., Fontanella, L., Rieppi, M., Colombo, S., Martegani, E., Carrera, V., Moroni, A., Bizzarri, C., et al. (1999) · Journal of Biological Chemistry · doi:10.1074/jbc.274.51.36656 · Cited by 26
Self-citationLamb, J., & Wheatley, D. N. (2000) · Experimental Cell Research · doi:10.1006/excr.1999.4779 · Cited by 23
Zhuang, Y., & Miskimins, W. K. (2008) · Cited by 18
Eriksson, S., Groppi, V. E., Ullman, B., & Martin, D. W. (1984) · Advances in experimental medicine and biology · doi:10.1007/978-1-4757-0390-0_77 · Cited by 4
Cited by
Sorted by citations
The emerging hallmarks of cancer metabolism
Pavlova, N. N., & Thompson, C. B. (2016) · Cell Metabolism · doi:10.1016/j.cmet.2015.12.006 · Cited by 5,926
Understanding the Intersections between Metabolism and Cancer Biology
Heiden, M. G. V., & DeBerardinis, R. J. (2017) · Cell · doi:10.1016/j.cell.2016.12.039 · Cited by 2,369
From Krebs to clinic: glutamine metabolism to cancer therapy
Altman, B. J., Stine, Z. E., & Dang, C. V. (2016) · Nature Reviews Cancer · doi:10.1038/nrc.2016.71 · Cited by 2,119
Macropinocytosis of protein is an amino acid supply route in Ras-transformed cells
Commisso, C., Davidson, S. M., Soydaner-Azeloglu, R. G., Parker, S. J., Kamphorst, J. J., Hackett, S., Grabocka, E., Nofal, M., Drebin, J. A., Thompson, C. B., et al. (2013) · Nature · doi:10.1038/nature12138 · Cited by 1,683
Q's next: the diverse functions of glutamine in metabolism, cell biology and cancer
DeBerardinis, R. J., & Cheng, T. (2010) · Oncogene · doi:10.1038/onc.2009.358 · Cited by 1,365
Metadata
- Authors
- Gaglio, D., Soldati, C., Vanoni, M., Alberghina, L., & Chiaradonna, F.
- Affiliations
- University of Milano-Bicocca (IT)
- Corresponding author
- Chiaradonna, Ferdinando
- Venue
- PLoS ONE
- Publisher
- Public Library of Science (PLoS)
- Published
- 2009-03-05
- Volume
- 4
- Issue
- 3
- Pages
- e4715
- ISSN
- 1932-6203 (ISSN-L)
- PMC
- PMC2650790
- OpenAlex
- W2070710923
- Cited by
- 164
- References
- 60
- Citations by year
- 2026: 2 · 2025: 5 · 2024: 12 · 2023: 9 · 2022: 21 · 2021: 11 · 2020: 10 · 2019: 16 · 2018: 6 · 2017: 12 · 2016: 9 · 2015: 12 · 2014: 14 · 2013: 8 · 2012: 6
- FWCI
- 1.90
- Type
- journal article
- Language
- en
- Open access
- gold
- doi.org
- Locations
- PLoS ONE (publishedVersion, cc-by)
- PubMed Central (publishedVersion, cc-by)
- PubMed (publishedVersion)
- BOA (University of Milano-Bicocca) (submittedVersion, cc-by)
- DOAJ (DOAJ: Directory of Open Access Journals) (submittedVersion, cc-by-sa)
- Figshare (submittedVersion, cc-by)
- Funders
- Fund for Astrophysical Research
- Regione Lombardia
- Topics
- Life Sciences › Biochemistry, Genetics and Molecular Biology › Cancer Research › Cancer, Hypoxia, and Metabolism
- Life Sciences › Biochemistry, Genetics and Molecular Biology › Biochemistry › Amino Acid Enzymes and Metabolism
- Life Sciences › Biochemistry, Genetics and Molecular Biology › Cancer Research › Cancer, Lipids, and Metabolism
- Keywords
- glutamine deprivation, deoxyribonucleotides, G1/S transition, Ras signaling, guanine nucleotide exchange factor, cell cycle arrest, cancer metabolism, metabolic reprogramming, nutritional stress, cell proliferation
- MeSH terms
- Animals, Cell Cycle, Cell Transformation, Neoplastic, Deoxyribonucleotides, Fibroblasts, Glutamine, Genes, ras, S Phase, 3T3 Cells, Cell Proliferation, Mice
About these checks
Registry, retraction, Cites and statistics results are computed, not judged, with one exception: a printed reference that no index lists is read once by a model before it counts as a citation error. Claims are extracted by a model and kept only when their quote appears verbatim in the text; each cited source is then checked, with a model’s help, for whether it says what the claim relies on. Those verdicts can be wrong — read the claim’s quote and the cited source before relying on one.
Statistics and arithmetic are recomputed, not judged.
Confidence bands are shown only for fields calibrated on our annotated test set. None is calibrated yet, so no band is shown.
What counts as a claim ›How we measure confidence ›How we check this ›
Are you an author, or do you see a problem with this page? Request a review
