

Alternative Complement Pathway Deregulation Is Correlated with Dengue Severity
Open accessThe DOI matches its Crossref record; 52 of the 52 references it cites were found in a registry or an index.
Abstract
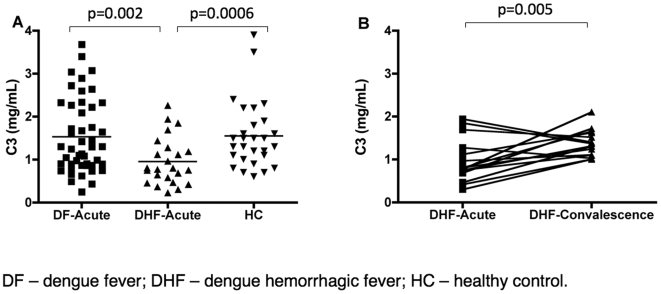
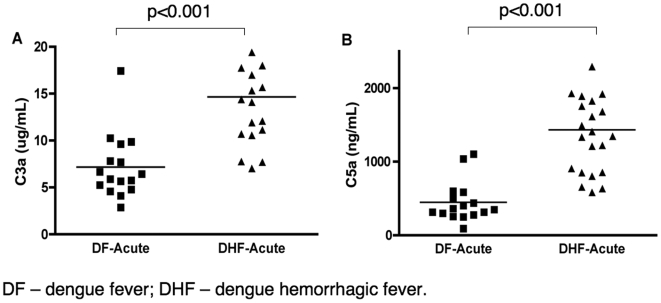
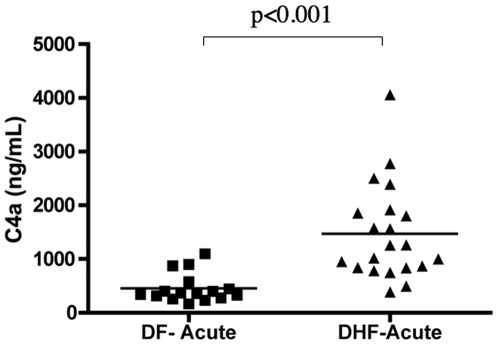
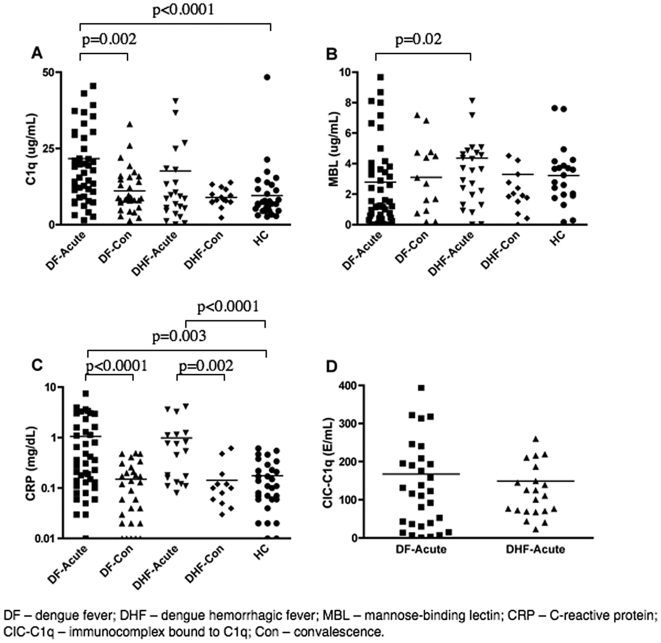
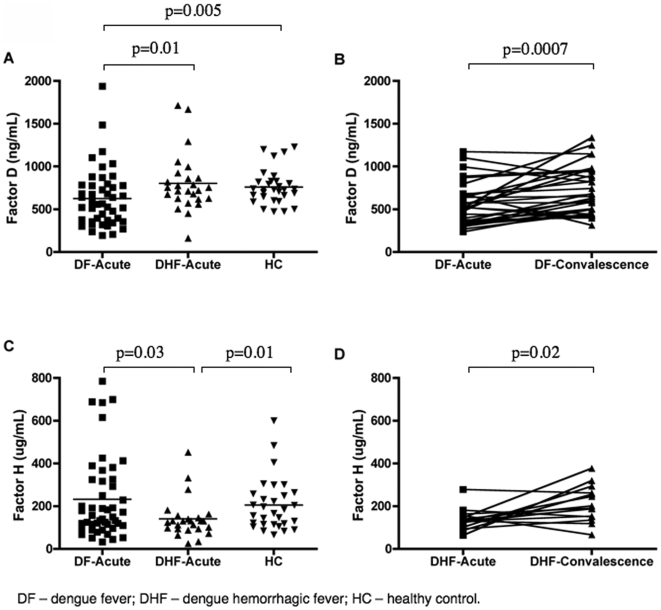
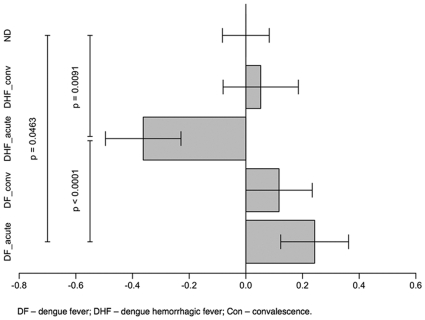
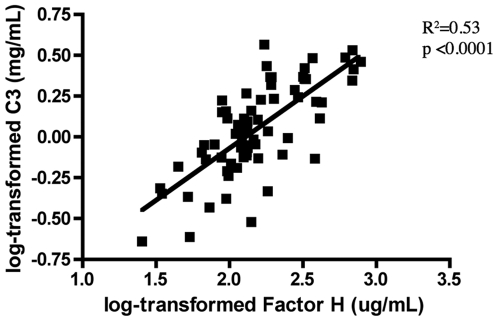
BACKGROUND: The complement system, a key component that links the innate and adaptive immune responses, has three pathways: the classical, lectin, and alternative pathways. In the present study, we have analyzed the levels of various complement components in blood samples from dengue fever (DF) and dengue hemorrhagic fever (DHF) patients and found that the level of complement activation is associated with disease severity. METHODS AND RESULTS: Patients with DHF had lower levels of complement factor 3 (C3; p = 0.002) and increased levels of C3a, C4a and C5a (p<0.0001) when compared to those with the less severe form, DF. There were no significant differences between DF and DHF patients in the levels of C1q, immunocomplexes (CIC-CIq) and CRP. However, small but statistically significant differences were detected in the levels of MBL. In contrast, the levels of two regulatory proteins of the alternative pathway varied widely between DF and DHF patients: DHF patients had higher levels of factor D (p = 0.01), which cleaves factor B to yield the active (C3bBb) C3 convertase, and lower levels of factor H (p = 0.03), which inactivates the (C3bBb) C3 convertase, than did DF patients. When we considered the levels of factors D and H together as an indicator of (C3bBb) C3 convertase regulation, we found that the plasma levels of these regulatory proteins in DHF patients favored the formation of the (C3bBb) C3 convertase, whereas its formation was inhibited in DF patients (p<0.0001). CONCLUSION: The data suggest that an imbalance in the levels of regulatory factors D and H is associated with an abnormal regulation of complement activity in DHF patients.
Overview
The claims and statistics of this paper haven’t been checked yet.
Free: it reads the open-access text and checks the first 5 claims that cite a source we can check. Create a free account to check every claim.
Integrity signals
Registry
Cites
Statistics
Figures
Verification
Claims the paper makes
The claims and statistics of this paper haven’t been checked yet.
Free: it reads the open-access text and checks the first 5 claims that cite a source we can check. Create a free account to check every claim.
Claims other papers make about this one
Each is checked against this paper’s own text: does it say what the citing paper says it does?
The source backs part of the claim, not all of it — or backs it for a different population, condition or comparison.
In the citing paper
“Observed level of C3a increase is potentially biologically relevant, since less than 1.5-fold increase of C3a is observed in acute phase of thrombotic thrombocytopenic purpura (form of TMA) in human (35). Three-fold C3a increase is observed in patients with dengue hemorrhagic fever compared to infected but not ill patients (36).”
From Pre-existing humoral immunity and complement pathway contribute to immunogenicity of adeno-associated virus (AAV) vector in human blood (2022) · cites this paper as [36]
Experimental — accuracy not yet measured
Self-check
Percentages, sums and reported differences re-computed from the paper’s own numbers.
The self-check needs the paper’s full text.
Citations
Cites
Walport, M. J. (2001) · New England Journal of Medicine · doi:10.1056/nejm200104053441406 · Cited by 2,927
Adipose tissue, adipokines, and inflammation
Fantuzzi, G. (2005) · Journal of Allergy and Clinical Immunology · doi:10.1016/j.jaci.2005.02.023 · Cited by 2,606 · cited 1×
“Factor D, also termed adipsin, is a rate limiting serine protease produced by adipocytes, monocytes, and macrophages [25].”
BackgroundWiklund, R. A., & Rosenbaum, S. H. (1997) · New England Journal of Medicine · doi:10.1056/nejm199710163371606 · Cited by 2,149
Lanciotti, R. S., Calisher, C. H., Gubler, D. J., Chang, G. J., & Vorndam, A. V. (1992) · Journal of Clinical Microbiology · doi:10.1128/jcm.30.3.545-551.1992 · Cited by 1,818
Isolation of a Singh's Aedes albopictus Cell Clone Sensitive to Dengue and Chikungunya Viruses
Igarashi, A. (1978) · Journal of General Virology · doi:10.1099/0022-1317-40-3-531 · Cited by 805
Avirutnan, P., Punyadee, N., Noisakran, S., Komoltri, C., Thiemmeca, S., Auethavornanan, K., Jairungsri, A., Kanlaya, R., Tangthawornchaikul, N., Puttikhunt, C., et al. (2006) · The Journal of Infectious Diseases · doi:10.1086/500949 · Cited by 509
Avirutnan, P., Malasit, P., Seliger, B., Bhakdi, S., & Husmann, M. (1998) · The Journal of Immunology · doi:10.4049/jimmunol.161.11.6338 · Cited by 377
Lai, C.-Y., Tsai, W.-Y., Lin, S.-R., Kao, C.-L., Hu, H.-P., King, C.-C., Wu, H.-C., Chang, G.-J., & Wang, W.-K. (2008) · Journal of Virology · doi:10.1128/jvi.00316-08 · Cited by 326
The alternative complement pathway revisited
Harboe, M., & Mollnes, T. E. (2008) · Journal of Cellular and Molecular Medicine · doi:10.1111/j.1582-4934.2008.00350.x · Cited by 316
Chung, K. M., Liszewski, M. K., Nybakken, G., Davis, A. E., Townsend, R. R., Fremont, D. H., Atkinson, J. P., & Diamond, M. S. (2006) · Proceedings of the National Academy of Sciences · doi:10.1073/pnas.0605668103 · Cited by 238
Research works printed but not linked: 4
- MJ Walport, 2001, Complement. First of two parts., N Engl J Med, 344, 1058
- EJM Nascimento, Gene expression profiling during acute febrile stage of dengue infection predicts the clinical outcome., Journal of Clinical Investigation
- M Harboe, 2008, The alternative complement pathway revisited., J Cell Mol Med
- B Acioli-Santos, Complement factor H promoter polymorphism (C-257T) induces high gene expression and dengue hemorrhagic fever protection., PNAS
Cited by
Muller, D. A., & Young, P. R. (2013) · Antiviral Research · doi:10.1016/j.antiviral.2013.03.008 · Cited by 572
“Although other viral proteins may contribute, secreted NS1 is likely to be the major viral antigen responsible for immune complex formation and an important trigger of complement activation (Avirutnan et al., 2006; Nascimento et al., 2009) (Fig.”
BackgroundImmune complement and coagulation dysfunction in adverse outcomes of SARS-CoV-2 infection
Ramlall, V., Thangaraj, P. M., Meydan, C., Foox, J., Butler, D., Kim, J., May, B., De Freitas, J. K., Glicksberg, B. S., Mason, C. E., et al. (2020) · Nature Medicine · doi:10.1038/s41591-020-1021-2 · Cited by 351
Pathogenesis of the Viral Hemorrhagic Fevers
Paessler, S., & Walker, D. H. (2013) · Annual Review of Pathology: Mechanisms of Disease · doi:10.1146/annurev-pathol-020712-164041 · Cited by 309
“Comparison between the complement levels of patients infected with dengue virus 3 who had uncomplicated dengue fever or DHF revealed that patients with the latter disease had decreased plasma concentrations of C3 and factor H and increased levels of C3a, C4a, C5a, mannose-binding ligand, and factor D (60).”
BackgroundPathogenesis of vascular leak in dengue virus infection
Malavige, G. N., & Ogg, G. S. (2017) · Immunology · doi:10.1111/imm.12748 · Cited by 285
Fc-Mediated Antibody Effector Functions During Respiratory Syncytial Virus Infection and Disease
van Erp, E. A., Luytjes, W., Ferwerda, G., & van Kasteren, P. B. (2019) · Frontiers in Immunology · doi:10.3389/fimmu.2019.00548 · Cited by 281
“In contrast, complement activation has also been suggested to contribute to disease severity in dengue virus (86, 87) and HIV infection (88, 89).”
Background
Metadata
- Authors
- Nascimento, E. J. M., Silva, A. M., Cordeiro, M. T., Brito, C. A., Gil, L. H. V. G., Braga-Neto, U., & Marques, E. T. A.
- Affiliations
- Johns Hopkins University (US)
- Instituto Aggeu Magalhães (BR)
- Texas A&M University (US)
- Corresponding author
- Marques, Ernesto T. A.
- ORCID
- Venue
- PLoS ONE
- Publisher
- Public Library of Science (PLoS)
- Published
- 2009-08-26
- Volume
- 4
- Issue
- 8
- Pages
- e6782
- ISSN
- 1932-6203 (ISSN-L)
- PMC
- PMC2728508
- OpenAlex
- W1999543219
- Cited by
- 124
- References
- 51
- Citations by year
- 2026: 5 · 2025: 6 · 2024: 5 · 2023: 2 · 2022: 6 · 2021: 8 · 2020: 16 · 2019: 11 · 2018: 6 · 2017: 7 · 2016: 6 · 2015: 9 · 2014: 6 · 2013: 13 · 2012: 9
- FWCI
- 2.56
- Type
- journal article
- Language
- en
- Open access
- gold
- doi.org
- Locations
- PLoS ONE (publishedVersion, cc-by)
- PubMed Central (publishedVersion, cc-by)
- PubMed (publishedVersion)
- Americanae (AECID Library) (submittedVersion, other-oa)
- Arca - Repositório Institucional da Fiocruz (submittedVersion, other-oa)
- DOAJ (DOAJ: Directory of Open Access Journals) (submittedVersion, cc-by-sa)
- LA Referencia (Red Federada de Repositorios Institucionales de Publicaciones Científicas) (submittedVersion, other-oa)
- Funders
- Fundação Oswaldo Cruz
- National Institutes of Health
- National Institute of Allergy and Infectious Diseases (PDTIS RVR09-FIOCRUZ, RVR09-FIOCRUZ, U19AI056541)
- Topics
- Life Sciences › Immunology and Microbiology › Immunology › Complement system in diseases
- Health Sciences › Medicine › Public Health, Environmental and Occupational Health › Mosquito-borne diseases and control
- Health Sciences › Medicine › Hematology › Coagulation, Bradykinin, Polyphosphates, and Angioedema
- Keywords
- dengue hemorrhagic fever, dengue, alternative complement pathway, complement regulation, factor D, complement factor H, C3 convertase, complement activation, disease severity, complement proteins, mannose-binding lectin, complement C3
- MeSH terms
- Adolescent, Adult, Complement System Proteins, Complement Activation, Dengue, Enzyme-Linked Immunosorbent Assay, Female, Humans, Male, Middle Aged, Severity of Illness Index, Young Adult
About these checks
Registry, retraction, Cites and statistics results are computed, not judged, with one exception: a printed reference that no index lists is read once by a model before it counts as a citation error. Claims are extracted by a model and kept only when their quote appears verbatim in the text; each cited source is then checked, with a model’s help, for whether it says what the claim relies on. Those verdicts can be wrong — read the claim’s quote and the cited source before relying on one.
Statistics and arithmetic are recomputed, not judged.
Confidence bands are shown only for fields calibrated on our annotated test set. None is calibrated yet, so no band is shown.
What counts as a claim ›How we measure confidence ›How we check this ›
Are you an author, or do you see a problem with this page? Request a review
How to cite
Cite CoChat for the checks on this page, and the paper for its own findings.
- This page
- CoChat. (2026). Citation check: Alternative Complement Pathway Deregulation Is Correlated with Dengue Severity. https://app.cochat.ai/papers/10.1371/journal.pone.0006782
- The paper
- Nascimento, E. J. M., Silva, A. M., Cordeiro, M. T., Brito, C. A., Gil, L. H. V. G., Braga-Neto, U., & Marques, E. T. A. (2009). Alternative Complement Pathway Deregulation Is Correlated with Dengue Severity. PLoS ONE. https://doi.org/10.1371/journal.pone.0006782
Data sources
Bibliographic data: Semantic Scholar, OpenAlex, Crossref.
Contains information from the Semantic Scholar Academic Graph Datasets, made available under the ODC Attribution License (ODC-BY 1.0).
Semantic Scholar’s data is described in: Kinney, R., et al. (2023). The Semantic Scholar Open Data Platform. arXiv:2301.10140.
