

The DOI matches its Crossref record; 29 of the 29 references it cites were found in a registry or an index.
Muscle-Specific Adaptations, Impaired Oxidative Capacity and Maintenance of Contractile Function Characterize Diet-Induced Obese Mouse Skeletal Muscle
Open accessAbstract
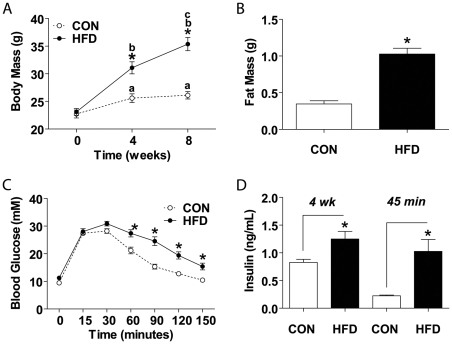
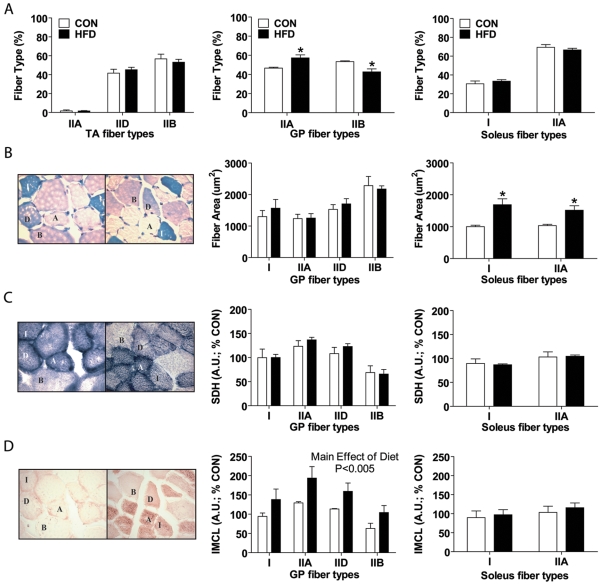
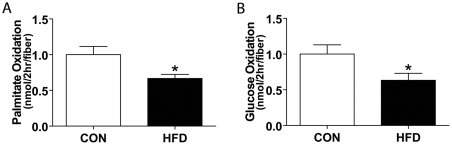
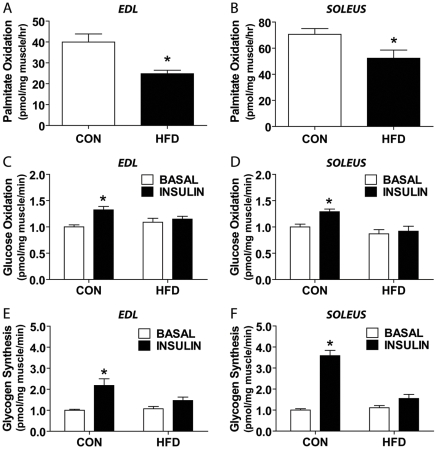
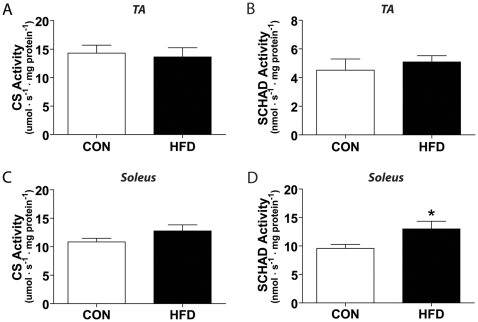
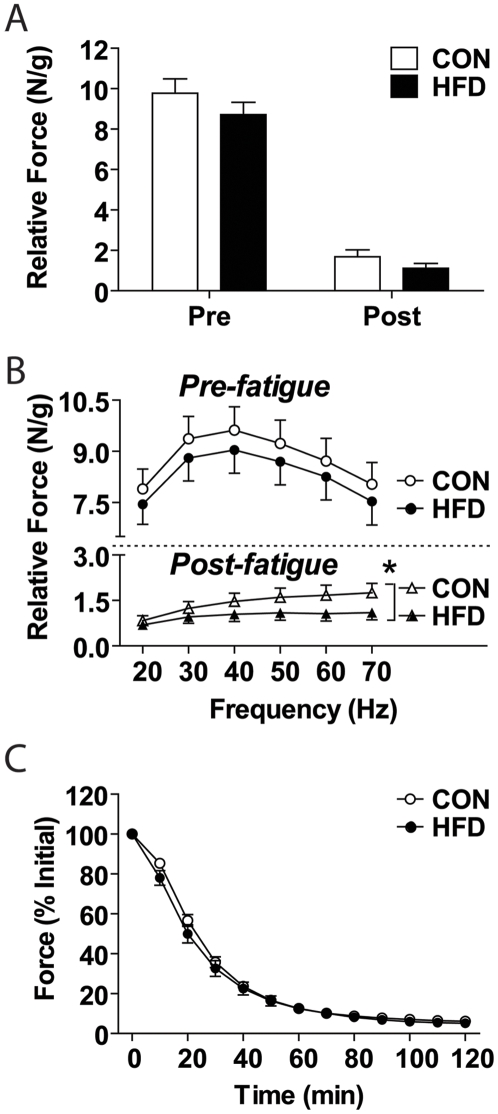
BACKGROUND: The effects of diet-induced obesity on skeletal muscle function are largely unknown, particularly as it relates to changes in oxidative metabolism and morphology. PRINCIPAL FINDINGS: Compared to control fed mice, mice fed a high fat diet (HFD; 60% kcal: fat) for 8 weeks displayed increased body mass and insulin resistance without overt fasting hyperglycemia (i.e. pre-diabetic). Histological analysis revealed a greater oxidative potential in the HFD gastrocnemius/plantaris (increased IIA, reduced IIB fiber-type percentages) and soleus (increased I, IIA cross-sectional areas) muscles, but no change in fiber type percentages in tibialis anterior muscles compared to controls. Intramyocellular lipid levels were significantly increased relative to control in HFD gastrocnemius/plantaris, but were similar to control values in the HFD soleus. Using a novel, single muscle fiber approach, impairments in complete palmitate and glucose oxidation (72.8+/-6.6% and 61.8+/-9.1% of control, respectively; p<0.05) with HFD were detected. These reductions were consistent with measures made using intact extensor digitorum longus and soleus muscles. Compared to controls, no difference in succinate dehydrogenase or citrate synthase enzyme activities were observed between groups in any muscle studied, however, short-chain fatty acyl CoA dehydrogenase (SCHAD) activity was elevated in the HFD soleus, but not tibialis anterior muscles. Despite these morphological and metabolic alterations, no significant difference in peak tetanic force or low-frequency fatigue rates were observed between groups. CONCLUSIONS: These findings indicate that HFD induces early adaptive responses that occur in a muscle-specific pattern, but are insufficient to prevent impairments in oxidative metabolism with continued high-fat feeding. Moreover, the morphological and metabolic changes which occur with 8 weeks of HFD do not significantly impact muscle contractile properties.
Overview
The claims and statistics of this paper haven’t been checked yet.
Run the check — free, no account needed. It reads the open-access text and checks the sources it cites.
Integrity signals
Registry
Cites
Statistics
Figures
Verification
Claims the paper makes
The claims and statistics of this paper haven’t been checked yet.
Run the check — free, no account needed. It reads the open-access text and checks the sources it cites.
Claims other papers make about this one
Each is checked against this paper’s own text: does it say what the citing paper says it does?
In the citing paper
“muscle β-oxidation increases in response to a high-fat diet (HFD) [83–86], although excessive lipid content or duration of such diets can exceed this capacity, leading to ectopic lipid accumulation and impaired lipid metabolism [87–91].”
From Targeting Intramyocellular Lipids to Improve Aging Muscle Function (2025) · cites this paper as [90]
Self-check
Percentages, sums and reported differences re-computed from the paper’s own numbers.
The self-check needs the paper’s full text.
Citations
Cites
Koves, T. R., Ussher, J. R., Noland, R. C., Slentz, D., Mosedale, M., Ilkayeva, O., Bain, J., Stevens, R., Dyck, J. R. B., Newgard, C. B., et al. (2008) · Cell Metabolism · doi:10.1016/j.cmet.2007.10.013 · Cited by 1,990
Bonnard, C., Durand, A., Peyrol, S., Chanseaume, E., Chauvin, M.-A., Morio, B., Vidal, H., & Rieusset, J. (2008) · Journal of Clinical Investigation · doi:10.1172/jci32601 · Cited by 819
Sparks, L. M., Xie, H., Koza, R. A., Mynatt, R., Hulver, M. W., Bray, G. A., & Smith, S. R. (2005) · Diabetes · doi:10.2337/diabetes.54.7.1926 · Cited by 629 · cited 1×
“Furthermore, an increase in oxidative phosphorylation protein complexes have been measured in the gastrocnemius muscles following 4 weeks of high fat feeding [6], while a decreased expression of oxidative phosphorylation genes and cytochrome C protein has been demonstrated in the quadriceps muscles in response to 3 we…”
BackgroundInfluentialBurkholder, T. J., Fingado, B., Baron, S., & Lieber, R. L. (1994) · Journal of Morphology · doi:10.1002/jmor.1052210207 · Cited by 527
Excess Lipid Availability Increases Mitochondrial Fatty Acid Oxidative Capacity in Muscle
Turner, N., Bruce, C. R., Beale, S. M., Hoehn, K. L., So, T., Rolph, M. S., & Cooney, G. J. (2007) · Diabetes · doi:10.2337/db07-0093 · Cited by 520
Koopman, R., Schaart, G., & Hesselink, M. K. C. (2001) · Histochemistry and Cell Biology · doi:10.1007/s004180100297 · Cited by 471
Type 2 Diabetes, Muscle Strength, and Impaired Physical Function
Sayer, A. A., Dennison, E. M., Syddall, H. E., Gilbody, H. J., Phillips, D. I. W., & Cooper, C. (2005) · Diabetes Care · doi:10.2337/diacare.28.10.2541 · Cited by 366
Hämäläinen, N., & Pette, D. (1993) · Journal of Histochemistry & Cytochemistry · doi:10.1177/41.5.8468455 · Cited by 350
Muscle Fiber Composition and Capillary Density in Women and Men With NIDDM
Mårin, P., Andersson, B., Krotkiewski, M., & Björntorp, P. A. (1994) · Diabetes Care · doi:10.2337/diacare.17.5.382 · Cited by 342
Lee, J. S., Pinnamaneni, S. K., Eo, S. J., Cho, I. H., Pyo, J. H., Kim, C. K., Sinclair, A. J., Febbraio, M. A., & Watt, M. J. (2005) · Journal of Applied Physiology · doi:10.1152/japplphysiol.01438.2005 · Cited by 325
Cited by
Sorted by citations
Bloemberg, D., & Quadrilatero, J. (2012) · PLoS ONE · doi:10.1371/journal.pone.0035273 · Cited by 629
Mechanisms Modulating Skeletal Muscle Phenotype
Blaauw, B., Schiaffino, S., & Reggiani, C. (2013) · Comprehensive physiology · doi:10.1002/cphy.c130009 · Cited by 298
Miljkovic, I., & Zmuda, J. M. (2010) · Current Opinion in Clinical Nutrition & Metabolic Care · doi:10.1097/mco.0b013e328337d826 · Cited by 235
The effects of obesity on skeletal muscle contractile function
Tallis, J. A., James, R. S., & Seebacher, F. (2018) · Journal of Experimental Biology · doi:10.1242/jeb.163840 · Cited by 235
Rato, L., Duarte, A. I., Tomás, G. D., Santos, M. S., Moreira, P. I., Socorro, S., Cavaco, J. E. B., Alves, M. G., & Oliveira, P. F. (2013) · Biochimica et Biophysica Acta (BBA) - Bioenergetics · doi:10.1016/j.bbabio.2013.12.008 · Cited by 157
Dorenkott, M. R., Griffin, L. E., Goodrich, K. M., Thompson‐Witrick, K. A., Fundaro, G., Ye, L., Stevens, J. R., Ali, M. M., O’Keefe, S. F., Hulver, M. W., et al. (2014) · Journal of Agricultural and Food Chemistry · doi:10.1021/jf500333y · Cited by 153
Gouspillou, G., Sgarioto, N., Norris, B. A., Barbat‐Artigas, S., Aubertin‐Leheudre, M., Morais, J. A., Burelle, Y., Taivassalo, T., & Hepple, R. T. (2014) · PLoS ONE · doi:10.1371/journal.pone.0103044 · Cited by 141
Adiponectin—Consideration for its Role in Skeletal Muscle Health
Krause, M. P., Milne, K. J., & Hawke, T. J. (2019) · International Journal of Molecular Sciences · doi:10.3390/ijms20071528 · Cited by 121
Self-citationPLIN5 deletion remodels intracellular lipid composition and causes insulin resistance in muscle
Mason, R. R., Mokhtar, R. A. M., Matzaris, M., Selathurai, A., Kowalski, G. M., Mokbel, N., Meikle, P. J., Bruce, C. R., & Watt, M. J. (2014) · Molecular Metabolism · doi:10.1016/j.molmet.2014.06.002 · Cited by 118
Lehti, M., Donelan, E. M., Abplanalp, W., Al-Massadi, O., Habegger, K., Weber, J., Ress, C., Mansfeld, J., Somvanshi, S., Trivedi, C. J., et al. (2013) · Circulation · doi:10.1161/circulationaha.113.001551 · Cited by 84
Diet-induced obesity alters skeletal muscle fiber types of male but not female mice
DeNies, M. S., Johnson, J., Maliphol, A. B., Bruno, M., Kim, A., Rizvi, A., Rustici, K., & Medler, S. (2014) · Physiological Reports · doi:10.1002/phy2.204 · Cited by 94
Eshima, H., Tamura, Y., Kakehi, S., Kurebayashi, N., Murayama, T., Nakamura, K., Kakigi, R., Okada, T., Sakurai, T., Kawamori, R., et al. (2017) · Physiological Reports · doi:10.14814/phy2.13250 · Cited by 88
Chen, L.-L., Zhang, H.-H., Zheng, J., Hu, X., Kong, W., Hu, D., Wang, S.-X., & Zhang, P. (2011) · Metabolism · doi:10.1016/j.metabol.2011.04.002 · Cited by 81
Krause, M. P., Moradi, J., Nissar, A. A., Riddell, M. C., & Hawke, T. J. (2011) · Diabetes · doi:10.2337/db11-0007 · Cited by 73
Self-citationMastrocola, R., Collino, M., Nigro, D., Chiazza, F., D’Antona, G., Aragno, M., & Minetto, M. A. (2015) · PLoS ONE · doi:10.1371/journal.pone.0119587 · Cited by 77
Mastrocola, R., Nigro, D., Chiazza, F., Medana, C., Bello, F. D., Boccuzzi, G., Collino, M., & Aragno, M. (2015) · Free Radical Biology and Medicine · doi:10.1016/j.freeradbiomed.2015.12.022 · Cited by 76
Ferretti, R., Moura, E. G., dos Santos, V. C., Caldeira, E. J., Conte, M., Matsumura, C. Y., Pertille, A., & Mosqueira, M. (2018) · PLoS ONE · doi:10.1371/journal.pone.0199728 · Cited by 77
D'Souza, D. M., Trajcevski, K., Al‐Sajee, D., Wang, D. C., Thomas, M. M., Anderson, J. E., & Hawke, T. (2015) · Physiological Reports · doi:10.14814/phy2.12506 · Cited by 62
Self-citationApontes, P., Liu, Z., Su, K., Benard, O., Youn, D. Y., Li, X., Li, W., Mirza, R. H., Bastie, C. C., Jelicks, L. A., et al. (2014) · Diabetes · doi:10.2337/db14-0006 · Cited by 69
Lipotoxicity, aging, and muscle contractility: does fiber type matter?
Carter, C. S., Justice, J. N., & Thompson, L. (2019) · GeroScience · doi:10.1007/s11357-019-00077-z · Cited by 66
Krause, M., Al‐Sajee, D., D'Souza, D. M., Rebalka, I. A., Moradi, J., Riddell, M. C., & Hawke, T. (2013) · PLoS ONE · doi:10.1371/journal.pone.0070971 · Cited by 66
Self-citationTallis, J. A., Hill, C., James, R. S., Cox, V. M., & Seebacher, F. (2016) · Journal of Applied Physiology · doi:10.1152/japplphysiol.00836.2016 · Cited by 66
The impact of a high-fat diet in mice is dependent on duration and age, and differs between muscles
Messa, G. A. M., Piasecki, M., Hurst, J., Hill, C., Tallis, J., & Degens, H. (2020) · Journal of Experimental Biology · doi:10.1242/jeb.217117 · Cited by 63
Bajpeyi, S., Covington, J. D., Taylor, E. M., Stewart, L. K., Galgani, J. E., & Henagan, T. M. (2017) · Endocrinology · doi:10.1210/en.2017-00051 · Cited by 60
Interaction between maternal obesity and post-natal over-nutrition on skeletal muscle metabolism
Simar, D., Chen, H., Lambert, K., Mercier, J. G., & Morris, M. J. (2011) · Nutrition Metabolism and Cardiovascular Diseases · doi:10.1016/j.numecd.2010.11.007 · Cited by 55
Čiapaitė, J., van den Berg, S. A. A., Houten, S. M., Nicolay, K., van Dijk, K. W., & Jeneson, J. A. L. (2014) · The Journal of Nutritional Biochemistry · doi:10.1016/j.jnutbio.2014.09.014 · Cited by 58
The biphasic and age-dependent impact of klotho on hallmarks of aging and skeletal muscle function
Clemens, Z. J., Sivakumar, S., Pius, A., Sahu, A., Shinde, S. S., Mamiya, H., Luketich, N., Cui, J., Dixit, P. D., Hoeck, J. D., et al. (2021) · eLife · doi:10.7554/elife.61138 · Cited by 54
Hayashi, A. A., Webb, J. P., Choi, J. M., Baker, C., Lino, M., Trigatti, B. L., Trajcevski, K. E., Hawke, T. J., & Adeli, K. (2011) · American Journal of Physiology-Gastrointestinal and Liver Physiology · doi:10.1152/ajpgi.00425.2010 · Cited by 48
Self-citationPincu, Y., Linden, M. A., Zou, K., Baynard, T., & Boppart, M. D. (2015) · Cytokine · doi:10.1016/j.cyto.2015.01.013 · Cited by 47
Liu, S., Chiu, C., Wang, L.-P., & Chiang, M. (2019) · Marine Drugs · doi:10.3390/md17060380 · Cited by 49
Sorensen, J. C., Petersen, A. C., Timpani, C. A., Campelj, D. G., Cook, J., Trewin, A. J., Stojanovska, V., Stewart, M., Hayes, A., & Rybalka, E. (2017) · Frontiers in Pharmacology · doi:10.3389/fphar.2017.00137 · Cited by 46
Insulin-Dependent H2O2 Production Is Higher in Muscle Fibers of Mice Fed with a High-Fat Diet
Espinosa, A., Campos, C., Díaz‐Vegas, A., Galgani, J. E., Juretić, N., Osorio‐Fuentealba, C., Bucarey, J. L., Tapia, G., Valenzuela, R., Contreras‐Ferrat, A. E., et al. (2013) · International Journal of Molecular Sciences · doi:10.3390/ijms140815740 · Cited by 45
Rotenone induces reductive stress and triacylglycerol deposition in C2C12 cells
He, Q., Wang, M., Petucci, C. J., Gardell, S. J., & Han, X. (2013) · The International Journal of Biochemistry & Cell Biology · doi:10.1016/j.biocel.2013.09.011 · Cited by 44
Metabolic flexibility and obesity in children and youth
Aucouturier, J., Duché, P., & Timmons, B. W. (2011) · Obesity Reviews · doi:10.1111/j.1467-789x.2010.00812.x · Cited by 43
Ives, S. J., Zaleski, K. S., Slocum, C., Escudero, D., Sheridan, C., Legesse, S., Vidal, K., Lagalwar, S., & Reynolds, T. (2020) · Physiological Reports · doi:10.14814/phy2.14630 · Cited by 43
Yu, T., Deuster, P. A., & Chen, Y. (2016) · The Journal of Physiology · doi:10.1113/jp272885 · Cited by 37
Roseno, S. L., Davis, P. R., Bollinger, L. M., Powell, J. J. S., Witczak, C. A., & Brault, J. J. (2015) · Nutrition & Metabolism · doi:10.1186/s12986-015-0037-y · Cited by 36
Trajcevski, K., O'Neill, H., Wang, D. C., Thomas, M. M., Al‐Sajee, D., Steinberg, G., Ceddia, R., & Hawke, T. (2013) · PLoS ONE · doi:10.1371/journal.pone.0071747 · Cited by 39
Self-citationAndrich, D. E., Ou, Y., Melbouci, L., Leduc‐Gaudet, J., Auclair, N., Mercier, J., Secco, B., Tomaz, L. M., Gouspillou, G., Danialou, G., et al. (2018) · Frontiers in Physiology · doi:10.3389/fphys.2018.01327 · Cited by 36
Manta, A., Stouth, D. W., Xhuti, D., Chi, L., Rebalka, I. A., Kalmar, J. M., Hawke, T. J., & Ljubicic, V. (2019) · The Journal of Physiology · doi:10.1113/jp277123 · Cited by 36
Self-citationAcute and chronic changes in rat soleus muscle after high-fat high-sucrose diet
Collins, K. H., Hart, D. A., Smith, I. C. P., Issler, A. M., Reimer, R. A., Seerattan, R. A., Rios, J. L., & Herzog, W. (2017) · Physiological Reports · doi:10.14814/phy2.13270 · Cited by 38
Kallabis, S., Abraham, L., Müller, S., Dzialas, V., Türk, C., Wiederstein, J. L., Bock, T., Nolte, H., Nogara, L., Blaauw, B., et al. (2020) · Skeletal Muscle · doi:10.1186/s13395-020-00226-5 · Cited by 34
The effects of diet composition and chronic obesity on muscle growth and function
de Sousa, L. G. O., Marshall, A. G., Norman, J., Fuqua, J. D., Lira, V. A., Rutledge, J. C., & Bodine, S. C. (2020) · Journal of Applied Physiology · doi:10.1152/japplphysiol.00156.2020 · Cited by 36
Effects of chronic sugar consumption on lipid accumulation and autophagy in the skeletal muscle
Stefanis, D. D., Mastrocola, R., Nigro, D., Costelli, P., & Aragno, M. (2015) · Zeitschrift für Ernährungswissenschaft · doi:10.1007/s00394-015-1086-8 · Cited by 30
Lindinger, M. I., Leung, M., Trajcevski, K. E., & Hawke, T. J. (2011) · The Journal of Physiology · doi:10.1113/jphysiol.2011.206730 · Cited by 30
Self-citationHurst, J., James, R. S., Cox, V. M., Hill, C., & Tallis, J. A. (2018) · European Journal of Applied Physiology · doi:10.1007/s00421-018-4017-6 · Cited by 29
Collino, M., Mastrocola, R., Nigro, D., Chiazza, F., Aragno, M., D’Antona, G., & Minetto, M. A. (2014) · BioMed Research International · doi:10.1155/2014/569623 · Cited by 29
Hind limb ischemia–reperfusion injury in diet-induced obese mice
Albadawi, H., Öklü, R., Cormier, N. R., OʼKeefe, R., Heaton, J. T., Kobler, J. B., Austen, W. G., & Watkins, M. T. (2014) · Journal of Surgical Research · doi:10.1016/j.jss.2014.01.020 · Cited by 28
Thomas, M. M., Wang, D. C., D’Souza, D. M., Krause, M. P., Layne, A. S., Criswell, D. S., O’Neill, H. M., Connor, M. K., Anderson, J. E., Kemp, B. E., et al. (2014) · The FASEB Journal · doi:10.1096/fj.13-238972 · Cited by 28
Self-citationAssociation Between Insulin Resistance and Myosteatosis Measured by Abdominal Computed Tomography
Kim, M., Cho, Y. K., Jung, H. N., Kim, E. H., Lee, M. J., Jung, C. H., Park, J., Kim, H., & Lee, W. J. (2023) · The Journal of Clinical Endocrinology & Metabolism · doi:10.1210/clinem/dgad382 · Cited by 27
Thomas, M. M., Trajcevski, K. E., Coleman, S. K., Jiang, M., Michele, J. D., O’Neill, H. M., Lally, J., Steinberg, G. R., & Hawke, T. J. (2014) · Physiological Reports · doi:10.14814/phy2.12149 · Cited by 27
Self-citationSchönke, M., Massart, J., & Zierath, J. R. (2018) · Journal of Lipid Research · doi:10.1194/jlr.d082370 · Cited by 27
D’Souza, D. M., Roubos, S., Larkin, J., Lloyd, J. C., Emmons, R. S., Chen, H., & Lisio, M. D. (2019) · Scientific Reports · doi:10.1038/s41598-019-43204-8 · Cited by 27
One-Year High Fat Diet Affects Muscle-But Not Brain Mitochondria
Jørgensen, T., Grunnet, N., & Quistorff, B. (2015) · Journal of Cerebral Blood Flow & Metabolism · doi:10.1038/jcbfm.2015.27 · Cited by 26
Influence of muscle fiber type composition on early fat accumulation under high-fat diet challenge
Hua, N., Takahashi, K., Yee, G. M., Kitajima, Y., Katagiri, S., Kojima, M., Anzai, K., Eguchi, Y., & Hamilton, J. A. (2017) · PLoS ONE · doi:10.1371/journal.pone.0182430 · Cited by 26
Pattanakuhar, S., Pongchaidecha, A., Chattipakorn, N., & Chattipakorn, S. C. (2016) · Obesity Research & Clinical Practice · doi:10.1016/j.orcp.2016.09.012 · Cited by 25
Li, X., Higashida, K., Kawamura, T., & Higuchi, M. (2016) · Nutrients · doi:10.3390/nu8040203 · Cited by 24
Brackmann, C., Gabrielsson, B. G., Svedberg, F., Holmäng, A. B., Sandberg, A., & Enejder, A. M. K. (2010) · Journal of Biomedical Optics · doi:10.1117/1.3505024 · Cited by 23
Sfyri, P. P., Yuldasheva, N. Y., Tzimou, A., Giallourou, N., Crispi, V., Aburima, A. A., Beltrán-Álvarez, P., Patel, K., Mougios, V., Swann, J. R., et al. (2018) · Free Radical Biology and Medicine · doi:10.1016/j.freeradbiomed.2018.10.422 · Cited by 22
Kaneko, S., Iida, R., Suga, T., Fukui, T., Morito, M., & Yamane, A. (2011) · The Anatomical Record · doi:10.1002/ar.21472 · Cited by 22
Al‐Sajee, D., Nissar, A. A., Coleman, S. K., Rebalka, I. A., Chiang, A., Wathra, R., van der Ven, P. F. M., Orfanos, Z., & Hawke, T. J. (2015) · Acta Physiologica · doi:10.1111/apha.12455 · Cited by 20
Self-citationGender Dimorphism in Skeletal Muscle Proteome Between Lean and Diet-induced Obese Rats
Oh, T. S., Choi, J., Choi, D. K., Mukherjee, R., Liu, H., & Yun, J. W. (2011) · Cellular Physiology and Biochemistry · doi:10.1159/000335811 · Cited by 19
Nunes, P. M., van de Weijer, T., Veltien, A. A., Arnts, H., Hesselink, M. K. C., Glatz, J. F. C., Schrauwen, P., Tack, C. J., & Heerschap, A. (2012) · American Journal of Physiology-Endocrinology and Metabolism · doi:10.1152/ajpendo.00597.2011 · Cited by 19
Liao, B., & Xu, Y. (2011) · European Journal of Applied Physiology · doi:10.1007/s00421-011-1892-5 · Cited by 19
Markworth, J. F., Durainayagam, B. R., Figueiredo, V. C., Liu, K., Guan, J., MacGibbon, A. K. H., Fong, B., Fanning, A. C., Rowan, A., McJarrow, P., et al. (2017) · Nutrition & Metabolism · doi:10.1186/s12986-017-0161-y · Cited by 18
Poggiogalle, E., Rossignon, F., Carayon, A., Capel, F., Rigaudière, J., Vincent, S. D. S., Bacquer, O. L., Salles, J., Giraudet, C., Patrac, V., et al. (2022) · Frontiers in Physiology · doi:10.3389/fphys.2021.749049 · Cited by 18
Bott, K. N., Gittings, W., Fajardo, V. A., Baranowski, B. J., Vandenboom, R., LeBlanc, P. J., Ward, W. E., & Peters, S. J. (2017) · Molecular Nutrition & Food Research · doi:10.1002/mnfr.201700137 · Cited by 16
Han, J., Kim, M., & Myung, C. (2022) · Molecular Nutrition & Food Research · doi:10.1002/mnfr.202100669 · Cited by 15
Acevedo, L. M., Raya, A. I., Ríos, R., Aguilera‐Tejero, E., & Rivero, J. L. L. (2017) · Journal of Applied Physiology · doi:10.1152/japplphysiol.00282.2017 · Cited by 15
Targeting Intramyocellular Lipids to Improve Aging Muscle Function
Russ, D. W., Manickam, R., & Tipparaju, S. M. (2025) · Lipids in Health and Disease · doi:10.1186/s12944-025-02622-6 · Cited by 15
Jaitovich, A. (2022) · American Journal of Physiology-Cell Physiology · doi:10.1152/ajpcell.00292.2022 · Cited by 16
Matsuba, I., Fujita, R., & Iida, K. (2023) · International Journal of Molecular Sciences · doi:10.3390/ijms24065847 · Cited by 14
Morales, P. E., Monsalves‐Álvarez, M., Tadinada, S. M., Harris, M. P., Ramírez‐Sagredo, A., Ortiz‐Quintero, J., Troncoso, M. F., Gregorio, N. D., Calle, X., Pereira, R. O., et al. (2021) · The FASEB Journal · doi:10.1096/fj.202001593rr · Cited by 13
Voluntary exercise improves metabolic profile in high-fat fed glucocorticoid-treated rats
Beaudry, J. L., Dunford, E. C., Leclair, E., Mandel, E. R., Peckett, A. J., Haas, T. L., & Riddell, M. C. (2015) · Journal of Applied Physiology · doi:10.1152/japplphysiol.00467.2014 · Cited by 13
Botezelli, J. D., Overby, P., Lindo, L., Wang, S., Haïda, O., Lim, G. E., Templeman, N. M., Pauli, J. R., & Johnson, J. D. (2020) · American Journal of Physiology-Endocrinology and Metabolism · doi:10.1152/ajpendo.00128.2020 · Cited by 14
Lindinger, M. I., Leung, M., & Hawke, T. J. (2013) · PLoS ONE · doi:10.1371/journal.pone.0084451 · Cited by 13
Self-citationHou, L., Kongsted, A. H., Ghoreishi, S. M., Takhtsabzy, T. K., Friedrichsen, M. H., Hellgren, L. I., Kadarmideen, H. N., Vaag, A. A., & Nielsen, M. O. (2013) · PLoS ONE · doi:10.1371/journal.pone.0065452 · Cited by 13
The BET inhibitor JQ1 targets fat metabolism and counteracts obesity
Fornelli, C., Cento, A. S., Nevi, L., Mastrocola, R., Alves, G. F., Caretti, G., Collino, M., & Penna, F. (2024) · Journal of Advanced Research · doi:10.1016/j.jare.2024.02.001 · Cited by 14
Turner, M. C., Rimington, R. P., Martin, N. R. W., Fleming, J. W., Capel, A. J., Hodson, L., & Lewis, M. P. (2021) · Journal of Cellular Physiology · doi:10.1002/jcp.30365 · Cited by 10
Sánchez-González, C., Martín, J. C. H., Ansa, B. S., de Arenas, C. N., Stančič, B., Pereira, M. P., Contreras, L., Cuezva, J. M., & Formentini, L. (2022) · Cell Death and Disease · doi:10.1038/s41419-022-05016-z · Cited by 10
Eshima, H., Tamura, Y., Kakehi, S., Kakigi, R., Kawamori, R., & Watada, H. (2020) · Journal of Applied Physiology · doi:10.1152/japplphysiol.00218.2020 · Cited by 11
Tauriainen, E., Storvik, M., Finckenberg, P., Merasto, S., Martonen, E., Pilvi, T. K., Korpela, R., & Mervaala, E. M. A. (2011) · Lifestyle Genomics · doi:10.1159/000327132 · Cited by 10
Yamamoto, H., Eshima, H., Kakehi, S., Kawamori, R., Watada, H., & Tamura, Y. (2022) · Physiological Reports · doi:10.14814/phy2.15478 · Cited by 7
Li, C., Li, N., Zhang, Z., Song, Y., Li, J., Wang, Z., Hai, B., & Zhang, Y. (2023) · Frontiers in Endocrinology · doi:10.3389/fendo.2023.1127524 · Cited by 10
Obesity-driven musculotendinous remodeling impairs tissue resilience to mechanical damage
Cesanelli, L., Minderis, P., Balnytė, I., Ratkevičius, A., Degens, H., & Satkunskienė, D. (2025) · Cell and Tissue Research · doi:10.1007/s00441-025-03967-1 · Cited by 9
Meng, X., Tian, C., Xie, C., Zhang, H., Wang, H., Zhang, M., Lu, Z., Li, D., Chen, L., & Gao, T. (2023) · Food & Function · doi:10.1039/d2fo03926e · Cited by 8
Guerra, J., Ferrer, B., Giralt, M., Comes, G., Carrasco, J., Molinero, A., Serrano, A. L., & Hidalgo, J. (2015) · Cytokine · doi:10.1016/j.cyto.2015.04.018 · Cited by 9
Béland-Millar, A., Takimoto, M., Hamada, T., & Messier, C. (2020) · Brain Research · doi:10.1016/j.brainres.2020.147126 · Cited by 9
Henagan, T. M., Stewart, L. K., Forney, L. A., Sparks, L. M., Johannsen, N. M., & Church, T. S. (2014) · PPAR Research · doi:10.1155/2014/895734 · Cited by 6
Absence of complement factor H reduces physical performance in C57BL6 mice
Seldeen, K. L., Thiyagarajan, R., Redae, Y. Z., Jacob, A., Troen, B. R., Quigg, R. J., & Alexander, J. J. (2020) · Immunobiology · doi:10.1016/j.imbio.2020.152003 · Cited by 5
Ji, F., Lee, H., & Kim, J. H. (2024) · bioRxiv (Cold Spring Harbor Laboratory) · doi:10.1101/2024.08.04.605473 · Cited by 5
Shute, R. J., Montalvo, R. N., Shen, W., Guan, Y., Yu, Q. T., Zhang, M., & Yan, Z. (2025) · Journal of sport and health science/Journal of Sport and Health Science · doi:10.1016/j.jshs.2025.101100 · Cited by 4
Emerald, B. S., Jailani, M. A. A., Ibrahim, M. F., Kumar, C. A., & Allouh, M. Z. (2022) · International Journal of Molecular Sciences · doi:10.3390/ijms23179547 · Cited by 5
Heck, T. G., Ludwig, M. S., dos Santos, A. B., & Goettems-Fiorin, P. B. (2015) · InTech eBooks · doi:10.5772/60895 · Cited by 3
Constantinescu, S., & Turcotte, L. P. (2015) · Canadian Journal of Physiology and Pharmacology · doi:10.1139/cjpp-2015-0020 · Cited by 4
Delgado, M., Hart, D. A., Reimer, R. A., & Herzog, W. (2023) · Scientific Reports · doi:10.1038/s41598-023-38487-x · Cited by 6
Shen, K. C., Collins, K. H., Ferey, J. L. A., Fappi, A., McCormick, J. J., Mittendorfer, B., Guilak, F., & Meyer, G. A. (2024) · Diabetes · doi:10.2337/db23-0991 · Cited by 4
Xia, Y., Niu, Q., Gao, X., Shen, S., He, N., Wang, H., Fang, R., Gao, Y., & Chang, H. (2021) · PubMed Central · doi:10.6620/zs.2021.60-06 · Cited by 4
Diet induced obesity alters muscle spindle afferent function in adult mice
Elahi, L. S., Shamai, K., Abtahie, A. M., Cai, A. M., Padmanabhan, S., Bremer, M., & Wilkinson, K. A. (2018) · PLoS ONE · doi:10.1371/journal.pone.0196832 · Cited by 4
Influence of obesity on skeletal muscle contractile dysfunction in aging
Eshima, H. (2020) · The Journal of Physical Fitness and Sports Medicine · doi:10.7600/jpfsm.9.199 · Cited by 3
Metadata
- Authors
- Shortreed, K. E., Krause, M. P., Huang, J. H., Dhanani, D., Moradi, J., Ceddia, R. B., & Hawke, T. J.
- Affiliations
- York University (CA)
- Corresponding author
- Hawke, Thomas J.
- ORCID
- Venue
- PLoS ONE
- Publisher
- Public Library of Science (PLoS)
- Published
- 2009-10-06
- Volume
- 4
- Issue
- 10
- Pages
- e7293
- ISSN
- 1932-6203 (ISSN-L)
- PMC
- PMC2752162
- OpenAlex
- W2116618150
- Cited by
- 131
- References
- 29
- Citations by year
- 2026: 1 · 2025: 5 · 2024: 5 · 2023: 6 · 2022: 7 · 2021: 4 · 2020: 15 · 2019: 7 · 2018: 8 · 2017: 11 · 2016: 6 · 2015: 12 · 2014: 13 · 2013: 11 · 2012: 4
- FWCI
- 2.66
- Type
- journal article
- Language
- en
- Open access
- gold
- doi.org
- Locations
- PLoS ONE (publishedVersion, cc-by)
- PubMed Central (publishedVersion, cc-by)
- PubMed (publishedVersion)
- DOAJ (DOAJ: Directory of Open Access Journals) (submittedVersion, cc-by-sa)
- Funders
- Ontario Innovation Trust
- Topics
- Life Sciences › Biochemistry, Genetics and Molecular Biology › Molecular Biology › Muscle Physiology and Disorders
- Health Sciences › Medicine › Physiology (medical) › Adipose Tissue and Metabolism
- Health Sciences › Medicine › Physiology (medical) › Cardiovascular and exercise physiology
- Keywords
- diet-induced obesity, high-fat diet, skeletal muscle, oxidative metabolism, muscle fiber type, intramyocellular lipid, palmitate oxidation, glucose oxidation, succinate dehydrogenase, citrate synthase, muscle contractility, insulin resistance, prediabetes, gastrocnemius, soleus muscle, tibialis anterior, extensor digitorum longus
- MeSH terms
- Animals, Animal Feed, Blood Glucose, Dietary Fats, Glucose, Lipids, Male, Mice, Inbred C57BL, Muscle Contraction, Obesity, Oxygen, Time Factors, Muscle, Skeletal, Mice, Animal Nutrition Sciences
About these checks
Registry, retraction, Cites and statistics results are computed, not judged, with one exception: a printed reference that no index lists is read once by a model before it counts as a citation error. Claims are extracted by a model and kept only when their quote appears verbatim in the text; each cited source is then checked, with a model’s help, for whether it says what the claim relies on. Those verdicts can be wrong — read the claim’s quote and the cited source before relying on one.
Statistics and arithmetic are recomputed, not judged.
Confidence bands are shown only for fields calibrated on our annotated test set. None is calibrated yet, so no band is shown.
What counts as a claim ›How we measure confidence ›How we check this ›
Are you an author, or do you see a problem with this page? Request a review
