

The DOI matches its Crossref record; 87 of the 88 references it cites were found in a registry or an index.
Molecular Signatures of Quiescent, Mobilized and Leukemia-Initiating Hematopoietic Stem Cells
Open accessAbstract
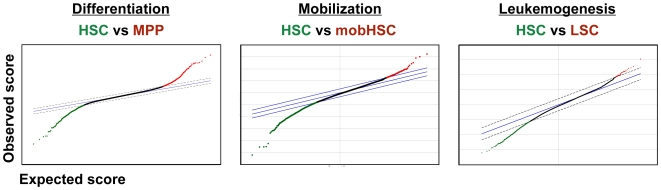
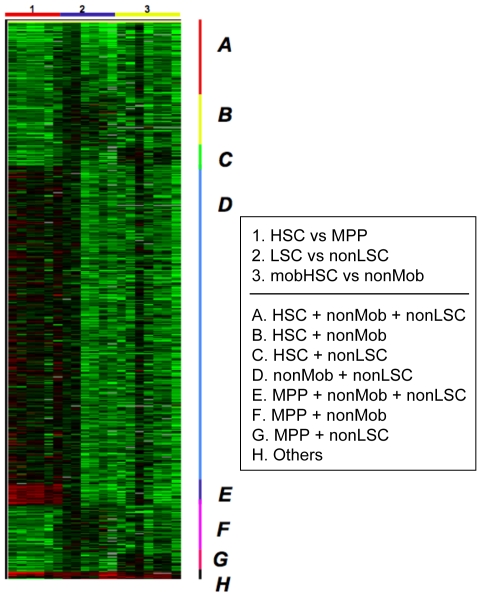
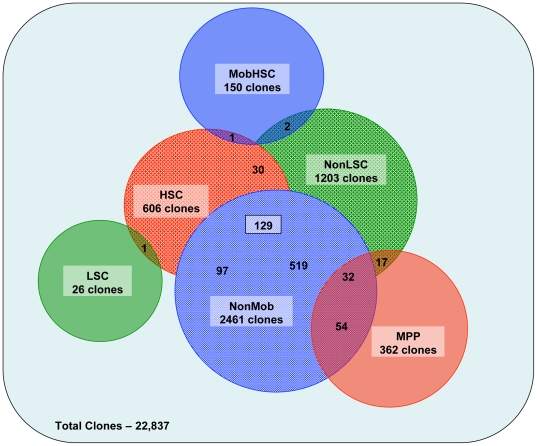
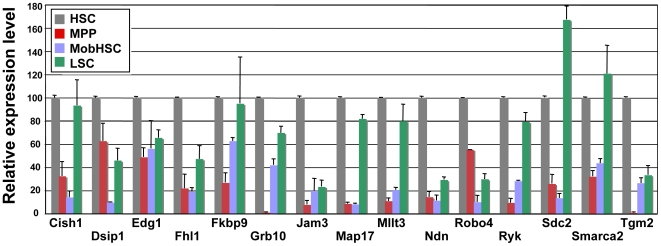
Hematopoietic stem cells (HSC) are rare, multipotent cells capable of generating all specialized cells of the blood system. Appropriate regulation of HSC quiescence is thought to be crucial to maintain their lifelong function; however, the molecular pathways controlling stem cell quiescence remain poorly characterized. Likewise, the molecular events driving leukemogenesis remain elusive. In this study, we compare the gene expression profiles of steady-state bone marrow HSC to non-self-renewing multipotent progenitors; to HSC treated with mobilizing drugs that expand the HSC pool and induce egress from the marrow; and to leukemic HSC in a mouse model of chronic myelogenous leukemia. By intersecting the resulting lists of differentially regulated genes we identify a subset of molecules that are downregulated in all three circumstances, and thus may be particularly important for the maintenance and function of normal, quiescent HSC. These results identify potential key regulators of HSC and give insights into the clinically important processes of HSC mobilization for transplantation and leukemic development from cancer stem cells.
Overview
The claims and statistics of this paper haven’t been checked yet.
Run the check — free, no account needed. It reads the open-access text and checks the sources it cites.
Integrity signals
Registry
Cites
Statistics
Figures
Verification
Claims the paper makes
The claims and statistics of this paper haven’t been checked yet.
Run the check — free, no account needed. It reads the open-access text and checks the sources it cites.
Claims other papers make about this one
Each is checked against this paper’s own text: does it say what the citing paper says it does?
In the citing paper
“a comparison of gene expression profiles of different types of quiescent stem cells, including HSCs45, MuSCs15 and HFSCs43, reveals a gene signature that is common to these quiescent stem cells (TABLE 1).”
From Molecular regulation of stem cell quiescence (2013) · cites this paper as [45]
In the citing paper
“Examples of genes that are downregulated in all three quiescent cell types (HSCs, MuSCs and HFSCs) include genes encoding cyclin A2, cyclin B1, cyclin E2 and survivin”
From Molecular regulation of stem cell quiescence (2013) · cites this paper as [45]
In the citing paper
“the signature reveals the downregulation of genes that are involved in DNA replication and cell cycle progression.”
From Molecular regulation of stem cell quiescence (2013) · cites this paper as [45]
Self-check
Percentages, sums and reported differences re-computed from the paper’s own numbers.
The self-check needs the paper’s full text.
Citations
Cites
Basic local alignment search tool
Altschul, S. F., Gish, W., Miller, W., Myers, E. W., & Lipman, D. J. (1990) · Journal of Molecular Biology · doi:10.1006/jmbi.1990.9999 · Cited by 98,669
Gene Ontology: tool for the unification of biology
Ashburner, M., Ball, C. A., Blake, J. A., Botstein, D., Butler, H., Cherry, J. M., Davis, A. P., Dolinski, K., Dwight, S. S., Eppig, J. T., et al. (2000) · Nature Genetics · doi:10.1038/75556 · Cited by 43,206
In silico prediction of protein-protein interactions in human macrophages
Souiai, O., Guerfali, F. Z., Miled, S. B., Brun, C., & Benkahla, A. (2014) · BMC Research Notes · doi:10.1186/1756-0500-7-157 · Cited by 10,785
Significance analysis of microarrays applied to the ionizing radiation response
Tusher, V. G., Tibshirani, R., & Chu, G. (2001) · Proceedings of the National Academy of Sciences · doi:10.1073/pnas.091062498 · Cited by 10,568
Kiel, M. J., Yilmaz, Ö. H., Iwashita, T., Yilmaz, O. H., Terhorst, C., & Morrison, S. J. (2005) · Cell · doi:10.1016/j.cell.2005.05.026 · Cited by 3,168
Wnt proteins are lipid-modified and can act as stem cell growth factors
Willert, K., Brown, J. D., Danenberg, E., Duncan, A. W., Weissman, I. L., Reya, T., Yates, J. R., & Nusse, R. (2003) · Nature · doi:10.1038/nature01611 · Cited by 2,257
Self-citationA role for Wnt signalling in self-renewal of haematopoietic stem cells
Reya, T., Duncan, A. W., Ailles, L., Domen, J., Scherer, D. C., Willert, K., Hintz, L., Nusse, R., & Weissman, I. L. (2003) · Nature · doi:10.1038/nature01593 · Cited by 2,159
Self-citationTie2/Angiopoietin-1 Signaling Regulates Hematopoietic Stem Cell Quiescence in the Bone Marrow Niche
Arai, F., Hirao, A., Ohmura, M., Sato, H., Matsuoka, S., Takubo, K., Ito, K., Koh, G. Y., & Suda, T. (2004) · Cell · doi:10.1016/j.cell.2004.07.004 · Cited by 1,958
Weissman, I. L. (2000) · Cell · doi:10.1016/s0092-8674(00)81692-x · Cited by 1,827
Self-citation"Stemness": Transcriptional Profiling of Embryonic and Adult Stem Cells
Ramalho‐Santos, M., Yoon, S., Matsuzaki, Y., Mulligan, R. C., & Melton, D. A. (2002) · Science · doi:10.1126/science.1072530 · Cited by 1,711
Cited by
Sorted by citations
Molecular regulation of stem cell quiescence
Cheung, T. H., & Rando, T. A. (2013) · Nature Reviews Molecular Cell Biology · doi:10.1038/nrm3591 · Cited by 1,148
Codega, P., Silva-Vargas, V., Paul, A., Maldonado-Soto, A. R., DeLeo, A. M., Pastrana, E., & Doetsch, F. (2014) · Neuron · doi:10.1016/j.neuron.2014.02.039 · Cited by 634
Hematopoietic Stem Cells Are the Major Source of Multilineage Hematopoiesis in Adult Animals
Sawai, C. M., Babovic, S., Upadhaya, S., Knapp, D. J. H. F., Lavin, Y., Lau, C. M., Goloborodko, A., Feng, J., Fujisaki, J., Ding, L., et al. (2016) · Immunity · doi:10.1016/j.immuni.2016.08.007 · Cited by 381
“Pdzk1ip1 (also known as Map17) is expressed in the murine HSC population but is strongly reduced in more differentiated cells or in mobilized HSCs (Cabezas-Wallscheid et al., 2014; Forsberg et al., 2010; Wilson et al., 2015).”
Moore, N., & Lyle, S. R. (2010) · Journal of Oncology · doi:10.1155/2011/396076 · Cited by 378
Hoxb5 marks long-term haematopoietic stem cells and reveals a homogenous perivascular niche
Chen, J. Y., Miyanishi, M., Wang, S. K., Yamazaki, S., Sinha, R., Kao, K. S., Seita, J., Sahoo, D., Nakauchi, H., & Weissman, I. L. (2016) · Nature · doi:10.1038/nature16943 · Cited by 345
Self-citation
Metadata
- Authors
- Forsberg, E. C., Passegué, E., Prohaska, S. S., Wagers, A. J., Koeva, M., Stuart, J. M., & Weissman, I. L.
- Affiliations
- University of California, Santa Cruz (US)
- Stanford Medicine (US)
- Joslin Diabetes Center (US)
- Corresponding author
- Forsberg, E. Camilla
- Venue
- PLoS ONE
- Publisher
- Public Library of Science (PLoS)
- Published
- 2010-01-20
- Volume
- 5
- Issue
- 1
- Pages
- e8785
- ISSN
- 1932-6203 (ISSN-L)
- PMC
- PMC2808351
- OpenAlex
- W2098528717
- Cited by
- 127
- References
- 88
- Citations by year
- 2026: 4 · 2025: 2 · 2024: 5 · 2023: 1 · 2022: 9 · 2021: 6 · 2020: 5 · 2019: 5 · 2018: 2 · 2017: 11 · 2016: 12 · 2015: 16 · 2014: 7 · 2013: 13 · 2012: 10
- FWCI
- 8.21
- Type
- journal article
- Language
- en
- Open access
- gold
- doi.org
- Locations
- PLoS ONE (publishedVersion, cc-by)
- Europe PMC (PubMed Central) (publishedVersion, cc-by)
- PubMed Central (publishedVersion, cc-by)
- PubMed (publishedVersion)
- Digital Access to Scholarship at Harvard (DASH) (Harvard University) (submittedVersion, cc-by)
- DOAJ (DOAJ: Directory of Open Access Journals) (submittedVersion)
- eScholarship (California Digital Library) (submittedVersion)
- eScholarship (California Digital Library) (submittedVersion, cc-by)
- Figshare (submittedVersion, cc-by)
- Funders
- National Science Foundation (0543197)
- Burroughs Wellcome Fund
- Alfred P. Sloan Foundation
- California Institute for Regenerative Medicine
- National Institutes of Health (5r01hl088582-05)
- National Heart, Lung, and Blood Institute (R01HL058770, 1R01HL088582-01, R01HL092471, R01-HL088582)
- National Cancer Institute (R01CA086065, R01CA086017)
- National Institute of Diabetes and Digestive and Kidney Diseases (P01DK053074)
- Division of Biological Infrastructure
- Topics
- Health Sciences › Medicine › Hematology › Hematopoietic Stem Cell Transplantation
- Life Sciences › Biochemistry, Genetics and Molecular Biology › Cell Biology › Mesenchymal stem cell research
- Health Sciences › Medicine › Hematology › Acute Myeloid Leukemia Research
- Keywords
- hematopoietic stem cells, HSC quiescence, hematopoietic stem cell mobilization, leukemia-initiating cells, chronic myeloid leukemia, gene expression profiling, bone marrow, cancer stem cells, stem cell self-renewal, HSC transplantation
- MeSH terms
- Animals, Cell Transformation, Neoplastic, Disease Models, Animal, Flow Cytometry, Gene Expression Regulation, Hematopoietic Stem Cells, Mice, Inbred C57BL, Nucleic Acid Hybridization, Transcription, Genetic, Leukemia, Myelogenous, Chronic, BCR-ABL Positive, Reverse Transcriptase Polymerase Chain Reaction, Gene Expression Profiling, Mice
About these checks
Registry, retraction, Cites and statistics results are computed, not judged, with one exception: a printed reference that no index lists is read once by a model before it counts as a citation error. Claims are extracted by a model and kept only when their quote appears verbatim in the text; each cited source is then checked, with a model’s help, for whether it says what the claim relies on. Those verdicts can be wrong — read the claim’s quote and the cited source before relying on one.
Statistics and arithmetic are recomputed, not judged.
Confidence bands are shown only for fields calibrated on our annotated test set. None is calibrated yet, so no band is shown.
What counts as a claim ›How we measure confidence ›How we check this ›
Are you an author, or do you see a problem with this page? Request a review
