

The DOI matches its Crossref record; 139 of the 139 references it cites were found in a registry or an index.
Comparative Genomics of Flowering Time Pathways Using Brachypodium distachyon as a Model for the Temperate Grasses
Open accessAbstract
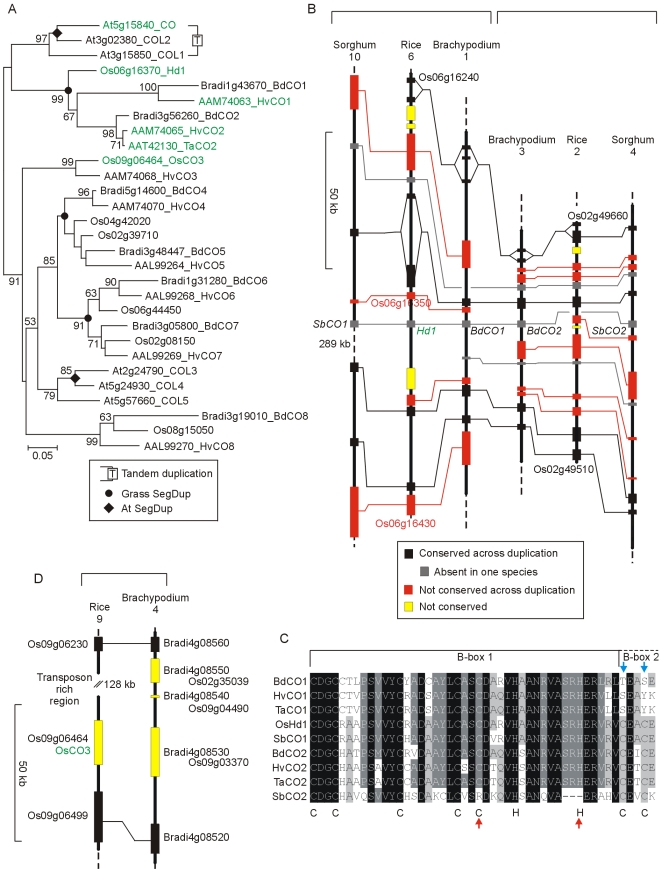
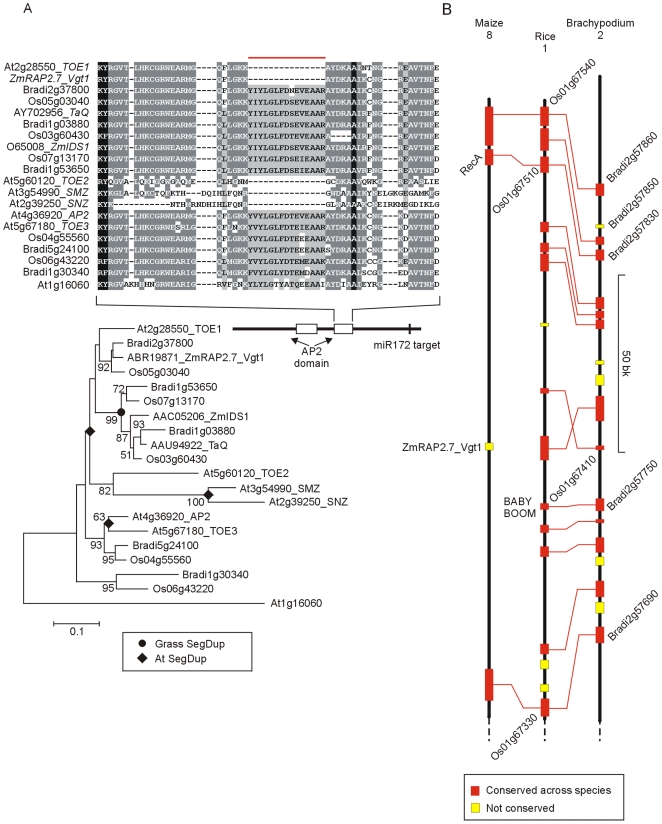
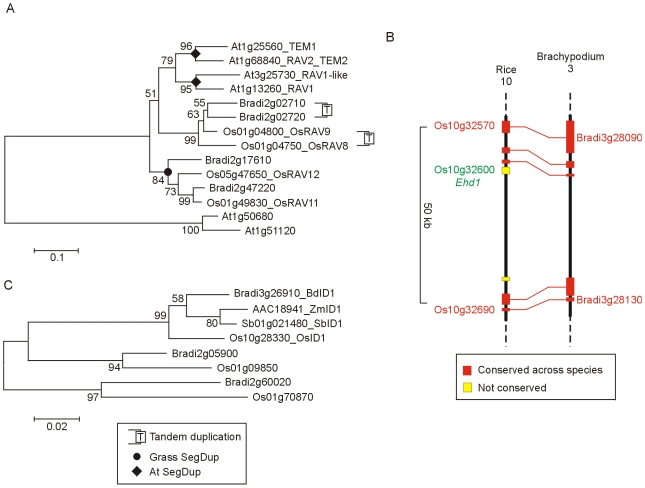
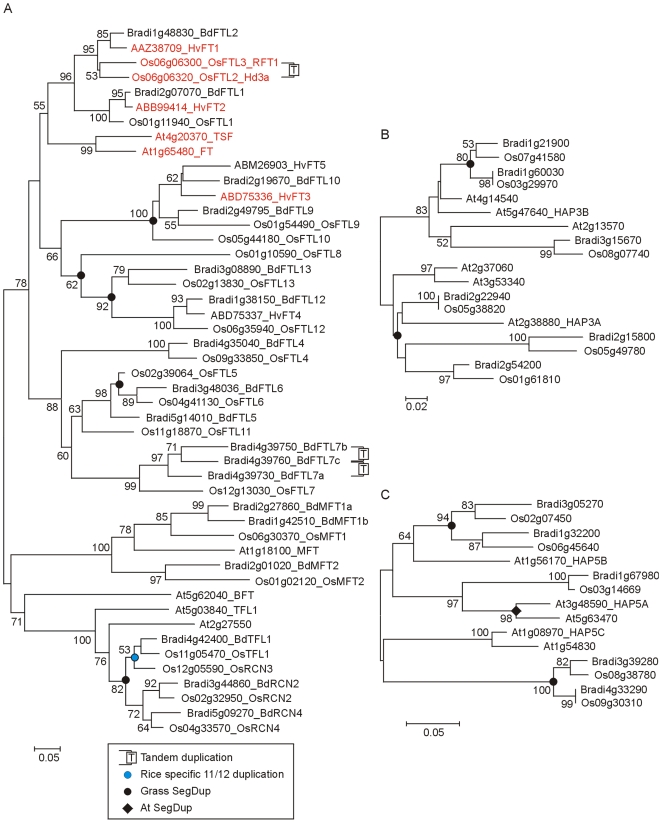
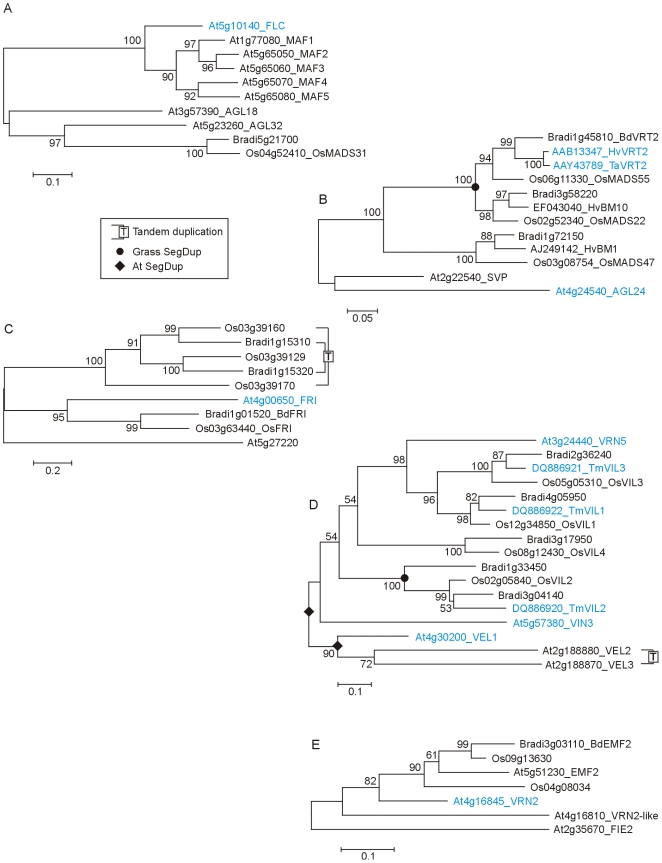
Brachypodium distachyon (Brachypodium) is a model for the temperate grasses which include important cereals such as barley, wheat and oats. Comparison of the Brachypodium genome (accession Bd21) with those of the model dicot Arabidopsis thaliana and the tropical cereal rice (Oryza sativa) provides an opportunity to compare and contrast genetic pathways controlling important traits. We analysed the homologies of genes controlling the induction of flowering using pathways curated in Arabidopsis Reactome as a starting point. Pathways include those detecting and responding to the environmental cues of day length (photoperiod) and extended periods of low temperature (vernalization). Variation in these responses has been selected during cereal domestication, providing an interesting comparison with the wild genome of Brachypodium. Brachypodium Bd21 has well conserved homologues of circadian clock, photoperiod pathway and autonomous pathway genes defined in Arabidopsis and homologues of vernalization pathway genes defined in cereals with the exception of VRN2 which was absent. Bd21 also lacked a member of the CO family (CO3). In both cases flanking genes were conserved showing that these genes are deleted in at least this accession. Segmental duplication explains the presence of two CO-like genes in temperate cereals, of which one (Hd1) is retained in rice, and explains many differences in gene family structure between grasses and Arabidopsis. The conserved fine structure of duplications shows that they largely evolved to their present structure before the divergence of the rice and Brachypodium. Of four flowering-time genes found in rice but absent in Arabidopsis, two were found in Bd21 (Id1, OsMADS51) and two were absent (Ghd7, Ehd1). Overall, results suggest that an ancient core photoperiod pathway promoting flowering via the induction of FT has been modified by the recruitment of additional lineage specific pathways that promote or repress FT expression.
Overview
The claims and statistics of this paper haven’t been checked yet.
Run the check — free, no account needed. It reads the open-access text and checks the sources it cites.
Integrity signals
Registry
Cites
Statistics
Figures
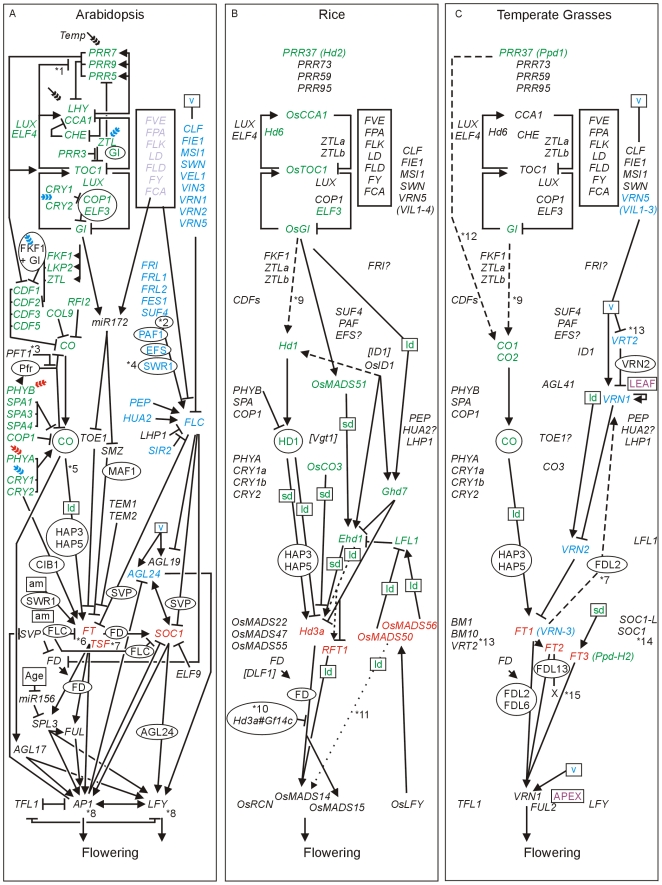
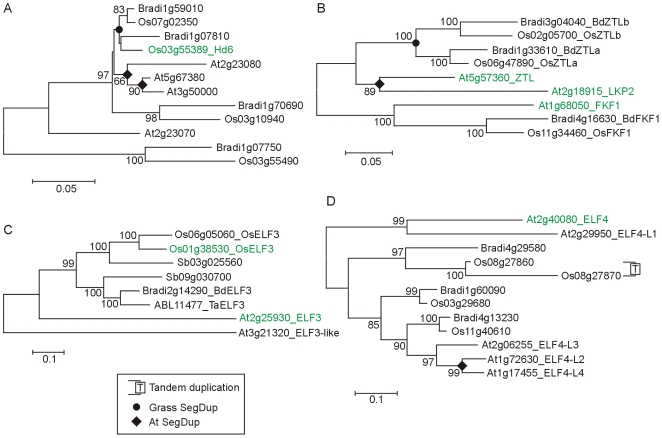
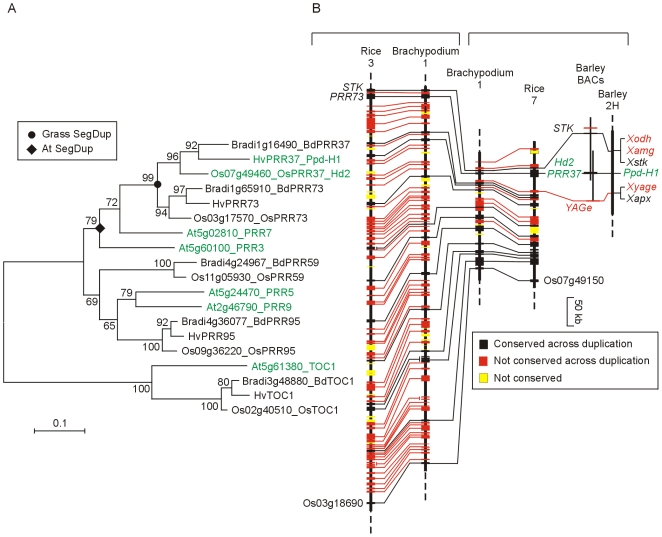
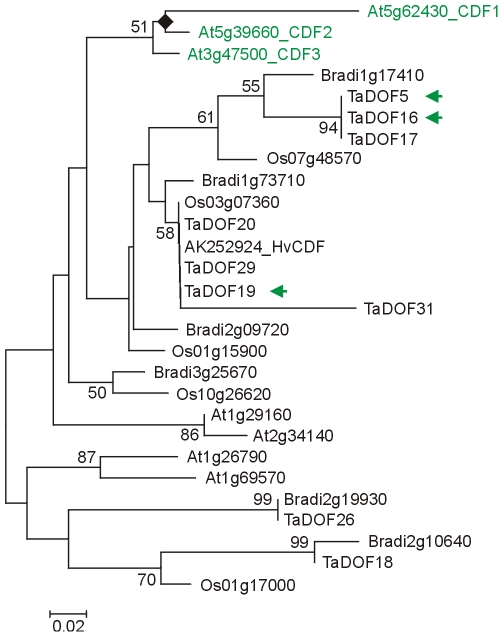
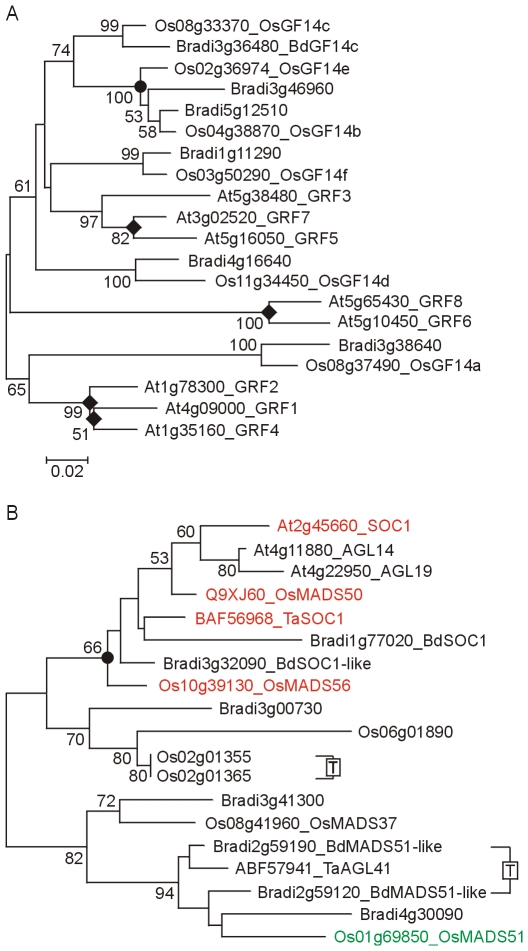
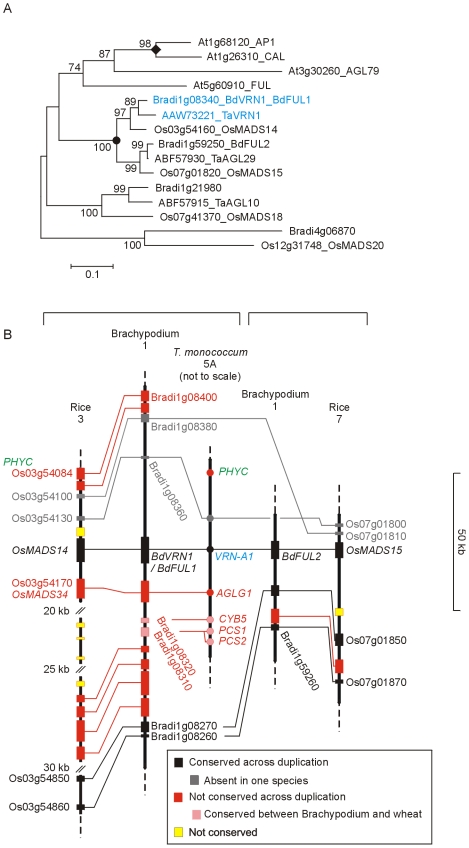
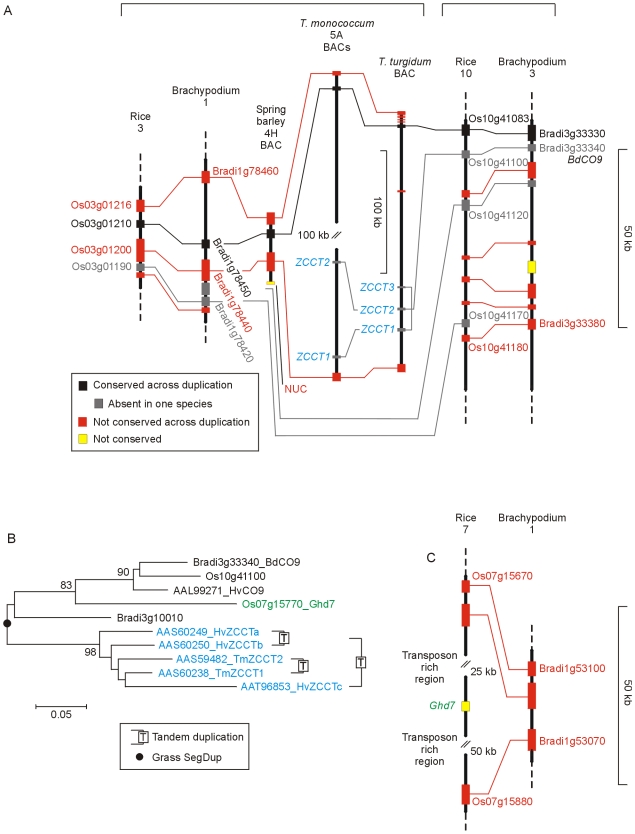
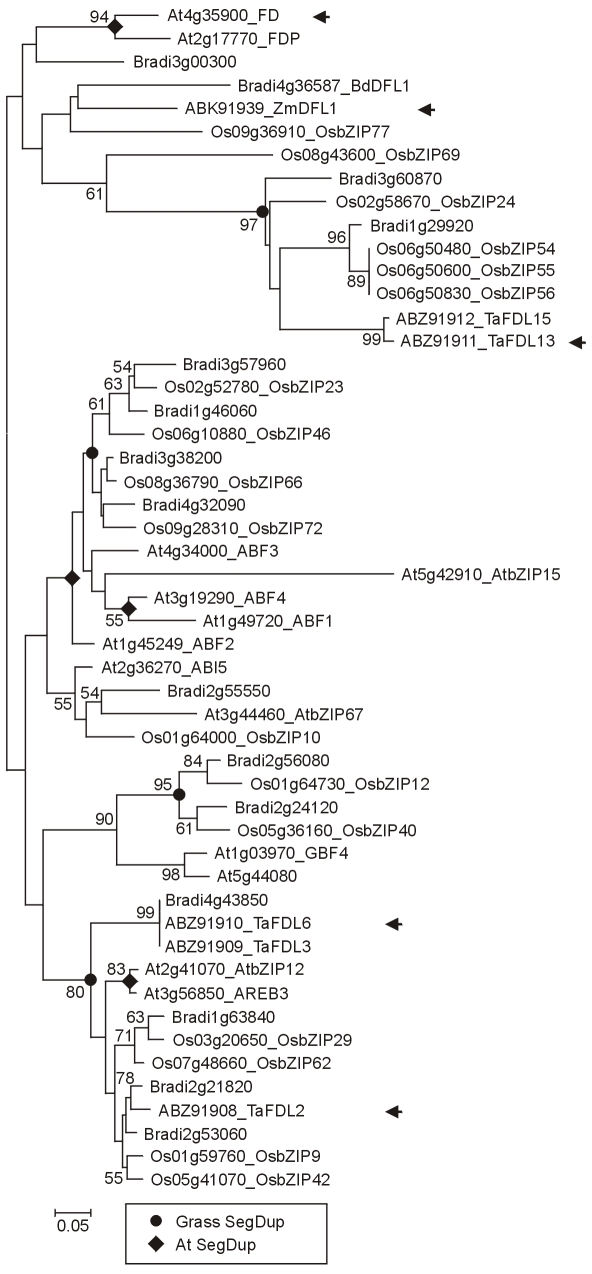
Verification
Claims the paper makes
The claims and statistics of this paper haven’t been checked yet.
Run the check — free, no account needed. It reads the open-access text and checks the sources it cites.
Claims other papers make about this one
Each is checked against this paper’s own text: does it say what the citing paper says it does?
In the citing paper
“though at least some flowering time genes that contribute to perenniality seem to be conserved between monocots and dicots (Wang et al., 2009;Higgins et al., 2010), in a way that root architecture is not (see above).”
From Breeding crop plants with deep roots: their role in sustainable carbon, nutrient and water sequestration (2011) · cites this paper as Higgins et al., 2010
Self-check
Percentages, sums and reported differences re-computed from the paper’s own numbers.
The self-check needs the paper’s full text.
Citations
Cites
PHYLIP-Phylogeny inference package (Version 3.2)
Felsenstein, J. (1989) · Cladistics · Cited by 17,682
Eddy, S. R. (1998) · Bioinformatics · doi:10.1093/bioinformatics/14.9.755 · Cited by 5,515
MEGA: A biologist-centric software for evolutionary analysis of DNA and protein sequences
Kumar, S., Nei, M., Dudley, J. T., & Tamura, K. (2008) · Briefings in Bioinformatics · doi:10.1093/bib/bbn017 · Cited by 3,511
Genome sequencing and analysis of the model grass Brachypodium distachyon
Initiative, T. I. B. (2010) · Nature · doi:10.1038/nature08747 · Cited by 1,862
FD, a bZIP Protein Mediating Signals from the Floral Pathway Integrator FT at the Shoot Apex
Abe, M., Kobayashi, Y., Yamamoto, S., Daimon, Y., Yamaguchi, A., Ikeda, Y., Ichinoki, H., Notaguchi, M., Goto, K., & Araki, T. (2005) · Science · doi:10.1126/science.1115983 · Cited by 1,661
Synteny and Collinearity in Plant Genomes
Tang, H., Bowers, J., Wang, X., Ming, R., Alam, M. S., & Paterson, A. H. (2008) · Science · doi:10.1126/science.1153917 · Cited by 1,620
Natural variation in Ghd7 is an important regulator of heading date and yield potential in rice
Xue, W., Xing, Y., Weng, X., Zhao, Y. J., Tang, W., Wang, L., Zhou, H., Yu, S., Xu, C., Li, X., et al. (2008) · Nature Genetics · doi:10.1038/ng.143 · Cited by 1,615
Yano, M., Katayose, Y., Ashikari, M., Yamanouchi, U., Monna, L., Fuse, T., Baba, T., Yamamoto, K., Umehara, Y., Nagamura, Y., et al. (2000) · The Plant Cell · doi:10.1105/tpc.12.12.2473 · Cited by 1,609
Integration of Spatial and Temporal Information During Floral Induction in Arabidopsis
Wigge, P. A., Kim, M. C., Jaeger, K. E., Busch, W., Schmid, M., Lohmann, J. U., & Weigel, D. (2005) · Science · doi:10.1126/science.1114358 · Cited by 1,492
Positional cloning of the wheat vernalization gene VRN1
Yan, L., Loukoianov, A., Tranquilli, G. E., Helguera, M., Fahima, T., & Dubcovsky, J. (2003) · Proceedings of the National Academy of Sciences · doi:10.1073/pnas.0937399100 · Cited by 1,438
Cited by
Sorted by citations
MCScanX: a toolkit for detection and evolutionary analysis of gene synteny and collinearity
Wang, Y., Tang, H., DeBarry, J. D., Tan, X., Li, J., Wang, X., Lee, T.-H., Jin, H., Marler, B., Guo, H., et al. (2012) · Nucleic Acids Research · doi:10.1093/nar/gkr1293 · Cited by 7,093
Reference genome sequence of the model plant Setaria
Bennetzen, J. L., Schmutz, J., Wang, H., Percifield, R. J., Hawkins, J., Pontaroli, A. C., Estep, M. C., Feng, L., Vaughn, J. N., Grimwood, J., et al. (2012) · Nature Biotechnology · doi:10.1038/nbt.2196 · Cited by 923
PGDD: a database of gene and genome duplication in plants
Lee, T., Tang, H., Wang, X., & Paterson, A. H. (2012) · Nucleic Acids Research · doi:10.1093/nar/gks1104 · Cited by 582
Jia, G., Huang, X., Zhi, H., Zhao, Y., Zhao, Q., Li, W., Yang, C., Yang, L., Liu, K., Lu, H., et al. (2013) · Nature Genetics · doi:10.1038/ng.2673 · Cited by 460
Díaz, A., Zikhali, M., Turner, A. S., Isaac, P. G., & Laurie, D. A. (2012) · PLoS ONE · doi:10.1371/journal.pone.0033234 · Cited by 459
Self-citationKell, D. B. (2011) · Annals of Botany · doi:10.1093/aob/mcr175 · Cited by 439
Setaria viridis and Setaria italica, model genetic systems for the Panicoid grasses
Li, P., & Brutnell, T. P. (2011) · Journal of Experimental Botany · doi:10.1093/jxb/err096 · Cited by 394
Microbiome and Exudates of the Root and Rhizosphere of Brachypodium distachyon, a Model for Wheat
Kawasaki, A., Donn, S., Ryan, P. R., Mathesius, U., Devilla, R., Jones, A. L., & Watt, M. (2016) · PLoS ONE · doi:10.1371/journal.pone.0164533 · Cited by 274
Faure, S., Turner, A. S., Gruszka, D., Christodoulou, V., Davis, S. J., von Korff, M., & Laurie, D. A. (2012) · Proceedings of the National Academy of Sciences · doi:10.1073/pnas.1120496109 · Cited by 271
Self-citationBrachypodium as a Model for the Grasses: Today and the Future
Brkljacić, J., Erich Grotewold, A., Scholl, R., Mockler, T. C., Garvin, D. F., Vain, P., Brutnell, T. P., Sibout, R., Bevan, M. W., Budak, H., et al. (2011) · PLANT PHYSIOLOGY · doi:10.1104/pp.111.179531 · Cited by 261
Molecular control of seasonal flowering in rice, arabidopsis and temperate cereals
Shrestha, R., Gómez‐Ariza, J., Brambilla, V., & Fornara, F. (2014) · Annals of Botany · doi:10.1093/aob/mcu032 · Cited by 242
Major genes determining yield-related traits in wheat and barley
Nadolska‐Orczyk, A., Rajchel, I. K., Orczyk, W., & Gasparis, S. (2017) · Theoretical and Applied Genetics · doi:10.1007/s00122-017-2880-x · Cited by 226
Shaw, L. M., Turner, A. S., & Laurie, D. A. (2012) · The Plant Journal · doi:10.1111/j.1365-313x.2012.04971.x · Cited by 194
Self-citationTyler, L., Lee, S. J., Young, N. D., DeIulio, G. A., Benavente, E., Reagon, M., Sysopha, J., Baldini, R. M., Troìa, A., Hazen, S. P., et al. (2016) · The Plant Genome · doi:10.3835/plantgenome2015.08.0074 · Cited by 198
Molecular mechanisms involved in convergent crop domestication
Lenser, T., & Theißen, G. (2013) · Trends in Plant Science · doi:10.1016/j.tplants.2013.08.007 · Cited by 195
Physiology and genetics of flowering in cultivated and wild strawberries – a review
Heide, O. M., Stavang, J. A., & Sønsteby, A. (2013) · The Journal of Horticultural Science and Biotechnology · doi:10.1080/14620316.2013.11512930 · Cited by 171
Campoli, C., Drosse, B., Searle, I. R., Coupland, G., & von Korff, M. (2011) · The Plant Journal · doi:10.1111/j.1365-313x.2011.04839.x · Cited by 159
Remembering winter through vernalisation
Xu, S., & Chong, K. (2018) · Nature Plants · doi:10.1038/s41477-018-0301-z · Cited by 162
Dong, Z., Danilevskaya, O., Abadie, T., Messina, C., Coles, N., & Cooper, M. (2012) · PLoS ONE · doi:10.1371/journal.pone.0043450 · Cited by 133
Winter Memory throughout the Plant Kingdom: Different Paths to Flowering
Bouché, F., Woods, D. P., & Amasino, R. M. (2016) · PLANT PHYSIOLOGY · doi:10.1104/pp.16.01322 · Cited by 147
Flowering time: From physiology, through genetics to mechanism
Maple, R., Zhu, P., Hepworth, J., Wang, J., & Dean, C. (2024) · PLANT PHYSIOLOGY · doi:10.1093/plphys/kiae109 · Cited by 151
Brachypodium: A Monocot Grass Model Genus for Plant Biology
Scholthof, K. G., Irigoyen, S. C., Catalán, P., & Mandadi, K. K. (2018) · The Plant Cell · doi:10.1105/tpc.18.00083 · Cited by 137
Murphy, R. L., Morishige, D. T., Brady, J. A., Rooney, W. L., Yang, S. S., Klein, P. G., & Mullet, J. E. (2014) · The Plant Genome · doi:10.3835/plantgenome2013.11.0040 · Cited by 135
Zhang, X., Zhao, L., Larson‐Rabin, Z., Li, D.-Z., & Guo, Z. (2012) · PLoS ONE · doi:10.1371/journal.pone.0042082 · Cited by 129
Campoli, C., Shtaya, M. J. Y., Davis, S. J., & von Korff, M. (2012) · BMC Plant Biology · doi:10.1186/1471-2229-12-97 · Cited by 129
Campoli, C., Pankin, A., Drosse, B., Casao, C. M., Davis, S. J., & von Korff, M. (2013) · New Phytologist · doi:10.1111/nph.12346 · Cited by 128
Bragg, J. N., Wu, J., Gordon, S., Guttman, M. E., Thilmony, R. L., Lazo, G. R., Gu, Y., & Vogel, J. P. (2012) · PLoS ONE · doi:10.1371/journal.pone.0041916 · Cited by 124
Interaction of Photoperiod and Vernalization Determines Flowering Time of Brachypodium distachyon
Ream, T. S., Woods, D. P., Schwartz, C. J., Sanabria, C. P., Mahoy, J. A., Walters, E. M., Kaeppler, H. F., & Amasino, R. M. (2013) · PLANT PHYSIOLOGY · doi:10.1104/pp.113.232678 · Cited by 118
Mao, D., & Chen, C. (2012) · PLoS ONE · doi:10.1371/journal.pone.0047275 · Cited by 119
Shaw, L. M., Turner, A. S., Herry, L., Griffiths, S., & Laurie, D. A. (2013) · PLoS ONE · doi:10.1371/journal.pone.0079459 · Cited by 120
Self-citationYang, Y., Peng, Q., Chen, G.-X., Li, X., & Wu, C. (2012) · Molecular Plant · doi:10.1093/mp/sss062 · Cited by 120
Brachypodium distachyon and Setaria viridis: Model Genetic Systems for the Grasses
Brutnell, T. P., Bennetzen, J. L., & Vogel, J. P. (2015) · Annual Review of Plant Biology · doi:10.1146/annurev-arplant-042811-105528 · Cited by 119
Li, W., Han, Y., Tao, F., & Chong, K. (2011) · Journal of Plant Physiology · doi:10.1016/j.jplph.2011.05.020 · Cited by 122
Research progress on the autonomous flowering time pathway in Arabidopsis
Cheng, J.-Z., Zhou, Y., Lv, T., Xie, C., & Tian, C.-E. (2017) · Physiology and Molecular Biology of Plants · doi:10.1007/s12298-017-0458-3 · Cited by 119
Alqudah, A. M., Sharma, R. K., Pasam, R., Graner, A., Kilian, B., & Schnurbusch, T. (2014) · PLoS ONE · doi:10.1371/journal.pone.0113120 · Cited by 118
Genome Dynamics Explain the Evolution of Flowering Time CCT Domain Gene Families in the Poaceae
Cockram, J., Thiel, T., Steuernagel, B., Stein, N., Taudien, S., Bailey, P. C. E., & O’Sullivan, D. M. (2012) · PLoS ONE · doi:10.1371/journal.pone.0045307 · Cited by 114
Self-citationGrain dormancy and light quality effects on germination in the model grass Brachypodium distachyon
Barrero, J. M., Jacobsen, J. V., Talbot, M. J., White, R. G., Swain, S. M., Garvin, D. F., & Gubler, F. (2011) · New Phytologist · doi:10.1111/j.1469-8137.2011.03938.x · Cited by 117
Targeted resequencing reveals genomic signatures of barley domestication
Pankin, A., Altmüller, J., Becker, C., & von Korff, M. (2018) · New Phytologist · doi:10.1111/nph.15077 · Cited by 115
The Molecular Basis of Vernalization in Different Plant GroupsPreprint
Ream, T. S., Woods, D. P., & Amasino, R. M. (2012) · Cold Spring Harbor Symposia on Quantitative Biology · doi:10.1101/sqb.2013.77.014449 · Cited by 112
A Functional and Evolutionary Perspective on Transcription Factor Binding in Arabidopsis thaliana
Heyndrickx, K. S., de Velde, J. V., Wang, C., Weigel, D., & Vandepoele, K. (2014) · The Plant Cell · doi:10.1105/tpc.114.130591 · Cited by 112
Kumar, A., Pathak, R. K., Gupta, S. M., Gaur, V. S., & Pandey, D. (2015) · OMICS A Journal of Integrative Biology · doi:10.1089/omi.2015.0106 · Cited by 117
Beyond the Genetic Pathways, Flowering Regulation Complexity in Arabidopsis thaliana
Quiroz, S., Yustis, J. C., Chávez-Hernández, E. C., Martínez, T., Sánchez, M. D. L. P., Garay‐Arroyo, A., Alvarez-Buylla, E. R., & García‐Ponce, B. (2021) · International Journal of Molecular Sciences · doi:10.3390/ijms22115716 · Cited by 111
Comparative Genomic Analysis of Soybean Flowering Genes
Jung, C., Wong, C. E., Singh, M. B., & Bhalla, P. L. (2012) · PLoS ONE · doi:10.1371/journal.pone.0038250 · Cited by 111
Applying the latest advances in genomics and phenomics for trait discovery in polyploid wheat
Borrill, P., Harrington, S. A., & Uauy, C. (2018) · The Plant Journal · doi:10.1111/tpj.14150 · Cited by 116
Natural Variation of the RICE FLOWERING LOCUS T 1 Contributes to Flowering Time Divergence in Rice
Ogiso‐Tanaka, E., Matsubara, K., Yamamoto, S., Nonoue, Y., Wu, J., Fujisawa, H., Ishikubo, H., Tanaka, T., Ando, T., Matsumoto, T., et al. (2013) · PLoS ONE · doi:10.1371/journal.pone.0075959 · Cited by 107
Genomics reveals new landscapes for crop improvement
Bevan, M. W., & Uauy, C. (2013) · Genome biology · doi:10.1186/gb-2013-14-6-206 · Cited by 102
Genetic architecture of main effect QTL for heading date in European winter wheat
Zanke, C. D., Ling, J., Plieske, J., Kollers, S., Ebmeyer, E., Korzun, V. N., Argillier, O., Stiewe, G., Hinze, M., Beier, S., et al. (2014) · Frontiers in Plant Science · doi:10.3389/fpls.2014.00217 · Cited by 101
FLOWERING LOCUS T2 regulates spike development and fertility in temperate cereals
Shaw, L. M., Lyu, B., Turner, R., Li, C., Chen, F., Han, X., Fu, D., & Dubcovsky, J. (2018) · Journal of Experimental Botany · doi:10.1093/jxb/ery350 · Cited by 96
Gouis, J. L., Bordes, J., Ravel, C., Heumez, E., Faure, S., Praud, S., Galic, N., Remoué, C., Balfourier, F., Allard, V., et al. (2011) · Theoretical and Applied Genetics · doi:10.1007/s00122-011-1732-3 · Cited by 99
Regulation of FLOWERING LOCUS T by a MicroRNA in Brachypodium distachyon
Wu, L., Liu, D., Wu, J., Zhang, R., Qin, Z., Liu, D., Li, A., Fu, D., Zhai, W. X., & Mao, L. (2013) · The Plant Cell · doi:10.1105/tpc.113.118620 · Cited by 99
Goretti, D., Martignago, D., Landini, M., Brambilla, V., Gómez‐Ariza, J., Gnesutta, N., Galbiati, F., Collani, S., Takagi, H., Terauchi, R., et al. (2017) · PLoS Genetics · doi:10.1371/journal.pgen.1006530 · Cited by 98
Zikhali, M., Wingen, L. U., & Griffiths, S. (2015) · Journal of Experimental Botany · doi:10.1093/jxb/erv458 · Cited by 96
Supermodels: sorghum and maize provide mutual insight into the genetics of flowering time
Mace, E., Hunt, C., & Jordan, D. R. (2013) · Theoretical and Applied Genetics · doi:10.1007/s00122-013-2059-z · Cited by 96
Evolution of VRN2/Ghd7-Like Genes in Vernalization-Mediated Repression of Grass Flowering
Woods, D. P., McKeown, M., Dong, Y., Preston, J. C., & Amasino, R. M. (2016) · PLANT PHYSIOLOGY · doi:10.1104/pp.15.01279 · Cited by 94
Han, S., Yoo, S., Lee, B., An, G., & Paek, N. (2015) · Plant Cell & Environment · doi:10.1111/pce.12549 · Cited by 92
Circadian rhythms and post-transcriptional regulation in higher plants
Romanowski, A., & Yanovsky, M. J. (2015) · Frontiers in Plant Science · doi:10.3389/fpls.2015.00437 · Cited by 89
Leroy, T., Rougemont, Q., Dupouey, J., Bodénès, C., Lalanne, C., Belser, C., Labadie, K., Provost, G. L., Aury, J., Kremer, A., et al. (2019) · New Phytologist · doi:10.1111/nph.16039 · Cited by 93
Phytochrome C Is A Key Factor Controlling Long-Day Flowering in Barley
Nishida, H., Ishihara, D., Ishii, M., Kaneko, T., Kawahigashi, H., Akashi, Y., Saisho, D., Tanaka, K., Handa, H., Takeda, K., et al. (2013) · PLANT PHYSIOLOGY · doi:10.1104/pp.113.222570 · Cited by 89
The Chickpea Early Flowering 1 ( Efl1 ) Locus Is an Ortholog of Arabidopsis ELF3
Ridge, S., Deokar, A., Lee, R., Daba, K. A., Macknight, R. C., Weller, J. L., & Tar’an, B. (2017) · PLANT PHYSIOLOGY · doi:10.1104/pp.17.00082 · Cited by 87
Sharma, N., Geuten, K. P., Giri, B. S., & Varma, A. K. (2020) · Physiologia Plantarum · doi:10.1111/ppl.13163 · Cited by 87
Genetic Control and Comparative Genomic Analysis of Flowering Time in Setaria (Poaceae)
Mauro‐Herrera, M., Wang, X., Barbier, H., Brutnell, T. P., Devos, K. M., & Doust, A. N. (2013) · G3 Genes Genomes Genetics · doi:10.1534/g3.112.005207 · Cited by 82
Earliness Per Se by Temperature Interaction on Wheat Development
Ochagavía, H., Prieto, P., Zikhali, M., Griffiths, S., & Slafer, G. A. (2019) · Scientific Reports · doi:10.1038/s41598-019-39201-6 · Cited by 82
Woods, D. P., Ream, T. S., Minevich, G., Hobert, O., & Amasino, R. M. (2014) · Genetics · doi:10.1534/genetics.114.166785 · Cited by 77
Shaw, L. M., Li, C., Woods, D. P., Alvarez, M. A., Lin, H., Lau, M. Y., Chen, A., & Dubcovsky, J. (2020) · PLoS Genetics · doi:10.1371/journal.pgen.1008812 · Cited by 76
Genome-Wide Landscape of Alternative Splicing Events in Brachypodium distachyon
Walters, B., Lum, G., Sablok, G., & Min, X. J. (2013) · DNA Research · doi:10.1093/dnares/dss041 · Cited by 75
The floral transcriptome of E ucalyptus grandis
Vining, K. J., Romanel, E. A. D. C., Jones, R. C., Klocko, A. L., Alves‐Ferreira, M., Hefer, C. A., Amarasinghe, V., Dharmawardhana, P. D., Naithani, S., Ranik, M., et al. (2014) · New Phytologist · doi:10.1111/nph.13077 · Cited by 74
Zhebentyayeva, T. N., Fan, S., Chandra, A., Bielenberg, D. G., Reighard, G. L., Okie, W. R., & Abbott, A. G. (2013) · Tree Genetics & Genomes · doi:10.1007/s11295-013-0660-6 · Cited by 74
Kobayashi, M. J., Takeuchi, Y., Kenta, T., Kume, T., Diway, B., & Shimizu, K. K. (2013) · Molecular Ecology · doi:10.1111/mec.12344 · Cited by 74
Kikuchi, R., Kawahigashi, H., Oshima, M., Ando, T., & Handa, H. (2011) · Journal of Experimental Botany · doi:10.1093/jxb/err299 · Cited by 73
The circadian clock goes genomic
Staiger, D., Shin, J., Johansson, M., & Davis, S. J. (2013) · Genome biology · doi:10.1186/gb-2013-14-6-208 · Cited by 71
Adaptation of barley to mild winters: A role for PPDH2
Casao, M. C., Karsaï, I., Igartua, E., Gracia, M. P., Veisz, O., & Casas, A. M. (2011) · BMC Plant Biology · doi:10.1186/1471-2229-11-164 · Cited by 68
Qin, Z., Bai, Y., Muhammad, S., Wu, X., Deng, P., Wu, J., An, H., & Wu, L. (2019) · Nature Communications · doi:10.1038/s41467-019-08785-y · Cited by 68
Itoh, H., & Izawa, T. (2013) · Molecular Plant · doi:10.1093/mp/sst022 · Cited by 67
Calixto, C. P. G., Waugh, R., & Brown, J. W. S. (2015) · Journal of Molecular Evolution · doi:10.1007/s00239-015-9665-0 · Cited by 64
Diverse Roles of Ethylene in Regulating Agronomic Traits in Rice
Yin, C., Zhao, H., Ma, B., Chen, S., & Zhang, J. (2017) · Frontiers in Plant Science · doi:10.3389/fpls.2017.01676 · Cited by 64
Song, G., & Chen, Q. (2018) · BMC Plant Biology · doi:10.1186/s12870-018-1311-8 · Cited by 62
Clotault, J., Thuillet, A., Buiron, M., Mita, S. D., Couderc, M., Haussmann, B. I. G., Mariac, C., & Vigouroux, Y. (2011) · Molecular Biology and Evolution · doi:10.1093/molbev/msr287 · Cited by 62
CONSTANS Controls Floral Repression by Up-Regulating VERNALIZATION2 (VRN-H2) in Barley
Mulki, M. A., & von Korff, M. (2015) · PLANT PHYSIOLOGY · doi:10.1104/pp.15.01350 · Cited by 62
Huang, Z., Young, N. D., Reagon, M., Hyma, K. E., Olsen, K. M., Jia, Y., & Caicedo, A. L. (2017) · Molecular Ecology · doi:10.1111/mec.14120 · Cited by 62
Mizuno, N., Nitta, M., Sato, K., & Nasuda, S. (2012) · Genes & Genetic Systems · doi:10.1266/ggs.87.357 · Cited by 60
Timing is everything in plant development. The central role of floral repressors
Jarillo, J. A., & Piñeiro, M. (2011) · Plant Science · doi:10.1016/j.plantsci.2011.06.011 · Cited by 60
Zhao, X., Huang, L., Zhang, X., Wang, J., Yan, D., Li, J., Tang, L., Li, X., & Shi, T. (2016) · Scientific Reports · doi:10.1038/srep29345 · Cited by 59
Lia, W., Hana, Y., Taoa, F., & Chonga, K. (2011) · Cited by 59
Genome-Wide Comparative Analysis of Flowering-Related Genes in Arabidopsis, Wheat, and Barley
Peng, F. Y., Hu, Z., & Yang, R. (2015) · International Journal of Plant Genomics · doi:10.1155/2015/874361 · Cited by 58
Xu, J., Liu, Y., Liu, J., Cao, M., Wang, J., Lan, H., Xu, Y., Lu, Y., Pan, G., & Rong, T. (2012) · Journal of Integrative Plant Biology · doi:10.1111/j.1744-7909.2012.01128.x · Cited by 57
Arabidopsis paves the way: genomic and network analyses in crops
Ferrier, T., Matus, J. T., Jin, J., & Riechmann, J. L. (2010) · Current Opinion in Biotechnology · doi:10.1016/j.copbio.2010.11.010 · Cited by 58
Woods, D. P., Ream, T. S., Bouché, F., Lee, J., Thrower, N. A., Wilkerson, C. G., & Amasino, R. M. (2017) · Proceedings of the National Academy of Sciences · doi:10.1073/pnas.1700536114 · Cited by 58
Wang, N., Chen, B., Xu, K., Gao, G., Li, F., Qiao, J., Yan, G., Li, J., Li, H., & Wu, X. (2016) · Frontiers in Plant Science · doi:10.3389/fpls.2016.00338 · Cited by 57
Genomics-Assisted Plant Breeding in the 21st Century: Technological Advances and Progress
Siva, P., Buyyarapu, R., Abdurakhmonov, I. Y., & Ja'far, A. K. (2012) · InTech eBooks · doi:10.5772/37458 · Cited by 56
Turner, A. S., Faure, S., Zhang, Y., & Laurie, D. A. (2013) · Theoretical and Applied Genetics · doi:10.1007/s00122-013-2133-6 · Cited by 54
Self-citationColton-Gagnon, K., Ali‐Benali, M. A., Mayer, B. F., Dionne, R. M., Bertrand, A., Carmo, S. D., & Charron, J. (2013) · Annals of Botany · doi:10.1093/aob/mct283 · Cited by 53
Huan, Q., Mao, Z., Chong, K., & Zhang, J. (2018) · New Phytologist · doi:10.1111/nph.15288 · Cited by 55
Novel insights from non-conserved microRNAs in plants
Qin, Z., Li, C., Mao, L., & Wu, L. (2014) · Frontiers in Plant Science · doi:10.3389/fpls.2014.00586 · Cited by 57
Casao, M. C., Igartua, E., Karsaï, I., Lasa, J. M., Gracia, M. P., & Casas, A. M. (2010) · Journal of Experimental Botany · doi:10.1093/jxb/erq382 · Cited by 53
MiR172-APETALA2-like genes integrate vernalization and plant age to control flowering time in wheat
Debernardi, J. M., Woods, D. P., Li, K., Li, C., & Dubcovsky, J. (2022) · PLoS Genetics · doi:10.1371/journal.pgen.1010157 · Cited by 50
Zhang, J., Ai, X., Sun, L., Zhang, D., Guo, W., Deng, X., & Hu, C. (2011) · BMC Genomics · doi:10.1186/1471-2164-12-63 · Cited by 52
Genome‐wide associations with flowering time in switchgrass using exome‐capture sequencing data
Grabowski, P., Evans, J., Daum, C. G., Deshpande, S., Barry, K., Kennedy, M., Ramstein, G. P., Kaeppler, S. M., Buell, C. R., Jiang, Y., et al. (2016) · New Phytologist · doi:10.1111/nph.14101 · Cited by 52
Halliwell, J., Borrill, P., Gordon, A., Kowalczyk, R., Pagano, M. L., Saccomanno, B., Bentley, A. R., Uauy, C., & Cockram, J. (2016) · Frontiers in Plant Science · doi:10.3389/fpls.2016.00857 · Cited by 51
Polycomb Repressive Complex 2 in Eukaryotes—An Evolutionary Perspective
Vijayanathan, M., Trejo-Arellano, M. G., & Mozgová, I. (2022) · Epigenomes · doi:10.3390/epigenomes6010003 · Cited by 49
Fu, Y., Poli, M., Sablok, G., Wang, B., Liang, Y., Porta, N. L., Velikova, V., Loreto, F., Li, M., & Varotto, C. (2016) · Biotechnology for Biofuels · doi:10.1186/s13068-016-0471-8 · Cited by 45
Metadata
- Authors
- Higgins, J. A., Bailey, P. C., & Laurie, D. A.
- Affiliations
- John Innes Centre (GB)
- Corresponding author
- Higgins, Janet A.
- Venue
- PLoS ONE
- Publisher
- Public Library of Science (PLoS)
- Published
- 2010-04-19
- Volume
- 5
- Issue
- 4
- Pages
- e10065
- ISSN
- 1932-6203 (ISSN-L)
- PMC
- PMC2856676
- OpenAlex
- W1988145565
- Cited by
- 280
- References
- 139
- Citations by year
- 2026: 6 · 2025: 4 · 2024: 5 · 2023: 7 · 2022: 18 · 2021: 12 · 2020: 17 · 2019: 14 · 2018: 22 · 2017: 15 · 2016: 28 · 2015: 15 · 2014: 18 · 2013: 38 · 2012: 32
- FWCI
- 38.11
- Type
- journal article
- Language
- en
- Open access
- gold
- doi.org
- Locations
- PLoS ONE (publishedVersion, cc-by)
- PubMed Central (publishedVersion, cc-by)
- PubMed (publishedVersion)
- DOAJ (DOAJ: Directory of Open Access Journals) (submittedVersion, cc-by-sa)
- Figshare (submittedVersion, cc-by)
- Funders
- Gatsby Charitable Foundation
- Biotechnology and Biological Sciences Research Council (BBS/E/J/000CA286)
- Topics
- Life Sciences › Agricultural and Biological Sciences › Plant Science › Plant Molecular Biology Research
- Life Sciences › Biochemistry, Genetics and Molecular Biology › Genetics › Chromosomal and Genetic Variations
- Life Sciences › Biochemistry, Genetics and Molecular Biology › Genetics › Genetic Mapping and Diversity in Plants and Animals
- Keywords
- flowering time, Brachypodium distachyon, temperate grass, photoperiod pathway, vernalization pathway, autonomous pathway, circadian clock, CONSTANS, segmental duplication, gene family evolution, cereal domestication, Arabidopsis thaliana, rice, gene homology, MADS-box genes
- MeSH terms
- Poaceae, Temperature, Genes, Plant, Photoperiod, Genome, Plant, Genomics, Flowers, Metabolic Networks and Pathways
About these checks
Registry, retraction, Cites and statistics results are computed, not judged, with one exception: a printed reference that no index lists is read once by a model before it counts as a citation error. Claims are extracted by a model and kept only when their quote appears verbatim in the text; each cited source is then checked, with a model’s help, for whether it says what the claim relies on. Those verdicts can be wrong — read the claim’s quote and the cited source before relying on one.
Statistics and arithmetic are recomputed, not judged.
Confidence bands are shown only for fields calibrated on our annotated test set. None is calibrated yet, so no band is shown.
What counts as a claim ›How we measure confidence ›How we check this ›
Are you an author, or do you see a problem with this page? Request a review
