

The DOI matches its Crossref record; 45 of the 45 references it cites were found in a registry or an index.
Social Network Sensors for Early Detection of Contagious Outbreaks
Open accessAbstract
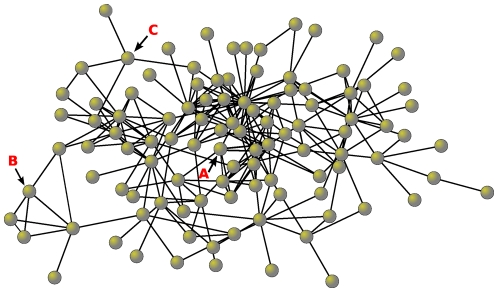
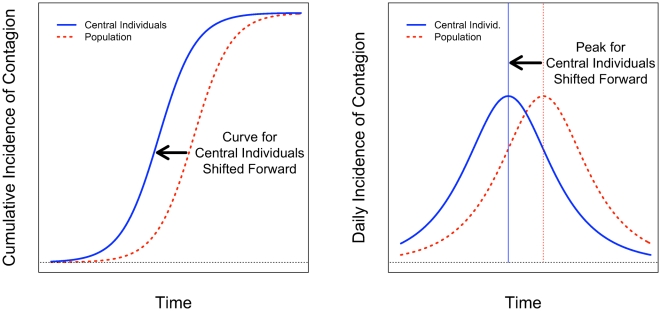
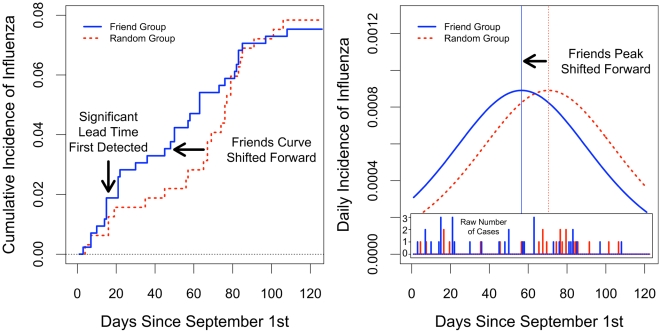
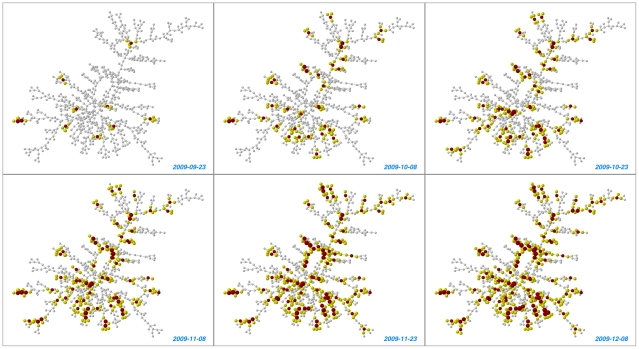
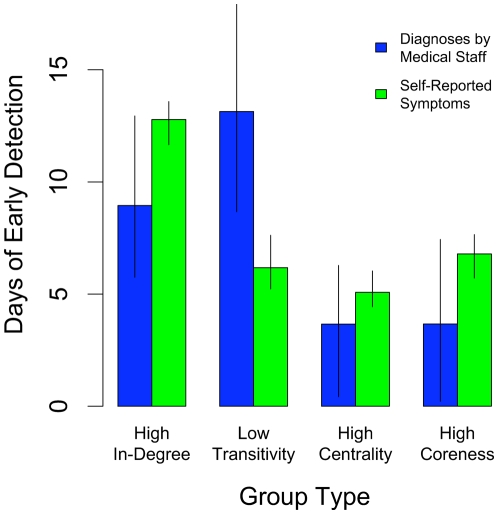
Current methods for the detection of contagious outbreaks give contemporaneous information about the course of an epidemic at best. It is known that individuals near the center of a social network are likely to be infected sooner during the course of an outbreak, on average, than those at the periphery. Unfortunately, mapping a whole network to identify central individuals who might be monitored for infection is typically very difficult. We propose an alternative strategy that does not require ascertainment of global network structure, namely, simply monitoring the friends of randomly selected individuals. Such individuals are known to be more central. To evaluate whether such a friend group could indeed provide early detection, we studied a flu outbreak at Harvard College in late 2009. We followed 744 students who were either members of a group of randomly chosen individuals or a group of their friends. Based on clinical diagnoses, the progression of the epidemic in the friend group occurred 13.9 days (95% C.I. 9.9-16.6) in advance of the randomly chosen group (i.e., the population as a whole). The friend group also showed a significant lead time (p<0.05) on day 16 of the epidemic, a full 46 days before the peak in daily incidence in the population as a whole. This sensor method could provide significant additional time to react to epidemics in small or large populations under surveillance. The amount of lead time will depend on features of the outbreak and the network at hand. The method could in principle be generalized to other biological, psychological, informational, or behavioral contagions that spread in networks.
Overview
The claims and statistics of this paper haven’t been checked yet.
Run the check — free, no account needed. It reads the open-access text and checks the sources it cites.
Integrity signals
Registry
Cites
Statistics
Figures
Verification
Claims the paper makes
The claims and statistics of this paper haven’t been checked yet.
Run the check — free, no account needed. It reads the open-access text and checks the sources it cites.
Self-check
Percentages, sums and reported differences re-computed from the paper’s own numbers.
The self-check needs the paper’s full text.
Citations
Cites
Rogers, E. M., Singhal, A., & Quinlan, M. M. (2019) · Routledge eBooks · doi:10.4324/9780203710753-35 · Cited by 37,670
Mack, P., & Rogers, E. (1964) · Encyclopedia of Sport Management · doi:10.2307/3319808 · Cited by 23,677
A set of measures of centrality based upon betweenness
Freeman, L. (1977) · Sociometry · doi:10.2307/3033543 · Cited by 10,557
Stanton, B. F., & Rogers, E. M. (1963) · Journal of Farm Economics · doi:10.2307/1235767 · Cited by 6,726
Detecting influenza epidemics using search engine query data
Ginsberg, J., Mohebbi, M. H., Patel, R. S., Brammer, L., Smolinski, M. S., & Brilliant, L. (2009) · Nature · doi:10.1038/nature07634 · Cited by 4,295
Nonlinear Regression Analysis and Its Applications
Bates, D. M., & Watts, D. G. (1988) · Wiley series in probability and statistics · doi:10.1002/9780470316757 · Cited by 4,017
Social Contacts and Mixing Patterns Relevant to the Spread of Infectious Diseases
Mossong, J., Hens, N., Jit, M., Beutels, P., Auranen, K., Mikolajczyk, R., Massari, M., Salmaso, S., Tomba, G. S., Wallinga, J., et al. (2008) · PLoS Medicine · doi:10.1371/journal.pmed.0050074 · Cited by 2,900
An algorithm for drawing general undirected graphs
Kamada, T., & Kawai, S. (1989) · Information Processing Letters · doi:10.1016/0020-0190(89)90102-6 · Cited by 2,750
Cost-effective outbreak detection in networks
Leskovec, J., Krause, A., Guestrin, C., Faloutsos, C., VanBriesen, J. M., & Glance, N. (2007) · ACM SIGKDD Conference on Knowledge Discovery and Data Mining (KDD) · doi:10.1145/1281192.1281239 · Cited by 2,614
The collective dynamics of smoking in a large social network
Christakis, N. A., & Fowler, J. H. (2008) · New England Journal of Medicine · doi:10.1056/nejmsa0706154 · Cited by 2,390
Self-citation
Cited by
Sorted by citations
Using social and behavioural science to support COVID-19 pandemic response
Bavel, J. J. V., Baicker, K., Boggio, P. S., Capraro, V., Cichocka, A., Cikara, M., Crockett, M. J., Crum, A. J., Douglas, K. M., Druckman, J. N., et al. (2020) · Nature Human Behaviour · doi:10.1038/s41562-020-0884-z · Cited by 4,964
Self-citationEpidemic processes in complex networks
Pastor-Satorras, R., Castellano, C., Van Mieghem, P., & Vespignani, A. (2015) · Reviews of Modern Physics · doi:10.1103/revmodphys.87.925 · Cited by 3,697
Social contagion theory: examining dynamic social networks and human behavior
Christakis, N. A., & Fowler, J. H. (2013) · Statistics in Medicine · doi:10.1002/sim.5408 · Cited by 1,303
Self-citationIncreasing Vaccination: Putting Psychological Science Into Action
Brewer, N. T., Chapman, G. B., Rothman, A. J., Leask, J., & Kempe, A. (2017) · Psychological Science in the Public Interest · doi:10.1177/1529100618760521 · Cited by 1,233
Statistical physics of vaccination
Wang, Z., Bauch, C. T., Bhattacharyya, S., d’Onofrio, A., Manfredi, P., Perc, M., Perra, N., Salathé, M., & Zhao, D. (2016) · Physics Reports · doi:10.1016/j.physrep.2016.10.006 · Cited by 973
Metadata
- Authors
- Christakis, N. A., & Fowler, J. H.
- Affiliations
- Harvard University (US)
- University of California San Diego (US)
- Corresponding author
- Christakis, Nicholas A.
- Venue
- PLoS ONE
- Publisher
- Public Library of Science (PLoS)
- Published
- 2010-09-15
- Volume
- 5
- Issue
- 9
- Pages
- e12948
- ISSN
- 1932-6203 (ISSN-L)
- PMC
- PMC2939797
- OpenAlex
- W2140095656
- Cited by
- 535
- References
- 44
- Citations by year
- 2026: 8 · 2025: 8 · 2024: 21 · 2023: 19 · 2022: 33 · 2021: 49 · 2020: 38 · 2019: 31 · 2018: 40 · 2017: 50 · 2016: 40 · 2015: 48 · 2014: 44 · 2013: 36 · 2012: 46
- FWCI
- 24.74
- Type
- journal article
- Language
- en
- Open access
- gold
- doi.org
- Locations
- PLoS ONE (publishedVersion, cc-by)
- PubMed Central (publishedVersion, cc-by)
- PubMed (publishedVersion)
- arXiv (Cornell University) (submittedVersion)
- eScholarship (California Digital Library) (submittedVersion)
- Digital Access to Scholarship at Harvard (DASH) (Harvard University) (submittedVersion, cc-by)
- DOAJ (DOAJ: Directory of Open Access Journals) (submittedVersion)
- Figshare (submittedVersion, cc-by)
- arXiv (Cornell University)
- Funders
- Robert Wood Johnson Foundation
- McKnight Foundation
- Harvard University
- National Institute on Aging (P01AG031093)
- National Institute of General Medical Sciences (P41GM103504)
- Topics
- Health Sciences › Medicine › Epidemiology › Data-Driven Disease Surveillance
- Physical Sciences › Physics and Astronomy › Statistical and Nonlinear Physics › Complex Network Analysis Techniques
- Physical Sciences › Mathematics › Applied Mathematics › Mathematical and Theoretical Epidemiology and Ecology Models
- Keywords
- influenza outbreak, 2009 H1N1 pandemic, Harvard College, network centrality, lead time, disease surveillance
- MeSH terms
- Disease Outbreaks, Female, Humans, Influenza, Human, Male, Social Support, Early Diagnosis, Young Adult, Epidemics
About these checks
Registry, retraction, Cites and statistics results are computed, not judged, with one exception: a printed reference that no index lists is read once by a model before it counts as a citation error. Claims are extracted by a model and kept only when their quote appears verbatim in the text; each cited source is then checked, with a model’s help, for whether it says what the claim relies on. Those verdicts can be wrong — read the claim’s quote and the cited source before relying on one.
Statistics and arithmetic are recomputed, not judged.
Confidence bands are shown only for fields calibrated on our annotated test set. None is calibrated yet, so no band is shown.
What counts as a claim ›How we measure confidence ›How we check this ›
Are you an author, or do you see a problem with this page? Request a review
