

The DOI matches its Crossref record; 54 of the 54 references it cites were found in a registry or an index.
A Metagenomic Analysis of Pandemic Influenza A (2009 H1N1) Infection in Patients from North America
Open accessAbstract
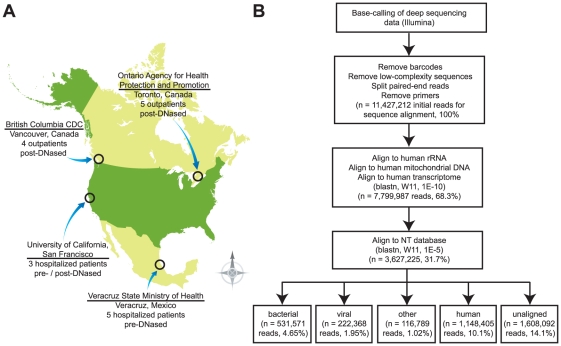
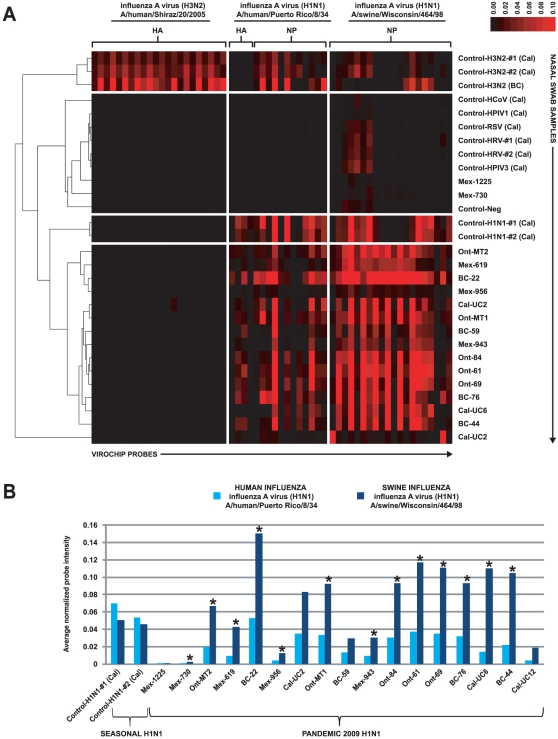
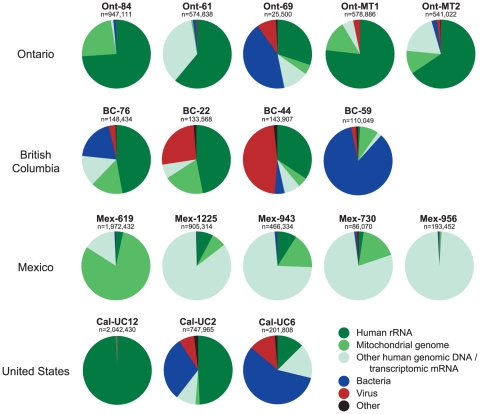
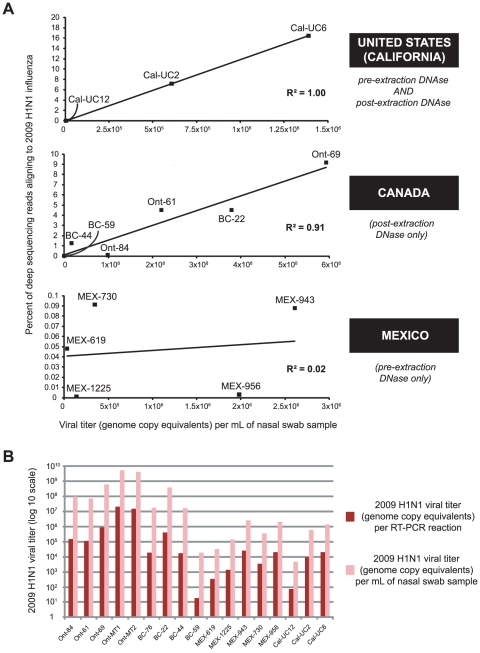
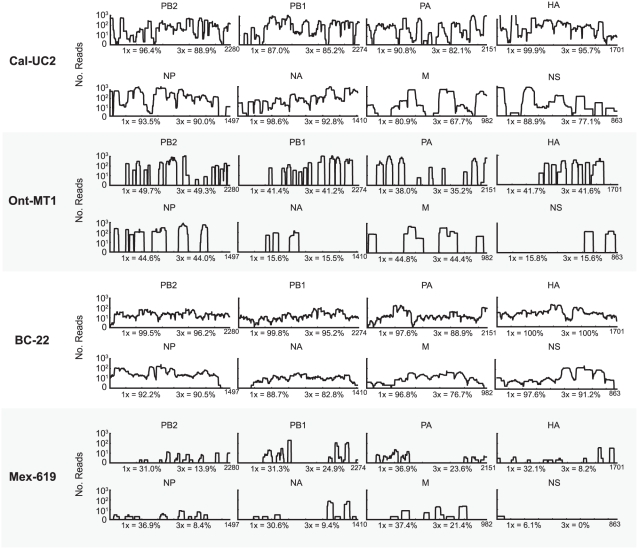
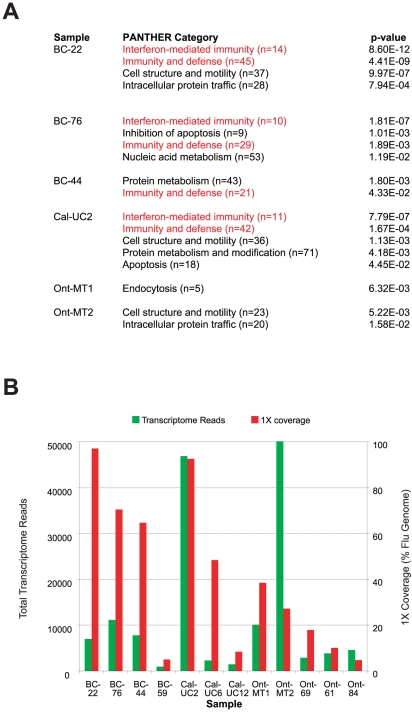
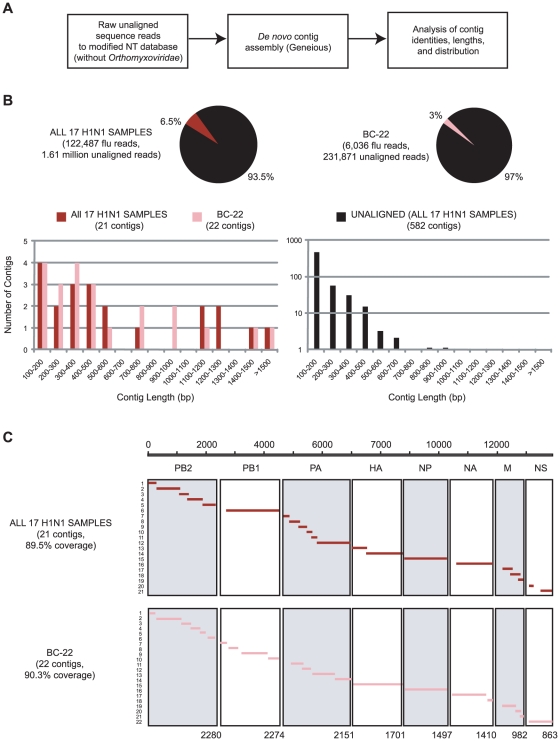
Although metagenomics has been previously employed for pathogen discovery, its cost and complexity have prevented its use as a practical front-line diagnostic for unknown infectious diseases. Here we demonstrate the utility of two metagenomics-based strategies, a pan-viral microarray (Virochip) and deep sequencing, for the identification and characterization of 2009 pandemic H1N1 influenza A virus. Using nasopharyngeal swabs collected during the earliest stages of the pandemic in Mexico, Canada, and the United States (n = 17), the Virochip was able to detect a novel virus most closely related to swine influenza viruses without a priori information. Deep sequencing yielded reads corresponding to 2009 H1N1 influenza in each sample (percentage of aligned sequences corresponding to 2009 H1N1 ranging from 0.0011% to 10.9%), with up to 97% coverage of the influenza genome in one sample. Detection of 2009 H1N1 by deep sequencing was possible even at titers near the limits of detection for specific RT-PCR, and the percentage of sequence reads was linearly correlated with virus titer. Deep sequencing also provided insights into the upper respiratory microbiota and host gene expression in response to 2009 H1N1 infection. An unbiased analysis combining sequence data from all 17 outbreak samples revealed that 90% of the 2009 H1N1 genome could be assembled de novo without the use of any reference sequence, including assembly of several near full-length genomic segments. These results indicate that a streamlined metagenomics detection strategy can potentially replace the multiple conventional diagnostic tests required to investigate an outbreak of a novel pathogen, and provide a blueprint for comprehensive diagnosis of unexplained acute illnesses or outbreaks in clinical and public health settings.
Overview
The claims and statistics of this paper haven’t been checked yet.
Run the check — free, no account needed. It reads the open-access text and checks the sources it cites.
Integrity signals
Registry
Cites
Statistics
Figures
Verification
Claims the paper makes
The claims and statistics of this paper haven’t been checked yet.
Run the check — free, no account needed. It reads the open-access text and checks the sources it cites.
Claims other papers make about this one
Each is checked against this paper’s own text: does it say what the citing paper says it does?
In the citing paper
“However, these studies demonstrated that there was considerable inter-subject variability, highlighting the need for longitudinal studies to decipher changes following viral infection.”
From Respiratory viral infection-induced microbiome alterations and secondary bacterial pneumonia. (2018) · cites this paper as [110]
In the citing paper
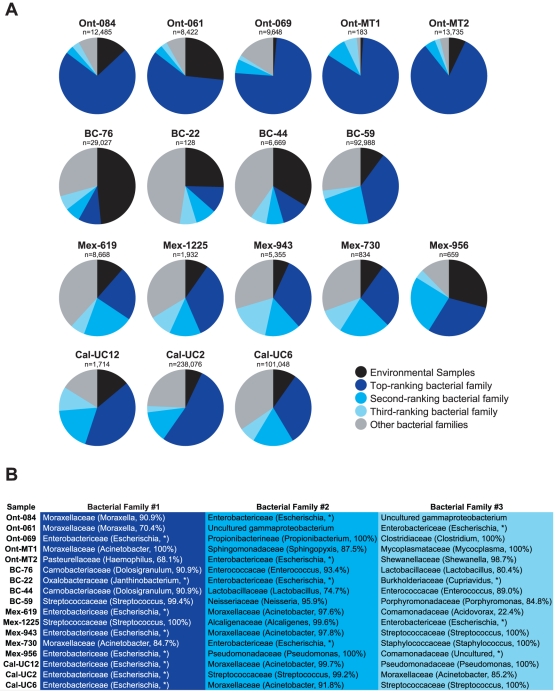
“These findings are supported by another group who found that Moraxella and Enterobacter spp. (which are classified as Proteobacteria) were the most highly represented bacteria in nasopharyngeal samples obtained from patients with pandemic H1N1 influenza (110).”
From Respiratory viral infection-induced microbiome alterations and secondary bacterial pneumonia. (2018) · cites this paper as [110]
Self-check
Percentages, sums and reported differences re-computed from the paper’s own numbers.
The self-check needs the paper’s full text.
Citations
Cites
2 retracted
Urisman, A., Molinaro, R. J., Fischer, N., Plummer, S. J., Casey, G., Klein, E. A., Malathi, K., Magi-Galluzzi, C., Tubbs, R. R., Ganem, D., et al. (2006) · PLoS Pathogens · doi:10.1371/journal.ppat.0020025 · Cited by 577
RetractedLombardi, V. C., Ruscetti, F. W., Das Gupta, J., Pfost, M. A., Hagen, K. S., Peterson, D. L., Ruscetti, S. K., Bagni, R. K., Petrow-Sadowski, C., Gold, B., et al. (2009) · Science · doi:10.1126/science.1179052 · Cited by 538
RetractedReal-Time DNA Sequencing from Single Polymerase Molecules
Eid, J., Fehr, A., Gray, J., Luong, K., Lyle, J., Otto, G., Peluso, P., Rank, D., Baybayan, P., Bettman, B., et al. (2009) · Science · doi:10.1126/science.1162986 · Cited by 3,732
Clonal Integration of a Polyomavirus in Human Merkel Cell Carcinoma
Feng, H., Shuda, M., Chang, Y., & Moore, P. S. (2008) · Science · doi:10.1126/science.1152586 · Cited by 3,208
Emergence of a Novel Swine-Origin Influenza A (H1N1) Virus in Humans
Novel Swine-Origin Influenza A (H1N1) Virus Investigation Team (2009) · New England Journal of Medicine · doi:10.1056/nejmoa0903810 · Cited by 3,063
Multiple Sequence Alignment Using ClustalW and ClustalX
Thompson, J., Gibson, T. J., & Higgins, D. G. (2002) · Current Protocols in Bioinformatics · doi:10.1002/0471250953.bi0203s00 · Cited by 2,989
Antiviral Actions of Interferons
Samuel, C. E. (2001) · Clinical Microbiology Reviews · doi:10.1128/cmr.14.4.778-809.2001 · Cited by 2,743
Characterization of a Novel Coronavirus Associated with Severe Acute Respiratory Syndrome
Rota, P. A., Oberste, M. S., Monroe, S. S., Nix, W. A., Campagnoli, R. P., Icenogle, J. P., Peñaranda, S., Bankamp, B., Maher, K., Chen, M., et al. (2003) · Science · doi:10.1126/science.1085952 · Cited by 2,477
Origins and evolutionary genomics of the 2009 swine-origin H1N1 influenza A epidemic
Smith, G. J. D., Vijaykrishna, D., Bahl, J., Lycett, S., Worobey, M., Pybus, O. G., Ma, S. K., Cheung, C. L., Raghwani, J., Bhatt, S., et al. (2009) · Nature · doi:10.1038/nature08182 · Cited by 2,250
The NIH Human Microbiome ProjectPreprint
The NIH HMP Working Group, Peterson, J. L., Garges, S., Giovanni, M. Y., McInnes, P., Wang, L., Schloss, J. A., Bonazzi, V. R., McEwen, J. E., Wetterstrand, K. A., et al. (2009) · Genome Research · doi:10.1101/gr.096651.109 · Cited by 2,168
Cited by
Sorted by citations
Next-generation transcriptome assembly
Martin, J. A., & Wang, Z. (2011) · Nature Reviews Genetics · doi:10.1038/nrg3068 · Cited by 1,309
Actionable Diagnosis of Neuroleptospirosis by Next-Generation Sequencing
Wilson, M. R., Naccache, S. N., Samayoa, E., Biagtan, M., Bashir, H., Yu, G., Salamat, S. M., Somasekar, S., Federman, S., Miller, S., et al. (2014) · New England Journal of Medicine · doi:10.1056/nejmoa1401268 · Cited by 977
Self-citationMetagenomics and future perspectives in virus discovery
Mokili, J. L., Rohwer, F. L., & Dutilh, B. E. (2012) · Current Opinion in Virology · doi:10.1016/j.coviro.2011.12.004 · Cited by 686
Miller, S. A., Naccache, S. N., Samayoa, E., Messacar, K., Arevalo, S., Federman, S., Stryke, D., Pham, E., Fung, B., Bolosky, W. J., et al. (2019) · Genome Research · doi:10.1101/gr.238170.118 · Cited by 593
Self-citationGreninger, A. L., Naccache, S. N., Federman, S., Yu, G., Mbala, P., Bres, V., Stryke, D., Bouquet, J., Somasekar, S., Linnen, J. M., et al. (2015) · Genome Medicine · doi:10.1186/s13073-015-0220-9 · Cited by 558
Self-citation
Metadata
- Authors
- Greninger, A. L., Chen, E. C., Sittler, T., Scheinerman, A., Roubinian, N., Yu, G., Kim, E., Pillai, D. R., Guyard, C., Mazzulli, T., Isa, P., Arias, C. F., Hackett, J., Schochetman, G., Miller, S., Tang, P., & Chiu, C. Y.
- Affiliations
- University of California, San Francisco (US)
- University of British Columbia (CA)
- University of Toronto (CA)
- Mount Sinai Hospital (CA)
- Universidad Nacional Autónoma de México (MX)
- Corresponding author
- Chiu, Charles Y.
- ORCID
- Venue
- PLoS ONE
- Publisher
- Public Library of Science (PLoS)
- Published
- 2010-10-18
- Volume
- 5
- Issue
- 10
- Pages
- e13381
- ISSN
- 1932-6203 (ISSN-L)
- PMC
- PMC2956640
- OpenAlex
- W2078626331
- Cited by
- 193
- References
- 54
- Citations by year
- 2026: 4 · 2025: 3 · 2024: 8 · 2023: 6 · 2022: 5 · 2021: 9 · 2020: 7 · 2019: 12 · 2018: 15 · 2017: 16 · 2016: 11 · 2015: 16 · 2014: 19 · 2013: 27 · 2012: 23
- FWCI
- 14.43
- Type
- journal article
- Language
- en
- Open access
- gold
- doi.org
- Locations
- PLoS ONE (publishedVersion, cc-by)
- PubMed Central (publishedVersion, cc-by)
- PubMed (publishedVersion)
- DOAJ (DOAJ: Directory of Open Access Journals) (submittedVersion, cc-by-sa)
- Figshare (submittedVersion, cc-by)
- Greater South Information System
- Funders
- Kleine-Levin Syndrome Foundation
- California Department of Public Health
- Amazon Web Services
- National Institutes of Health
- University of California, San Francisco
- Abbott Diagnostics
- National Institute of General Medical Sciences (T32GM007618)
- National Institute of Allergy and Infectious Diseases (K08AI074913)
- Topics
- Health Sciences › Medicine › Epidemiology › Influenza Virus Research Studies
- Life Sciences › Biochemistry, Genetics and Molecular Biology › Molecular Biology › Genomics and Phylogenetic Studies
- Health Sciences › Medicine › Epidemiology › Respiratory viral infections research
- Keywords
- 2009 H1N1 influenza A virus, pandemic influenza, metagenomics, deep sequencing, swine influenza virus, host gene expression, de novo genome assembly, viral titer, outbreak diagnosis, North America
- MeSH terms
- Humans, Influenza, Human, North America, Polymorphism, Single Nucleotide, Gene Expression Profiling, Genomics, Influenza A Virus, H1N1 Subtype
About these checks
Registry, retraction, Cites and statistics results are computed, not judged, with one exception: a printed reference that no index lists is read once by a model before it counts as a citation error. Claims are extracted by a model and kept only when their quote appears verbatim in the text; each cited source is then checked, with a model’s help, for whether it says what the claim relies on. Those verdicts can be wrong — read the claim’s quote and the cited source before relying on one.
Statistics and arithmetic are recomputed, not judged.
Confidence bands are shown only for fields calibrated on our annotated test set. None is calibrated yet, so no band is shown.
What counts as a claim ›How we measure confidence ›How we check this ›
Are you an author, or do you see a problem with this page? Request a review
