

The DOI matches its Crossref record; 58 of the 58 references it cites were found in a registry or an index.
Enrichment Map: A Network-Based Method for Gene-Set Enrichment Visualization and Interpretation
Open accessAbstract
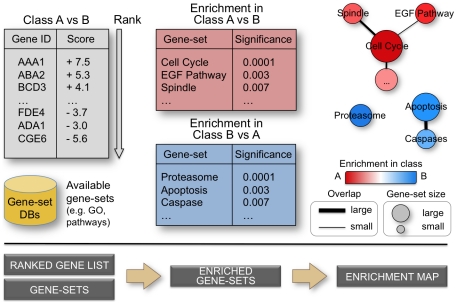
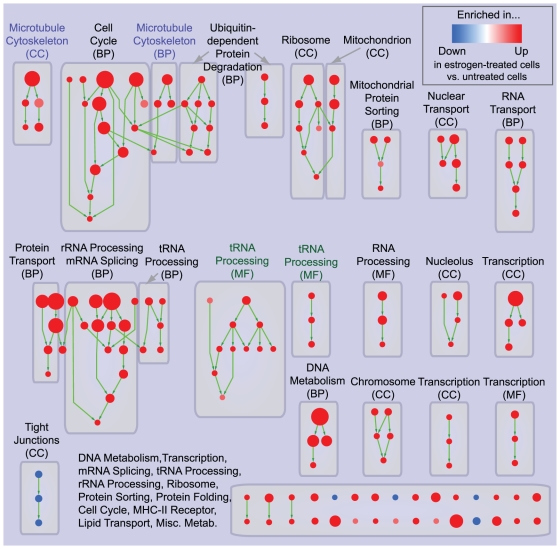
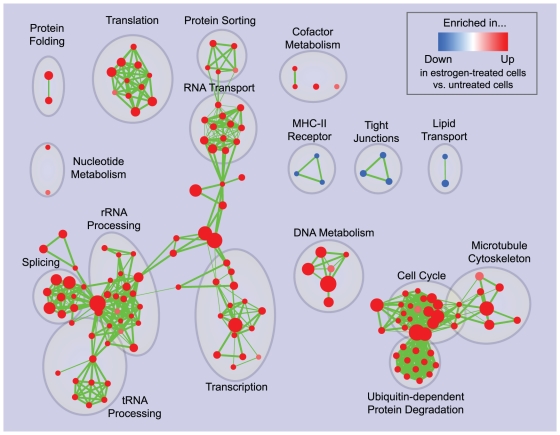
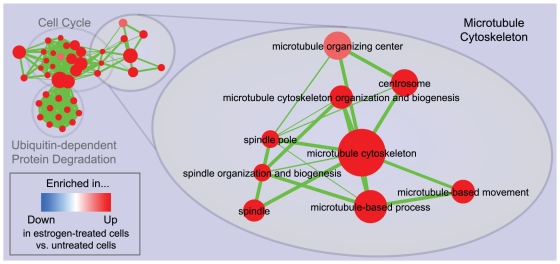
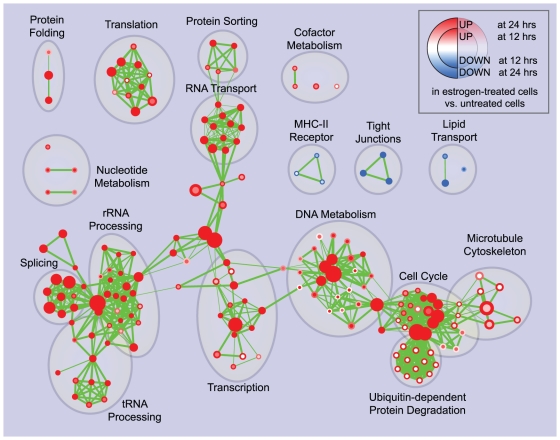
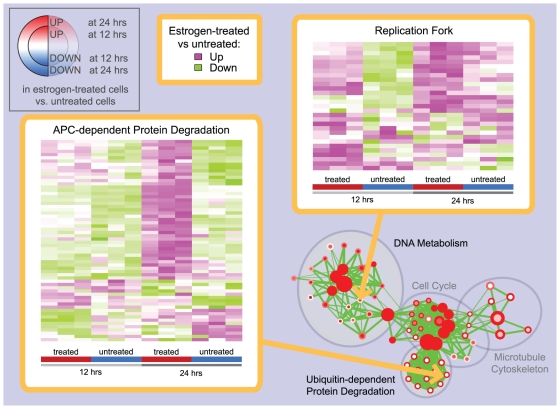
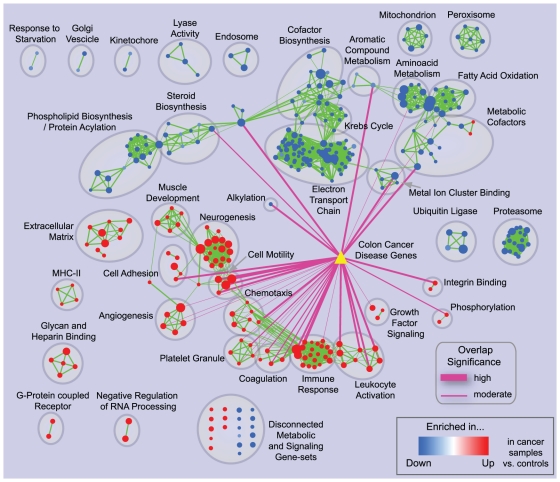
BACKGROUND: Gene-set enrichment analysis is a useful technique to help functionally characterize large gene lists, such as the results of gene expression experiments. This technique finds functionally coherent gene-sets, such as pathways, that are statistically over-represented in a given gene list. Ideally, the number of resulting sets is smaller than the number of genes in the list, thus simplifying interpretation. However, the increasing number and redundancy of gene-sets used by many current enrichment analysis software works against this ideal. PRINCIPAL FINDINGS: To overcome gene-set redundancy and help in the interpretation of large gene lists, we developed "Enrichment Map", a network-based visualization method for gene-set enrichment results. Gene-sets are organized in a network, where each set is a node and edges represent gene overlap between sets. Automated network layout groups related gene-sets into network clusters, enabling the user to quickly identify the major enriched functional themes and more easily interpret the enrichment results. CONCLUSIONS: Enrichment Map is a significant advance in the interpretation of enrichment analysis. Any research project that generates a list of genes can take advantage of this visualization framework. Enrichment Map is implemented as a freely available and user friendly plug-in for the Cytoscape network visualization software (http://baderlab.org/Software/EnrichmentMap/).
Overview
The claims and statistics of this paper haven’t been checked yet.
Run the check — free, no account needed. It reads the open-access text and checks the sources it cites.
Integrity signals
Registry
Cites
Statistics
Figures
Verification
Claims the paper makes
The claims and statistics of this paper haven’t been checked yet.
Run the check — free, no account needed. It reads the open-access text and checks the sources it cites.
Claims other papers make about this one
Each is checked against this paper’s own text: does it say what the citing paper says it does?
The check wasn’t confident either way, so it gives no verdict — never disputed.
In the citing paper
“Furthermore, gene set enrichment analysis (GSEA) revealed that the hypoxia pathway is impaired in miR-140G/G, but not in miR-140−/− chondrocytes”
From Gain-of-function mutation of microRNA-140 in human skeletal dysplasia (2019) · cites this paper as [26]
Experimental — accuracy not yet measured
Self-check
Percentages, sums and reported differences re-computed from the paper’s own numbers.
The self-check needs the paper’s full text.
Citations
Cites
Subramanian, A., Tamayo, P., Mootha, V. K., Mukherjee, S., Ebert, B. L., Gillette, M. A., Paulovich, A., Pomeroy, S. L., Golub, T. R., Lander, E. S., et al. (2005) · Proceedings of the National Academy of Sciences · doi:10.1073/pnas.0506580102 · Cited by 53,625
Gene Ontology: tool for the unification of biology
Ashburner, M., Ball, C. A., Blake, J. A., Botstein, D., Butler, H., Cherry, J. M., Davis, A. P., Dolinski, K., Dwight, S. S., Eppig, J. T., et al. (2000) · Nature Genetics · doi:10.1038/75556 · Cited by 43,206
Systematic and integrative analysis of large gene lists using DAVID bioinformatics resources
Huang, D. W., Sherman, B. T., & Lempicki, R. A. (2009) · Nature Protocols · doi:10.1038/nprot.2008.211 · Cited by 35,890
KEGG: Kyoto Encyclopedia of Genes and Genomes
Ogata, H., Goto, S., Sato, K., Fujibuchi, W., Bono, H., & Kanehisa, M. (1999) · Nucleic Acids Research · doi:10.1093/nar/27.1.29 · Cited by 31,232
Huang, D. W., Sherman, B. T., & Lempicki, R. A. (2009) · Nucleic Acids Research · doi:10.1093/nar/gkn923 · Cited by 14,108
Bioconductor: open software development for computational biology and bioinformatics
Gentleman, R. C., Carey, V. J., Bates, D. M., Bolstad, B., Dettling, M., Dudoit, S., Ellis, B., Gautier, L., Ge, Y., Gentry, J., et al. (2004) · Genome biology · doi:10.1186/gb-2004-5-10-r80 · Cited by 12,082
DAVID: Database for Annotation, Visualization, and Integrated Discovery
Dennis, G., Sherman, B. T., Hosack, D. A., Yang, J., Gao, W., Lane, H. C., & Lempicki, R. A. (2003) · Genome Biology · doi:10.1186/gb-2003-4-5-p3 · Cited by 9,327
Bindea, G., Mlecnik, B., Hackl, H., Charoentong, P., Tosolini, M., Kirilovsky, A., Fridman, W.-H., Pagès, F., Trajanoski, Z., & Galon, J. (2009) · Bioinformatics · doi:10.1093/bioinformatics/btp101 · Cited by 6,280
Maere, S., Heymans, K., & Kuiper, M. T. R. (2005) · Computer applications in the biosciences · doi:10.1093/bioinformatics/bti551 · Cited by 4,093
On the Interpretation of χ 2 from Contingency Tables, and the Calculation of P
Fisher, R. A. (1922) · Journal Of The Royal Statistical Society · doi:10.2307/2340521 · Cited by 2,975
Research works printed but not linked: 1
- S Draghici, 2003, Global functional profiling of gene expression., Genomics, 81, 98
Cited by
Sorted by citations
Items 1,001–1,005 of 1,005
Chromatin accessibility dynamics of myogenesis at single cell resolution
Pliner, H. A., Packer, J., McFaline-Figueroa, J. L., Cusanovich, D. A., Daza, R., Srivatsan, S., Qiu, X., Jackson, D., Minkina, A., Adey, A., et al. (2017) · doi:10.1101/155473 · Cited by 16
Human haematopoietic stem cells remember inflammatory stress
Zeng, A. G. X., Nagree, M. S., Jakobsen, N. A., Shah, S., Varesi, A., Kang, J. R. W., Murison, A., Cheong, J.-G., Turkalj, S., Zhang, X., et al. (2026) · Nature · doi:10.1038/s41586-026-10522-7 · Cited by 10
McHugo, G. P., Ward, J. A., Browne, J. A., O’Gorman, G. M., Meade, K. G., Hill, E. W., Hall, T. J., & MacHugh, D. E. (2025) · doi:10.1101/2025.01.31.635858 · Cited by 4
Balestra, C., Maj, C., Müller, E., & Mayr, A. (2023) · PLOS ONE · doi:10.1371/journal.pone.0282699 · Cited by 4
Deep Trans-Omic Network Fusion for Molecular Mechanism of Alzheimer’s Disease
Xie, L., Raj, Y., Varathan, P., He, B., Yu, M., Nho, K., Salama, P., Saykin, A. J., & Yan, J. (2024) · Journal of Alzheimer's Disease · doi:10.3233/jad-240098 · Cited by 2
Metadata
- Authors
- Merico, D., Isserlin, R., Stueker, O., Emili, A., & Bader, G. D.
- Affiliations
- University of Toronto (CA)
- Corresponding author
- Merico, Daniele
- Bader, Gary D.
- Venue
- PLoS ONE
- Publisher
- Public Library of Science (PLoS)
- Published
- 2010-11-15
- Volume
- 5
- Issue
- 11
- Pages
- e13984
- ISSN
- 1932-6203 (ISSN-L)
- PMC
- PMC2981572
- OpenAlex
- W2097948046
- Cited by
- 2,235
- References
- 58
- Citations by year
- 2026: 89 · 2025: 145 · 2024: 176 · 2023: 216 · 2022: 238 · 2021: 233 · 2020: 237 · 2019: 164 · 2018: 158 · 2017: 145 · 2016: 127 · 2015: 101 · 2014: 79 · 2013: 69 · 2012: 43
- FWCI
- 16.30
- Type
- journal article
- Language
- en
- Open access
- gold
- doi.org
- Locations
- PLoS ONE (publishedVersion, cc-by)
- PubMed Central (publishedVersion, cc-by)
- PubMed (publishedVersion)
- DOAJ (DOAJ: Directory of Open Access Journals) (submittedVersion, cc-by-sa)
- Figshare (submittedVersion, cc-by)
- Funders
- Heart and Stroke Foundation of Canada
- Genome Canada
- Ontario Genomics
- Ontario Genomics Institute
- Hospital for Sick Children
- National Institutes of Health
- National Human Genome Research Institute (P41 P41HG04118, P41HG04118, P41HG004118)
- Topics
- Life Sciences › Biochemistry, Genetics and Molecular Biology › Molecular Biology › Bioinformatics and Genomic Networks
- Health Sciences › Medicine › Health Informatics › Biomedical Text Mining and Ontologies
- Life Sciences › Biochemistry, Genetics and Molecular Biology › Molecular Biology › Genomics and Phylogenetic Studies
- Keywords
- gene set enrichment analysis, network visualization, gene set overlap, network clustering, pathway over-representation, gene expression data interpretation, Cytoscape plugin
- MeSH terms
- Algorithms, Breast Neoplasms, Colonic Neoplasms, Estrogens, Female, Humans, Software, Reproducibility of Results, Gene Expression Regulation, Neoplastic, Cluster Analysis, Computational Biology, Internet, Gene Expression Profiling, Gene Regulatory Networks
About these checks
Registry, retraction, Cites and statistics results are computed, not judged, with one exception: a printed reference that no index lists is read once by a model before it counts as a citation error. Claims are extracted by a model and kept only when their quote appears verbatim in the text; each cited source is then checked, with a model’s help, for whether it says what the claim relies on. Those verdicts can be wrong — read the claim’s quote and the cited source before relying on one.
Statistics and arithmetic are recomputed, not judged.
Confidence bands are shown only for fields calibrated on our annotated test set. None is calibrated yet, so no band is shown.
What counts as a claim ›How we measure confidence ›How we check this ›
Are you an author, or do you see a problem with this page? Request a review
