

The DOI matches its Crossref record; 22 of the 22 references it cites were found in a registry or an index.
Epigenetic Predictor of Age
Open accessAbstract
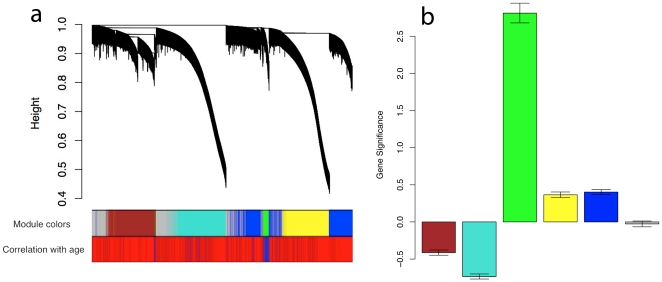
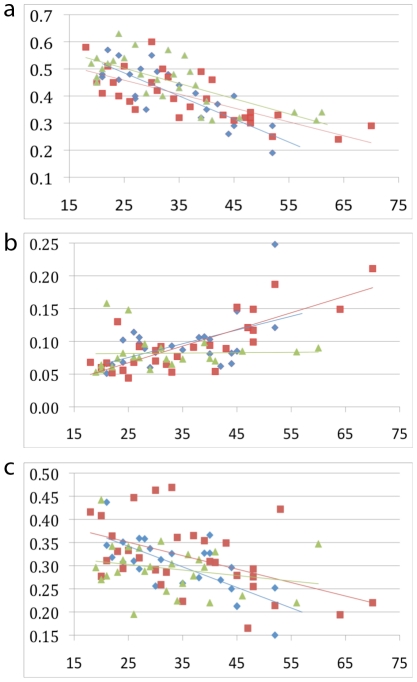
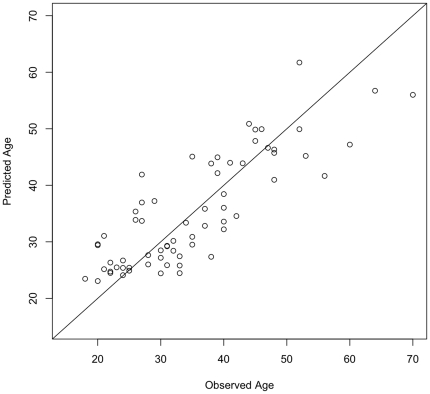
From the moment of conception, we begin to age. A decay of cellular structures, gene regulation, and DNA sequence ages cells and organisms. DNA methylation patterns change with increasing age and contribute to age related disease. Here we identify 88 sites in or near 80 genes for which the degree of cytosine methylation is significantly correlated with age in saliva of 34 male identical twin pairs between 21 and 55 years of age. Furthermore, we validated sites in the promoters of three genes and replicated our results in a general population sample of 31 males and 29 females between 18 and 70 years of age. The methylation of three sites--in the promoters of the EDARADD, TOM1L1, and NPTX2 genes--is linear with age over a range of five decades. Using just two cytosines from these loci, we built a regression model that explained 73% of the variance in age, and is able to predict the age of an individual with an average accuracy of 5.2 years. In forensic science, such a model could estimate the age of a person, based on a biological sample alone. Furthermore, a measurement of relevant sites in the genome could be a tool in routine medical screening to predict the risk of age-related diseases and to tailor interventions based on the epigenetic bio-age instead of the chronological age.
Overview
The claims and statistics of this paper haven’t been checked yet.
Run the check — free, no account needed. It reads the open-access text and checks the sources it cites.
Integrity signals
Registry
Cites
Statistics
Figures
Verification
Claims the paper makes
The claims and statistics of this paper haven’t been checked yet.
Run the check — free, no account needed. It reads the open-access text and checks the sources it cites.
Claims other papers make about this one
Each is checked against this paper’s own text: does it say what the citing paper says it does?
In the citing paper
“The first DNA methylation clock was an elastic net model (BOX 1) built in 2011 by Bocklandt et al.53, who demonstrated highly accurate chronological age prediction (within ~5 years) using only about 100 saliva samples.”
From Measuring biological age using omics data (2022) · cites this paper as [53]
Self-check
Percentages, sums and reported differences re-computed from the paper’s own numbers.
The self-check needs the paper’s full text.
Citations
Cites
WGCNA: an R package for weighted correlation network analysis
Langfelder, P., & Horvath, S. (2008) · BMC Bioinformatics · doi:10.1186/1471-2105-9-559 · Cited by 27,252
Self-citationStatistical significance for genomewide studies
Storey, J. D., & Tibshirani, R. (2003) · Proceedings of the National Academy of Sciences · doi:10.1073/pnas.1530509100 · Cited by 9,692
Adjusting batch effects in microarray expression data using empirical Bayes methods
Johnson, W. E., Li, C., & Rabinovic, A. (2007) · Biostatistics · doi:10.1093/biostatistics/kxj037 · Cited by 8,658
A General Framework for Weighted Gene Co-Expression Network Analysis
Zhang, B., & Horvath, S. (2005) · Statistical Applications in Genetics and Molecular Biology · doi:10.2202/1544-6115.1128 · Cited by 5,684
Self-citationEpigenetic differences arise during the lifetime of monozygotic twins
Fraga, M. F., Ballestar, E., Paz, M. F., Ropero, S., Setien, F., Ballestar, M. L., Heine-Suñer, D., Cigudosa, J. C., Urioste, M., Benitez, J., et al. (2005) · Proceedings of the National Academy of Sciences · doi:10.1073/pnas.0500398102 · Cited by 3,602
Marks, P. A., & Breslow, R. (2007) · Nature Biotechnology · doi:10.1038/nbt1272 · Cited by 1,198
Geometric Interpretation of Gene Coexpression Network Analysis
Horvath, S., & Dong, J. (2008) · PLoS Computational Biology · doi:10.1371/journal.pcbi.1000117 · Cited by 867
Self-citationAge-dependent DNA methylation of genes that are suppressed in stem cells is a hallmark of cancer
Teschendorff, A. E., Menon, U., Gentry-Maharaj, A., Ramus, S. J., Weisenberger, D. J., Shen, H., Campan, M., Noushmehr, H., Bell, C. G., Maxwell, A. P., et al. (2010) · Genome Research · doi:10.1101/gr.103606.109 · Cited by 855
Genome-wide association analysis by lasso penalized logistic regression
Wu, T. T., Chen, Y. F., Hastie, T., Sobel, E., & Lange, K. (2009) · Bioinformatics · doi:10.1093/bioinformatics/btp041 · Cited by 785
Human aging-associated DNA hypermethylation occurs preferentially at bivalent chromatin domainsPreprint
Rakyan, V. K., Down, T. A., Maslau, S., Andrew, T., Yang, T.-P., Beyan, H., Whittaker, P., McCann, O. T., Finer, S., Valdes, A. M., et al. (2010) · Genome Research · doi:10.1101/gr.103101.109 · Cited by 746
Cited by
Sorted by citations
Items 801–900 of 999
Decoupling of DNA Methylation Status and Gene Expression Levels in Aging Individuals
Wierczeiko, A., Fournier, D., Todorov, H., Klingenberg, S., Endres, K., & Gerber, S. (2018) · Genomics and Computational Biology · doi:10.18547/gcb.2018.vol4.iss2.e100040 · Cited by 2
Wan, M., & Bell, D. A. (2020) · Elsevier eBooks · doi:10.1016/b978-0-12-819414-0.00008-2 · Cited by 2
From gerontology to geroscience: a synopsis on ageing
Chmielewski, P. P. (2020) · Anthropological Review · doi:10.2478/anre-2020-0029 · Cited by 3
DNA Phenotyping: The Technique of the Future
Vajpayee, K., & Shukla, R. K. (2021) · Springer eBooks · doi:10.1007/978-981-15-9364-2_54-1 · Cited by 2
Environment, Epigenetics, and the Pace of Human Aging
Goldman, E. A., & Sterner, K. N. (2023) · Annual Review of Anthropology · doi:10.1146/annurev-anthro-052721-090516 · Cited by 3
Nonmammalian model organisms in epigenetic research
Norouzitallab, P., Baruah, K., Bossier, P., & Vanrompay, D. C. G. (2019) · Elsevier eBooks · doi:10.1016/b978-0-12-816363-4.00011-0 · Cited by 2
Aging in a relativistic biological space-timePreprint
Maestrini, D., Abler, D., Adhikarla, V., Armenian, S. H., Branciamore, S., Carlesso, N., Kuo, Y.-H., Marcucci, G., Sahoo, P., & Rockne, R. C. (2017) · bioRxiv (Cold Spring Harbor Laboratory) · doi:10.1101/229161 · Cited by 2
Pastoral care to Christian youth in South Africa who experience unwanted LGB attraction
Ashamu, C. A. (2020) · Boloka Institutional Repository (North-west University) · Cited by 2
Quantifying Human Biological Age: A Machine Learning Approach
Rahman, S. A. (2019) · The Research Repository @ WVU (West Virginia University) · doi:10.33915/etd.7376 · Cited by 2
Epigenetic models predict age and aging in plains zebras and other equidsPreprint
Larison, B., de Pinho, G. M., Haghani, A., Zoller, J. A., Li, C. Z., Finno, C. J., Farrell, C. P., Kaelin, C. B., Barsh, G. S., Wooding, B., et al. (2021) · bioRxiv (Cold Spring Harbor Laboratory) · doi:10.1101/2021.03.29.437607 · Cited by 2
Self-citationMarsellach, X. (2020) · Preprints.org · doi:10.20944/preprints202012.0506.v1 · Cited by 2
Predicting murine age across tissues and cell types using single cell transcriptome dataPreprint
Neumann, J. F., Leote, A. C., Liersch, M., & Beyer, A. (2022) · bioRxiv (Cold Spring Harbor Laboratory) · doi:10.1101/2022.10.19.512922 · Cited by 2
Steyaert, S., Verhelle, A., & Criekinge, W. V. (2023) · medRxiv · doi:10.1101/2023.07.07.23292381 · Cited by 2
Weighted 2D-kernel density estimations provide a new probabilistic measure for epigenetic agePreprint
Perez-Correa, J.-F., Stiehl, T., Marioni, R. E., Corley, J., Cox, S. R., Costa, I. G., & Wagner, W. (2024) · bioRxiv (Cold Spring Harbor Laboratory) · doi:10.1101/2024.06.10.598169 · Cited by 2
Markers, Mechanisms and Metrics of Biological Aging: A Scoping ReviewPreprint
Ziesel, A., Reeves, J. T. H., Mallidou, A. A., Newton, L. J., Rhodes, R. E., Zhang, J., Paterson, T. S. E., & Jabbari, H. (2024) · bioRxiv (Cold Spring Harbor Laboratory) · doi:10.1101/2024.10.29.620898 · Cited by 2
Computational tools for geroscience
Kruempel, J. C. P., Howington, M. B., & Leiser, S. F. (2019) · Translational Medicine of Aging · doi:10.1016/j.tma.2019.11.004 · Cited by 1
Genetik und Epigenetik des Alterns
Menzel, A., & Weber, B. (2022) · Springer eBooks · doi:10.1007/978-3-662-61417-4_10 · Cited by 1
Traces of Life’s Experiences: Epigenetics (DNA methylation) in Forensics
Ghai, M., Evans, D. L., & Joshi, S. V. (2019) · Springer eBooks · doi:10.1007/978-3-319-55530-0_14 · Cited by 1
DNA Methylation Clocks in Age-related Disease
Fransquet, P., Wrigglesworth, J., & Ryan, J. L. (2022) · Elsevier eBooks · doi:10.1016/b978-0-323-91909-8.00011-6 · Cited by 1
Cell Level- Modeling of Aging and Rejuvenation
Koptyug, A. V., Суховей, Ю. Г., Костоломова, Е. Г., Unger, I., & Va, K. (2023) · OBM Geriatrics · doi:10.21926/obm.geriatr.2304263 · Cited by 1
GraphAge: Unleashing the power of graph neural network to decode epigenetic aging
Ahmed, S. S., Shabab, N., Samee, M. A. H., & Rahman, M. S. (2025) · PNAS Nexus · doi:10.1093/pnasnexus/pgaf177 · Cited by 3
Methylation and algorithms in biological aging: a scoping review
Ziesel, A., Reeves, J. T. H., Mallidou, A. A., Newton, L. J., Rhodes, R. E., Zhang, J., Paterson, T. S. E., & Jabbari, H. (2025) · Frontiers in Aging · doi:10.3389/fragi.2025.1682873
Poggiali, B., Børsting, C., Kampmann, M., Wiuf, M., Kelager, A., Jepsen, A. H., Vidaki, A., Tfelt‐Hansen, J., & Andersen, J. D. (2026) · Forensic Science International Genetics · doi:10.1016/j.fsigen.2026.103438 · Cited by 2
Badell, I., Hewett, L., Stotesbury, T. E., Forbes, S. L., & Shafer, A. B. A. (2026) · Journal of Forensic Sciences · doi:10.1111/1556-4029.70304 · Cited by 2
Rayevskiy, S., Le, Q., Nguyen, J., Chen, S., & Castellani, C. A. (2026) · Bioinformatics and Biology Insights · doi:10.1177/11779322261433665 · Cited by 3
Clock-like mutational signatures: Linking ageing to endogenous cancer risk
Mills, C., Niedźwiedź, W., & Houlston, R. S. (2026) · Ageing Research Reviews · doi:10.1016/j.arr.2026.103147 · Cited by 1
Functional, molecular, and digital measurements of biological age
Cheema, B. S., Boztepe, B., Awofolaju, M., Hubbard, M. S., Marcus, W. B., Palella, F. J., Abdel‐Mohsen, M., Liebovitz, D., Gill, M. K., Cotton, R. J., et al. (2026) · Journal of Clinical Investigation · doi:10.1172/jci205777 · Cited by 1
Report Neuroanatomical Assessment of Biological Maturity
Brown, T. T., Kuperman, J. M., Chung, Y., Erhart, M. J., McCabe, C. J., Venkatraman, V. K., Akshoomoff, N., Amaral, D. G., Bloss, C. S., Ernst, T. M., et al. (2012) · Cited by 1
Epigenetic Changes in Aging and Modulation by Dietary Nutrients
Tripathi, S. S. (2018) · Springer eBooks · doi:10.1007/978-981-13-1699-9_16 · Cited by 1
Khan, N., Bavle, R. M., Makarla, S., Konda, P., Amulya, S. R., & Hosthor, S. S. (2019) · Journal of Forensic Dental Sciences · doi:10.4103/jfo.jfds_29_19 · Cited by 1
How Justified is the Assumption of Programmed Aging in Reminiscence of Weismann’s Theories?
Winterhalter, P. R., & Simm, A. (2022) · Biochemistry (Moscow) · doi:10.1134/s0006297922010047 · Cited by 1
Fluorescence imaging of epigenetic genome modifications
Moshareva, M. A., Lukyanov, K. A., & Putlyaeva, L. V. (2022) · Biochemical and Biophysical Research Communications · doi:10.1016/j.bbrc.2022.07.014 · Cited by 1
Forensic applications of epigenetic (DNA methylation) markers through NGS
Ghai, M. (2024) · Elsevier eBooks · doi:10.1016/b978-0-323-99144-5.00013-5 · Cited by 1
Methylation‐based markers for the estimation of age in African cheetah, Acinonyx jubatus
Clercq, L. L., Kotzé, A., Grobler, J. P., & Dalton, D. L. (2024) · Molecular Ecology Resources · doi:10.1111/1755-0998.13940 · Cited by 1
Specifics of determination of human biological age by blood samples using epigenetic markers
Kipen, V. N., Aryna, B., Добыш, О. И., Ol’ga, Z., Bulgak, A. A., & Lemesh, V. A. (2024) · Annals of Cytology and Pathology · doi:10.17352/acp.000030 · Cited by 1
Partial Cell Reprogramming as a Way to Revitalize Living Systems
Shorokhova, M. (2024) · Cell and Tissue Biology · doi:10.1134/s1990519x23700104 · Cited by 1
Personalized epigenetics of aging
Maugeri, A., Barchitta, M., Favara, G., Lio, R. M. S., & Agodi, A. (2024) · Elsevier eBooks · doi:10.1016/b978-0-443-23802-4.00016-8 · Cited by 1
Biological Age Can Be Moved in Both Directions
Muradian, K. K., & Fraifeld, V. E. (2024) · Healthy ageing and longevity · doi:10.1007/978-3-031-64995-0_11 · Cited by 1
Shimozuru, M., Nakamura, S., Yamazaki, J., Yanagawa, Y., Tamatani, H., Kuroe, M., Yamazaki, K., Koike, S., Goto, Y., Naganuma, T., et al. (2025) · Ecology and Evolution · doi:10.1002/ece3.71424 · Cited by 2
Epigenetic clocks of female reproductive system aging: Current application and future prospects
Lin, J., Chen, Y., Wang, S., Zhang, Y., Huang, H.-S., & Zhang, X.-Q. (2025) · World Journal of Obstetrics and Gynecology · doi:10.5317/wjog.v14.i2.108149 · Cited by 1
The evolution of methodology in biochemical age estimation
Zapico, S. C., Stone‐Gordon, R., & Adserias‐Garriga, J. (2019) · Elsevier eBooks · doi:10.1016/b978-0-12-814491-6.00013-3 · Cited by 1
Age estimation based on molecular biology approaches
Zapico, S. C., Thomas, C., & Zoppis, S. (2019) · Elsevier eBooks · doi:10.1016/b978-0-12-814491-6.00015-7 · Cited by 1
Computational approaches for the systematic analysis of aging-associated molecular alterations
Debès, C., Leote, A. C., & Beyer, A. (2018) · Drug Discovery Today Disease Models · doi:10.1016/j.ddmod.2019.03.003 · Cited by 1
Estimation de l’âge médicolégal grâce à l’étude de la méthylation de l’ADN : revue de la littérature
Bacquet, J., Magdinier, F., Léonetti, G., Bartoli, C., Chiaroni, J., Tuchtan, L., & Piercecchi‐Marti, M. (2019) · La Revue de Médecine Légale · doi:10.1016/j.medleg.2019.07.001 · Cited by 1
Utility and Possibility of Next-Generation Sequencing in Forensic DNA Typing
Nema, V. (2020) · Springer eBooks · doi:10.1007/978-981-15-6655-4_24 · Cited by 1
Nutrition, epigenetics and ageing
McKay, J. A., & Wakeling, L. A. (2015) · Wiley eBooks · doi:10.1002/9781118823408.ch3 · Cited by 1
Johnson, N. D. (2022) · Digital Archive @ GSU · doi:10.57709/8559272 · Cited by 1
The Age Factor in the Treatment of Glioblastoma
Clark, S. W. (2016) · JAMA Neurology · doi:10.1001/jamaneurol.2016.1331 · Cited by 1
Blueberries and Blood: Aging Research Goes from Great Science to Snake Oil
LeMieux, J. (2022) · GEN Biotechnology · doi:10.1089/genbio.2022.29013.jlm · Cited by 1
Tracking single cell evolution via clock-like chromatin accessibilityPreprint
Xiao, Y., Jin, W., Ju, L., Fu, J., Wang, G., Yu, M., Chen, F., Qian, K., Wang, X., & Zhang, Y. (2022) · bioRxiv (Cold Spring Harbor Laboratory) · doi:10.1101/2022.05.12.491736 · Cited by 1
Dna Methylation as a Powerful Tool to Investigate the Biology and Pathology of Aging
Coppedè, F. (2022) · Epigenomics · doi:10.2217/epi-2023-0011 · Cited by 1
Qi, H., Lim, Q. L., Kinoshita, K., Nakajima, N., & Inoue‐Murayama, M. (2023) · doi:10.22541/au.168440591.11110158/v1 · Cited by 1
Deng, W. Q., Pigeyre, M., Azab, S. M., Wilson, S. L., Campbell, N., Cawte, N., Morrison, K. M., Atkinson, S. A., Subbarao, P., Turvey, S. E., et al. (2024) · Research Square · doi:10.21203/rs.3.rs-3997065/v1 · Cited by 1
The Latent Aging of CellsPreprint
Niimi, P., Gould, V., Thrush, K., & Levine, M. E. (2024) · bioRxiv (Cold Spring Harbor Laboratory) · doi:10.1101/2024.05.28.596284 · Cited by 1
Epigenetic Reprogramming of Aging: Reversing the Clock for Regenerative MedicinePreprint
Odah, M. (2024) · Preprints.org · doi:10.20944/preprints202408.1619.v1 · Cited by 1
Cost-effective solutions for high-throughput enzymatic DNA methylation sequencingPreprint
Longtin, A., Watowich, M. M., Sadoughi, B., Petersen, R. M., Brosnan, S. F., Buetow, K. H., Cai, Q., Gurven, M., Highland, H. M., Huang, Y.-T., et al. (2024) · bioRxiv (Cold Spring Harbor Laboratory) · doi:10.1101/2024.09.09.612068 · Cited by 1
Guo, T., Dang, P., Fang, Y., Zhu, H., Wang, X., Wang, J., Ma, A., Ma, Q., Cao, S., & Zhang, C. (2026) · bioRxiv (Cold Spring Harbor Laboratory) · doi:10.64898/2026.01.30.702880 · Cited by 1
Contributos da Epigenética no âmbito da Medicina Legal
de SoutoSantos, R. T. (2013) · Portuguese National Funding Agency for Science, Research and Technology (RCAAP Project by FCT) · doi:10.34626/zz0h-qt21
Sleepphysiology and homeostasis
Shaw, P. J., Tafti, M., & Thorpy, M. J. (2013) · Cambridge University Press eBooks · doi:10.1017/cbo9781139649469.016
Joseph, G. J. (2013) · D-Scholarship@Pitt (University of Pittsburgh)
Methods for Identifying Pathway Epistasis and the Effects of Aging on the Human Methylome
Hannum, G. (2012) · eScholarship (California Digital Library)
Analysis of age-related CpGs for forensic purpose in Chinese Han population
Huang, Y., Yan, J., Zhuk, H., Fu, X., & Hou, Y. (2015) · Forensic science international. Genetics supplement series · doi:10.1016/j.fsigss.2015.09.060
Silva, D. S. B. S. (2015) · Americanae (AECID Library)
Cho, S., Seo, H. J., Lee, J., Ha, H., & Lee, S. D. (2016) · Korean Journal of Legal Medicine · doi:10.7580/kjlm.2016.40.2.44
Cancer Stem Cell Dynamics and Regulation
Myat, H. S., & Sehl, M. E. (2015) · Stem cells and cancer stem cells · doi:10.1007/978-94-017-7233-4_7
Self-citationEissenberg, J. C. (2016) · Elsevier eBooks · doi:10.1016/b978-0-12-803239-8.00009-0
Thomas, C., & Zapico, S. C. (2017) · CRC Press eBooks · doi:10.1201/9781315371382-28
Kremer, K., Fritzsch, S., & Stahl, F. (2017) · Chemie in unserer Zeit · doi:10.1002/ciuz.201700728
Vaitkienė, P. (2013) · Laba (Lietuvos akademinių bibliotekų direktorių asociacija)
Traces of Life’s Experiences: Epigenetics (DNA methylation) in Forensics
Ghai, M., Evans, D. L., & Joshi, S. V. (2017) · Springer eBooks · doi:10.1007/978-3-319-31143-2_14-1
Antunes, J. (2017) · FIU - Digital Commons (Florida International University) · doi:10.25148/etd.fidc006582
Statistical Inference for the Investigation of Cell-Type Heterogeneity in DNA Methylation Data
Kennedy, D. W. (1905) · Queensland University of Technology · doi:10.5204/thesis.eprints.128080
Serelaxin-vermittelte Inhibition von Fibroblastenaktivierung bei renaler Fibrogenese
Hesse, F. (2019) · eDiss (Georg-August-Universität Göttingen) · doi:10.53846/goediss-7336
Epigenomic reprogramming of caloric restriction on aging
Ribarič, S. (2019) · Nutritional Epigenomics · doi:10.1016/b978-0-12-816843-1.00016-3
Antunes, J., & McCord, B. R. (2019) · Royal Society of Chemistry eBooks · doi:10.1039/9781788016117-00253
Forensic Application of DNA Methylation in Age- Prediction
Theyab, A. (2019) · Forensic Science & Addiction Research · doi:10.31031/fsar.2019.05.000612
DNA Methylation Methods for Donor Age Prediction Using Touch DNA
Neverett, E. R. (2019) · Digital Commons - New Heaven (University of New Haven)
Levine, M. E., McDevitt, R. A., Meer, M. V., Perdue, K. A., Francesco, A. D., Meade, T., Farrell, C. P., Thrush, K., Wang, M., Dunn, C., et al. (2020) · bioRxiv (Cold Spring Harbor Laboratory) · doi:10.1101/2020.05.13.094292
Molecular and Epigenetic Clocks of Aging
Raj, S. M., & Lussier, A. A. (2019) · Springer eBooks · doi:10.1007/978-3-319-69892-2_725-2
Franz, C. E., Hatton, S. N., Elman, J. A., Warren, T. S., Gillespie, N. A., Whitsel, N. A., Puckett, O. K., Dale, A. M., Eyler, L. T., Fennema‐Notestine, C., et al. (2020) · bioRxiv (Cold Spring Harbor Laboratory) · doi:10.1101/2020.11.02.362780
Sequential Advancements of DNA Profiling: An Overview of Complete Arena
Nigam, K., Srivastava, A., Sahoo, S., Dubey, I. P., Tripathi, I. P., & Shrivastava, P. (2020) · Springer eBooks · doi:10.1007/978-981-15-6655-4_3
Marsellach, X. (2021) · Preprints.org · doi:10.20944/preprints202012.0506.v2
Amplification of the epigenetic (gestational) age acceleration signalPreprint
Lee, Y., & Bohlin, J. (2021) · bioRxiv (Cold Spring Harbor Laboratory) · doi:10.1101/2021.02.02.429312
Nurses’ Preferences of Single or Double Checking of Drug Administration: A Focus Group Study
Dioso, R. I. (2020) · Biomedical Journal of Scientific & Technical Research · doi:10.26717/bjstr.2020.24.004081
Preparation of A Polyclonal Antibody Against the Non-Structural Protein, NSS of SFTSV
Li, Y.-G. (2020) · Biomedical Journal of Scientific & Technical Research · doi:10.26717/bjstr.2020.24.004113
Development of DNA-Based Vaccine Towards the Predominant Dengue Virus Serotypes in Saudi Arabia
Abdelkader, H. S. (2019) · Biomedical Journal of Scientific & Technical Research · doi:10.26717/bjstr.2019.24.003990
Gene Expression in Children with Obstructive Sleep Apnea: A Pilot Study
Ricci, G. (2019) · Biomedical Journal of Scientific & Technical Research · doi:10.26717/bjstr.2019.24.003986
Guan, H. (2021) · Biomedical Journal of Scientific & Technical Research · doi:10.26717/bjstr.2021.34.005518
HIPPOCAMPAL DNA METHYLATION, DNAm AGE AND SPATIAL MEMORY PERFORMANCE IN YOUNG AND OLD RATSPreprint
Chiavellini, P., Lehmann, M., Canatelli-Mallat, M., Zoller, J. A., Hereñú, C. B., Morel, G. R., Horvath, S., & Goya, R. G. (2021) · bioRxiv (Cold Spring Harbor Laboratory) · doi:10.1101/2021.05.07.443204
Self-citationSpecifics of Determination of Human Biological Age by Blood Samples Using Epigenetic MarkersPreprint
Kipen, V. N., Bahdanava, M. V., Буракова, А. А., Добыш, О. И., Zotova, O. V., Bulgak, A. A., & Lemesh, V. A. (2021) · Research Square · doi:10.21203/rs.3.rs-288265/v1
Aging-associated changes in metabolic regulation of epigenetic modifications and gene expression
Bheda, P. (2021) · Elsevier eBooks · doi:10.1016/b978-0-323-85652-2.00006-3
Post-zygotic Genetic Variation in Health and Disease
Razzaghian, H. R. (2013) · Uppsala University Publications (Uppsala University)
En torno al ingeniero canario don Agustín de Bethencourt y Molina
Álvarez, A. R. (1961) · Dialnet (Universidad de la Rioja)
Существуют ли доказательства в пользу субтеломерно-теломерной теории старения?
Libertini, G., Shubernetskaya, O. S., Corbi, G., & Ferrara, N. (2021) · Biochemistry (Moscow) · doi:10.31857/s0320972521120022
Molecular regulation of fetal brain development in pigs
Strawn, M. (2021) · MOspace Institutional Repository (University of Missouri) · doi:10.32469/10355/88112
Достижения и перспективы эпигенетических исследований древней ДНК
Zhur, K. V., Анатольевич, Т. В., & Прохорчук, Е. Б. (2021) · Biochemistry (Moscow) · doi:10.31857/s0320972521120058
Altern messen – Biomarker des Alterungsprozesses
Weber, B., Heddergott, C., Juchem, N., & Menzel, A. (2022) · Springer eBooks · doi:10.1007/978-3-662-61417-4_2
Metadata
- Authors
- Bocklandt, S., Lin, W., Sehl, M. E., Sánchez, F. J., Sinsheimer, J. S., Horvath, S., & Vilain, E.
- Affiliations
- University of California, Los Angeles (US)
- Corresponding author
- Vilain, Eric
- Venue
- PLoS ONE
- Publisher
- Public Library of Science (PLoS)
- Published
- 2011-06-22
- Volume
- 6
- Issue
- 6
- Pages
- e14821
- ISSN
- 1932-6203 (ISSN-L)
- PMC
- PMC3120753
- OpenAlex
- W2080644309
- Cited by
- 1,012
- References
- 22
- Citations by year
- 2026: 56 · 2025: 71 · 2024: 83 · 2023: 92 · 2022: 95 · 2021: 108 · 2020: 87 · 2019: 64 · 2018: 52 · 2017: 65 · 2016: 58 · 2015: 63 · 2014: 43 · 2013: 40 · 2012: 30
- FWCI
- 14.97
- Type
- journal article
- Language
- en
- Open access
- gold
- doi.org
- Locations
- PLoS ONE (publishedVersion, cc-by)
- PubMed Central (publishedVersion, cc-by)
- PubMed (publishedVersion)
- DOAJ (DOAJ: Directory of Open Access Journals) (submittedVersion, cc-by-sa)
- eScholarship (California Digital Library) (submittedVersion)
- Figshare (submittedVersion, cc-by)
- Topics
- Life Sciences › Biochemistry, Genetics and Molecular Biology › Molecular Biology › Epigenetics and DNA Methylation
- Life Sciences › Biochemistry, Genetics and Molecular Biology › Cell Biology › Telomeres, Telomerase, and Senescence
- Life Sciences › Biochemistry, Genetics and Molecular Biology › Genetics › Genetic Syndromes and Imprinting
- Keywords
- DNA methylation, age prediction, epigenetic clocks, saliva, EDARADD, NPTX2, promoter methylation, forensic age estimation, age-related disease risk
- MeSH terms
- Adolescent, Adult, Aged, Aging, Female, Humans, Male, Middle Aged, Models, Genetic, Saliva, Twins, Reproducibility of Results, DNA Probes, DNA Methylation, Oligonucleotide Array Sequence Analysis, Epigenesis, Genetic, Young Adult, Genetic Loci
About these checks
Registry, retraction, Cites and statistics results are computed, not judged, with one exception: a printed reference that no index lists is read once by a model before it counts as a citation error. Claims are extracted by a model and kept only when their quote appears verbatim in the text; each cited source is then checked, with a model’s help, for whether it says what the claim relies on. Those verdicts can be wrong — read the claim’s quote and the cited source before relying on one.
Statistics and arithmetic are recomputed, not judged.
Confidence bands are shown only for fields calibrated on our annotated test set. None is calibrated yet, so no band is shown.
What counts as a claim ›How we measure confidence ›How we check this ›
Are you an author, or do you see a problem with this page? Request a review
