

The DOI matches its Crossref record; 41 of the 42 references it cites were found in a registry or an index.
Role of Bcr1-Activated Genes Hwp1 and Hyr1 in Candida Albicans Oral Mucosal Biofilms and Neutrophil Evasion
Open accessAbstract
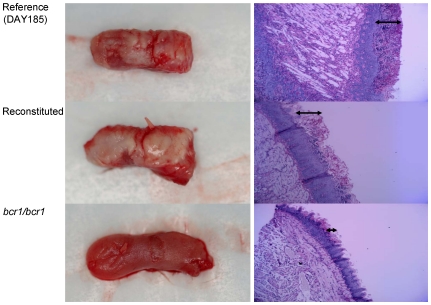
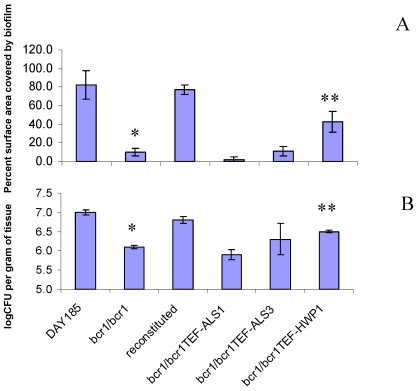
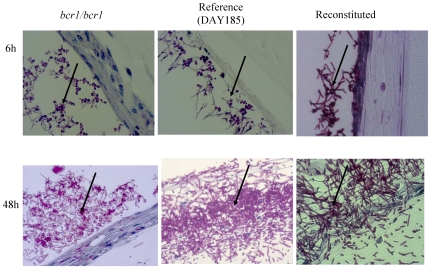
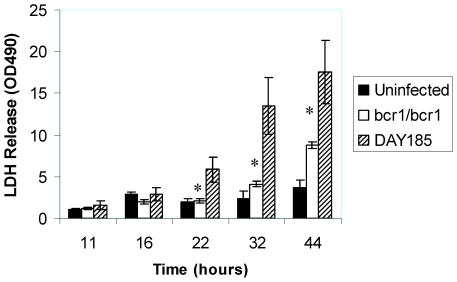
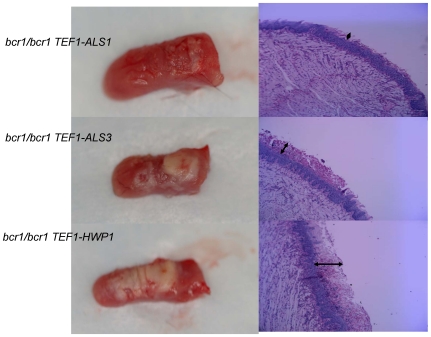
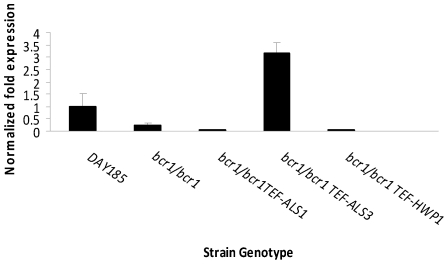
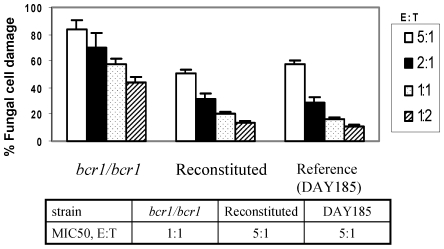
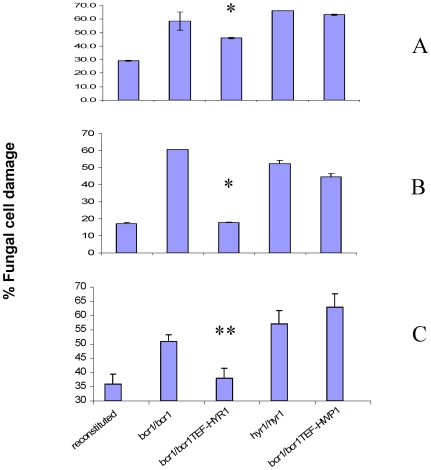
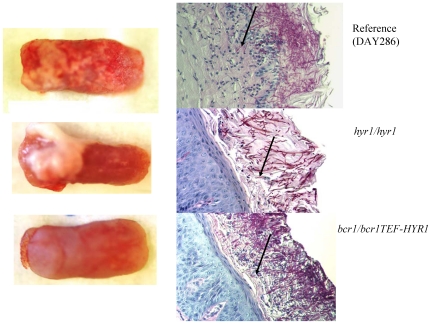
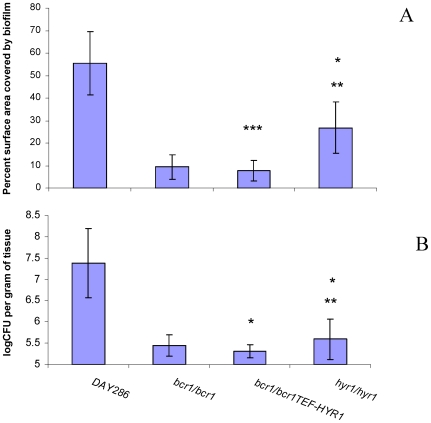
Candida albicans triggers recurrent infections of the oropharyngeal mucosa that result from biofilm growth. Prior studies have indicated that the transcription factor Bcr1 regulates biofilm formation in a catheter model, both in vitro and in vivo. We thus hypothesized that Bcr1 plays similar roles in the formation of oral mucosal biofilms and tested this hypothesis in a mouse model of oral infection. We found that a bcr1/bcr1 mutant did not form significant biofilm on the tongues of immunocompromised mice, in contrast to reference and reconstituted strains that formed pseudomembranes covering most of the tongue dorsal surface. Overexpression of HWP1, which specifies an epithelial adhesin that is under the transcriptional control of Bcr1, partly but significantly rescued the bcr1/bcr1 biofilm phenotype in vivo. Since HWP1 overexpression only partly reversed the biofilm phenotype, we investigated whether additional mechanisms, besides adhesin down-regulation, were responsible for the reduced virulence of this mutant. We discovered that the bcr1/bcr1 mutant was more susceptible to damage by human leukocytes when grown on plastic or on the surface of a human oral mucosa tissue analogue. Overexpression of HYR1, but not HWP1, significantly rescued this phenotype. Furthermore a hyr1/hyr1 mutant had significantly attenuated virulence in the mouse oral biofilm model of infection. These discoveries show that Bcr1 is critical for mucosal biofilm infection via regulation of epithelial cell adhesin and neutrophil function.
Overview
The claims and statistics of this paper haven’t been checked yet.
Run the check — free, no account needed. It reads the open-access text and checks the sources it cites.
Integrity signals
Registry
Cites
Statistics
Figures
Verification
Claims the paper makes
The claims and statistics of this paper haven’t been checked yet.
Run the check — free, no account needed. It reads the open-access text and checks the sources it cites.
Claims other papers make about this one
Each is checked against this paper’s own text: does it say what the citing paper says it does?
The source backs part of the claim, not all of it — or backs it for a different population, condition or comparison.
In the citing paper
“This hyphal-specific protein has previously been found to inhibit C. albicans killing by neutrophils and contribute to virulence in mouse models of both disseminated candidiasis and OPC, but its host cell receptor was unknown [24,25].”
From Candida albicans stimulates formation of a multi-receptor complex that mediates epithelial cell invasion during oropharyngeal infection (2023) · cites this paper as [25]
Experimental — accuracy not yet measuredThe cited source says what the claim attributes to it.
In the citing paper
“It has previously been found that Hyr1 also required for maximal virulence in an immunosuppressed mouse model of OPC [25].”
From Candida albicans stimulates formation of a multi-receptor complex that mediates epithelial cell invasion during oropharyngeal infection (2023) · cites this paper as [25]
Self-check
Percentages, sums and reported differences re-computed from the paper’s own numbers.
The self-check needs the paper’s full text.
Citations
Cites
Single-Step Method of RNA Isolation by Acid Guanidinium Thiocyanate–Phenol–Chloroform Extraction
Chomczynski, P., & Sacchi, N. (1987) · Analytical Biochemistry · doi:10.1006/abio.1987.9999 · Cited by 65,515
Adhesive and mammalian transglutaminase substrate properties of Candida albicans Hwp1.
Staab, J., Bradway, S. D., Fidel, P., & Sundstrom, P. (1999) · Science · doi:10.1126/science.283.5407.1535 · Cited by 683
Als3 Is a Candida albicans Invasin That Binds to Cadherins and Induces Endocytosis by Host Cells
Phan, Q. T., Myers, C. L., Fu, Y., Sheppard, D. C., Yeaman, M. R., Welch, W. H., Ibrahim, A. S., Edwards, J. E., & Filler, S. G. (2007) · PLoS Biology · doi:10.1371/journal.pbio.0050064 · Cited by 641
Critical Role of Bcr1-Dependent Adhesins in C. albicans Biofilm Formation In Vitro and In Vivo
Nobile, C. J., Andes, D. R., Nett, J. E., Smith, F. J., Yue, F., Phan, Q.-T., Edwards, J. E., Filler, S. G., & Mitchell, A. P. (2006) · PLoS Pathogens · doi:10.1371/journal.ppat.0020063 · Cited by 507
Self-citationRegulation of Cell-Surface Genes and Biofilm Formation by the C. albicans Transcription Factor Bcr1p
Nobile, C. J., & Mitchell, A. P. (2005) · Current Biology · doi:10.1016/j.cub.2005.05.047 · Cited by 464
Self-citationFradin, C., De Groot, P., MacCallum, D., Schaller, M., Klis, F., Odds, F. C., & Hube, B. (2005) · Molecular Microbiology · doi:10.1111/j.1365-2958.2005.04557.x · Cited by 455
Function of Candida albicans Adhesin Hwp1 in Biofilm Formation
Nobile, C. J., Nett, J. E., Andes, D. R., & Mitchell, A. P. (2006) · Eukaryotic Cell · doi:10.1128/ec.00194-06 · Cited by 395
Self-citationJesaitis, A. J., Franklin, M. J., Berglund, D. L., Sasaki, M., Lord, C. I., Bleazard, J. B., Duffy, J. E., Beyenal, H., & Lewandowski, Z. (2003) · The Journal of Immunology · doi:10.4049/jimmunol.171.8.4329 · Cited by 373
Ramage, G., VandeWalle, K., López-Ribot, J. L., & Wickes, B. L. (2002) · FEMS Microbiology Letters · doi:10.1016/s0378-1097(02)00853-4 · Cited by 334
Candida albicans forms biofilms on the vaginal mucosa
Harriott, M. M., Lilly, E. A., Rodriguez, T. E., Fidel, P. L., & Noverr, M. C. (2010) · Microbiology · doi:10.1099/mic.0.039354-0 · Cited by 301 · cited 3×
“with results in the mouse vaginal mucosa model [16], we found that the bcr1/bcr1 strain was deficient in forming a clinically visible mucosal biofilm on the tongues of immunocompromised mice in vivo (Fig.”
BackgroundResult
Cited by
Sorted by citations
Candida albicans Biofilms and Human Disease
Nobile, C. J., & Johnson, A. D. (2015) · Annual Review of Microbiology · doi:10.1146/annurev-micro-091014-104330 · Cited by 1,057
Candida albicans biofilms: development, regulation, and molecular mechanisms
Gulati, M., & Nobile, C. J. (2016) · Microbes and Infection · doi:10.1016/j.micinf.2016.01.002 · Cited by 738
Fanning, S., & Mitchell, A. P. (2012) · PLoS Pathogens · doi:10.1371/journal.ppat.1002585 · Cited by 465
Self-citationSchlecht, L. M., Peters, B. M., Krom, B. P., Freiberg, J. A., Hänsch, G. M., Filler, S. G., Jabra‐Rizk, M. A., & Shirtliff, M. E. (2014) · Microbiology · doi:10.1099/mic.0.083485-0 · Cited by 286
Candida albicans interactions with epithelial cells and mucosal immunity
Naglik, J. R., Moyes, D. L., Wächtler, B., & Hube, B. (2011) · Microbes and Infection · doi:10.1016/j.micinf.2011.06.009 · Cited by 277
Metadata
- Authors
- Dwivedi, P., Thompson, A., Xie, Z., Kashleva, H., Ganguly, S., Mitchell, A. P., & Dongari-Bagtzoglou, A.
- Affiliations
- University of Connecticut (US)
- Carnegie Mellon University (US)
- Venue
- PLoS ONE
- Publisher
- Public Library of Science (PLoS)
- Published
- 2011-01-25
- Volume
- 6
- Issue
- 1
- Pages
- e16218
- ISSN
- 1932-6203 (ISSN-L)
- PMC
- PMC3026825
- OpenAlex
- W2091452473
- Cited by
- 110
- References
- 42
- Citations by year
- 2026: 3 · 2025: 4 · 2024: 10 · 2023: 11 · 2022: 5 · 2021: 6 · 2020: 2 · 2019: 6 · 2018: 8 · 2017: 12 · 2016: 7 · 2015: 4 · 2014: 6 · 2013: 9 · 2012: 12
- FWCI
- 6.94
- Type
- journal article
- Language
- en
- Open access
- gold
- doi.org
- Locations
- PLoS ONE (publishedVersion, cc-by)
- PubMed Central (publishedVersion, cc-by)
- PubMed (publishedVersion)
- DOAJ (DOAJ: Directory of Open Access Journals) (submittedVersion, cc-by-sa)
- Funders
- National Institutes of Health
- National Institute of Allergy and Infectious Diseases (R01AI067703)
- National Institute of Dental and Craniofacial Research (R01DE013986)
- Topics
- Health Sciences › Medicine › Infectious Diseases › Antifungal resistance and susceptibility
- Life Sciences › Biochemistry, Genetics and Molecular Biology › Molecular Biology › Fungal and yeast genetics research
- Life Sciences › Biochemistry, Genetics and Molecular Biology › Molecular Biology › Bacterial biofilms and quorum sensing
- Keywords
- Candida albicans, HWP1, fungal virulence, oropharyngeal infection, immunodeficient mice, pseudomembranous candidiasis
- MeSH terms
- Animals, Candida albicans, Fungal Proteins, Membrane Glycoproteins, Mouth Mucosa, Neutrophils, Transcription Factors, Biofilms, Adhesins, Bacterial, Mice, Immune Evasion
About these checks
Registry, retraction, Cites and statistics results are computed, not judged, with one exception: a printed reference that no index lists is read once by a model before it counts as a citation error. Claims are extracted by a model and kept only when their quote appears verbatim in the text; each cited source is then checked, with a model’s help, for whether it says what the claim relies on. Those verdicts can be wrong — read the claim’s quote and the cited source before relying on one.
Statistics and arithmetic are recomputed, not judged.
Confidence bands are shown only for fields calibrated on our annotated test set. None is calibrated yet, so no band is shown.
What counts as a claim ›How we measure confidence ›How we check this ›
Are you an author, or do you see a problem with this page? Request a review
