

A Collaborative Brain-Computer Interface for Improving Human Performance
Open accessThe DOI matches its Crossref record; 44 of the 44 references it cites were found in a registry or an index.
Abstract
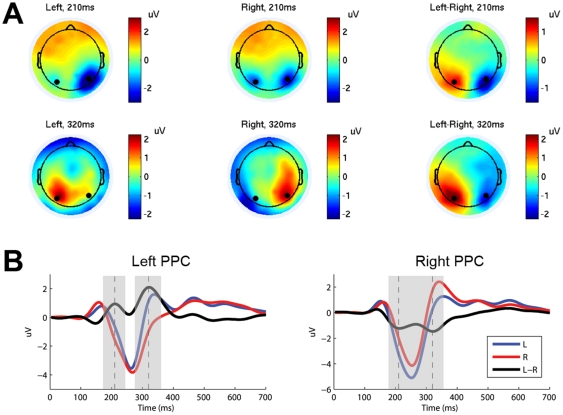
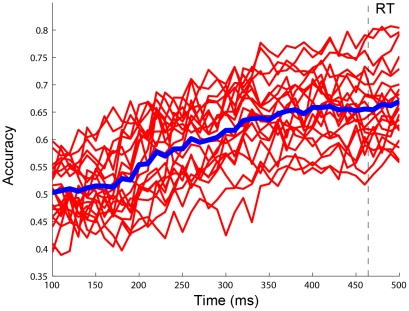
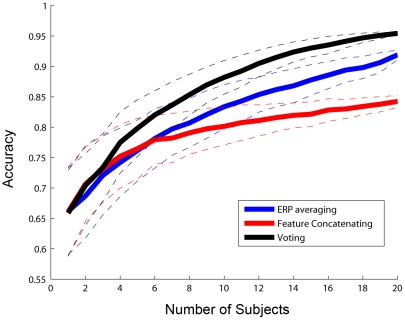
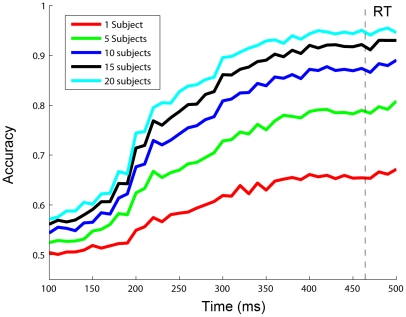
Electroencephalogram (EEG) based brain-computer interfaces (BCI) have been studied since the 1970s. Currently, the main focus of BCI research lies on the clinical use, which aims to provide a new communication channel to patients with motor disabilities to improve their quality of life. However, the BCI technology can also be used to improve human performance for normal healthy users. Although this application has been proposed for a long time, little progress has been made in real-world practices due to technical limits of EEG. To overcome the bottleneck of low single-user BCI performance, this study proposes a collaborative paradigm to improve overall BCI performance by integrating information from multiple users. To test the feasibility of a collaborative BCI, this study quantitatively compares the classification accuracies of collaborative and single-user BCI applied to the EEG data collected from 20 subjects in a movement-planning experiment. This study also explores three different methods for fusing and analyzing EEG data from multiple subjects: (1) Event-related potentials (ERP) averaging, (2) Feature concatenating, and (3) Voting. In a demonstration system using the Voting method, the classification accuracy of predicting movement directions (reaching left vs. reaching right) was enhanced substantially from 66% to 80%, 88%, 93%, and 95% as the numbers of subjects increased from 1 to 5, 10, 15, and 20, respectively. Furthermore, the decision of reaching direction could be made around 100-250 ms earlier than the subject's actual motor response by decoding the ERP activities arising mainly from the posterior parietal cortex (PPC), which are related to the processing of visuomotor transmission. Taken together, these results suggest that a collaborative BCI can effectively fuse brain activities of a group of people to improve the overall performance of natural human behavior.
Overview
The claims and statistics of this paper haven’t been checked yet.
Free: it reads the open-access text and checks the first 5 claims that cite a source we can check. Create a free account to check every claim.
Integrity signals
Registry
Cites
Statistics
Figures
Verification
Claims the paper makes
The claims and statistics of this paper haven’t been checked yet.
Free: it reads the open-access text and checks the first 5 claims that cite a source we can check. Create a free account to check every claim.
Claims other papers make about this one
Each is checked against this paper’s own text: does it say what the citing paper says it does?
The cited source says what the claim attributes to it.
In the citing paper
“however, subjects performed the task on different days and no brain stimulation was used to convey information directly to subjects’ brains.”
From BrainNet: A Multi-Person Brain-to-Brain Interface for Direct Collaboration Between Brains (2019) · cites this paper as [23]
Experimental — accuracy not yet measuredThe cited source says what the claim attributes to it.
In the citing paper
“In humans, researchers have studied “collaborative BCIs” (rather than BBIs) that pool information from multiple human brains to improve performance in a delayed saccade-or-reach task23”
From BrainNet: A Multi-Person Brain-to-Brain Interface for Direct Collaboration Between Brains (2019) · cites this paper as [23]
Self-check
Percentages, sums and reported differences re-computed from the paper’s own numbers.
The self-check needs the paper’s full text.
Citations
Cites
Delorme, A., & Makeig, S. (2004) · Journal of Neuroscience Methods · doi:10.1016/j.jneumeth.2003.10.009 · Cited by 24,371 · cited 1×
“We used independent component analysis (ICA) as an unsupervised spatial filtering technique to remove artifacts arising from eye and muscle movements. For each subject, all trials were band-pass filtered (1–30 Hz), concatenated, and then decomposed using the EEGLAB toolbox”
Brain–computer interfaces for communication and control
Wolpaw, J. R., Birbaumer, N., McFarland, D. J., Pfurtscheller, G., & Vaughan, T. M. (2002) · Clinical Neurophysiology · doi:10.1016/s1388-2457(02)00057-3 · Cited by 7,927
(2005) · Cited by 5,977
A review of classification algorithms for EEG-based brain–computer interfaces
Lotte, F., Congedo, M., Lécuyer, A., Lamarche, F., & Arnaldi, B. (2007) · Journal of Neural Engineering · doi:10.1088/1741-2560/4/2/r01 · Cited by 2,665 · cited 2×
“Recently, following the wide employment of machine learning techniques in BCI studies, feature combination methods have been introduced in EEG classification [5,27].”
Optimal spatial filtering of single trial EEG during imagined hand movement
Ramoser, H., Muller-Gerking, J., & Pfurtscheller, G. (2000) · IEEE Transactions on Rehabilitation Engineering · doi:10.1109/86.895946 · Cited by 2,457 · cited 1×
“Firstly, for more electrodes over the PPC area, spatial filtering techniques can be applied to improve the SNR through removing task irrelevant activities [35,36].”
Brain-computer interface technology: a review of the first international meeting
Wolpaw, J. R., Birbaumer, N., Heetderks, W. J., McFarland, D. J., Peckham, P. H., Schalk, G., Donchin, E., Quatrano, L. A., Robinson, C. J., & Vaughan, T. M. (2000) · IEEE Transactions on Rehabilitation Engineering · doi:10.1109/tre.2000.847807 · Cited by 2,324 · cited 2×
“On one hand, some researchers sought to develop biofeedback techniques that would improve performance of military personnel engaged in tasks involving high mental loads [7].”
Pattern Classification (2nd Edition)
Duda, R. O., Hart, P. E., & Stork, D. G. (2000) · Wiley-Interscience eBooks · Cited by 2,070
Brain–machine interfaces: past, present and future
Lebedev, M. A., & Nicolelis, M. A. L. (2006) · Trends in Neurosciences · doi:10.1016/j.tins.2006.07.004 · Cited by 1,875
Thut, G., Nietzel, A., Brandt, S. A., & Pascual-Leone, A. (2006) · The Journal of Neuroscience · doi:10.1523/jneurosci.0875-06.2006 · Cited by 1,494
The Wisdom of Teams: Creating the High-Performance Organization
(1997) · Quality Management Journal · doi:10.1080/10686967.1997.11918781 · Cited by 1,493
Cited by
Brain-Machine Interfaces: From Basic Science to Neuroprostheses and Neurorehabilitation
Lebedev, M. A., & Nicolelis, M. A. L. (2017) · Physiological Reviews · doi:10.1152/physrev.00027.2016 · Cited by 653
“These include a BMI for spacecraft navigation controlled by two users (644), BMIs for group decision making (217, 645, 883), and a cooperative BMI for movement planning (841).”
BackgroundVisual and Auditory Brain–Computer Interfaces
Gao, S., Wang, Y., Gao, X., & Hong, B. (2014) · IEEE Transactions on Biomedical Engineering · doi:10.1109/tbme.2014.2300164 · Cited by 449
Self-citationA HIGH-SPEED BRAIN SPELLER USING STEADY-STATE VISUAL EVOKED POTENTIALS
NAKANISHI, M., WANG, Y., WANG, Y.-T., MITSUKURA, Y., & JUNG, T.-P. (2014) · International Journal of Neural Systems · doi:10.1142/s0129065714500191 · Cited by 369
Self-citationIntra- and Inter-subject Variability in EEG-Based Sensorimotor Brain Computer Interface: A Review
Saha, S., & Baumert, M. (2020) · Frontiers in Computational Neuroscience · doi:10.3389/fncom.2019.00087 · Cited by 325
“Brain computer interfaces (BCI) exploiting sensorimotor rhythms (SMR) have shown promise for both the improvement of motor performance in normal subjects and the rehabilitation of motor function in patients (Dobkin, 2007; Wang and Jung, 2011).”
BackgroundInterface, interaction, and intelligence in generalized brain–computer interfaces
Gao, X., Wang, Y., Chen, X., & Gao, S. (2021) · Trends in Cognitive Sciences · doi:10.1016/j.tics.2021.04.003 · Cited by 304
Self-citation
Metadata
- Authors
- Wang, Y., & Jung, T.-P.
- Affiliations
- University of California San Diego (US)
- Corresponding author
- Wang, Yijun
- Jung, Tzyy-Ping
- Venue
- PLoS ONE
- Publisher
- Public Library of Science (PLoS)
- Published
- 2011-05-31
- Volume
- 6
- Issue
- 5
- Pages
- e20422
- ISSN
- 1932-6203 (ISSN-L)
- PMC
- PMC3105048
- OpenAlex
- W2137916148
- Cited by
- 147
- References
- 41
- Citations by year
- 2026: 2 · 2025: 9 · 2024: 3 · 2023: 10 · 2022: 11 · 2021: 13 · 2020: 9 · 2019: 8 · 2018: 8 · 2017: 12 · 2016: 11 · 2015: 14 · 2014: 13 · 2013: 14 · 2012: 9
- FWCI
- 6.00
- Type
- journal article
- Language
- en
- Open access
- gold
- doi.org
- Locations
- PLoS ONE (publishedVersion, cc-by)
- PubMed Central (publishedVersion, cc-by)
- PubMed (publishedVersion)
- DOAJ (DOAJ: Directory of Open Access Journals) (submittedVersion, cc-by-sa)
- eScholarship (California Digital Library) (submittedVersion)
- eScholarship (California Digital Library) (submittedVersion, cc-by)
- Funders
- Army Research Laboratory (W911-NF-10-2-0022, Cooperative Agreement Number W911NF-10-2-0022, W911NF, W911NF-10)
- Topics
- Life Sciences › Neuroscience › Cognitive Neuroscience › EEG and Brain-Computer Interfaces
- Physical Sciences › Computer Science › Human-Computer Interaction › Gaze Tracking and Assistive Technology
- Physical Sciences › Engineering › Biomedical Engineering › Muscle activation and electromyography studies
- Keywords
- EEG, event-related potentials, voting classifier, feature concatenation, posterior parietal cortex, visuomotor processing, motor planning
- MeSH terms
- Adult, Brain, Electroencephalography, Evoked Potentials, Female, Humans, Male, Motor Activity, Signal Processing, Computer-Assisted, User-Computer Interface, Young Adult
About these checks
Registry, retraction, Cites and statistics results are computed, not judged, with one exception: a printed reference that no index lists is read once by a model before it counts as a citation error. Claims are extracted by a model and kept only when their quote appears verbatim in the text; each cited source is then checked, with a model’s help, for whether it says what the claim relies on. Those verdicts can be wrong — read the claim’s quote and the cited source before relying on one.
Statistics and arithmetic are recomputed, not judged.
Confidence bands are shown only for fields calibrated on our annotated test set. None is calibrated yet, so no band is shown.
What counts as a claim ›How we measure confidence ›How we check this ›
Are you an author, or do you see a problem with this page? Request a review
How to cite
Cite CoChat for the checks on this page, and the paper for its own findings.
- This page
- CoChat. (2026). Citation check: A Collaborative Brain-Computer Interface for Improving Human Performance. https://app.cochat.ai/papers/10.1371/journal.pone.0020422
- The paper
- Wang, Y., & Jung, T.-P. (2011). A Collaborative Brain-Computer Interface for Improving Human Performance. PLoS ONE. https://doi.org/10.1371/journal.pone.0020422
Data sources
Bibliographic data: Semantic Scholar, OpenAlex, Crossref.
Contains information from the Semantic Scholar Academic Graph Datasets, made available under the ODC Attribution License (ODC-BY 1.0).
Semantic Scholar’s data is described in: Kinney, R., et al. (2023). The Semantic Scholar Open Data Platform. arXiv:2301.10140.
