

The DOI matches its Crossref record; 84 of the 84 references it cites were found in a registry or an index.
STAT3 Activation in Skeletal Muscle Links Muscle Wasting and the Acute Phase Response in Cancer Cachexia
Open accessAbstract
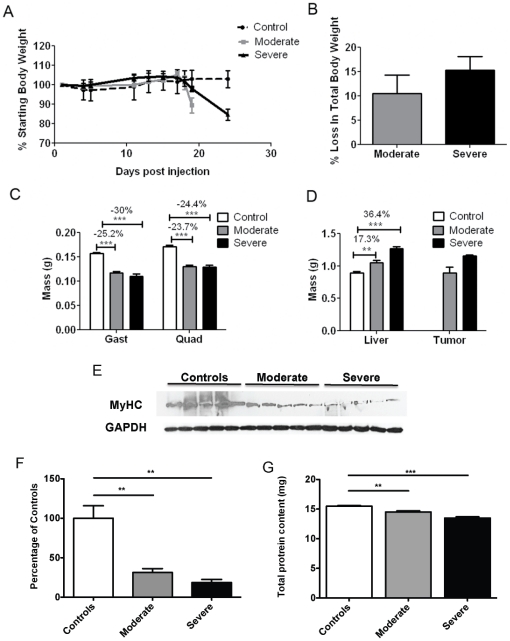
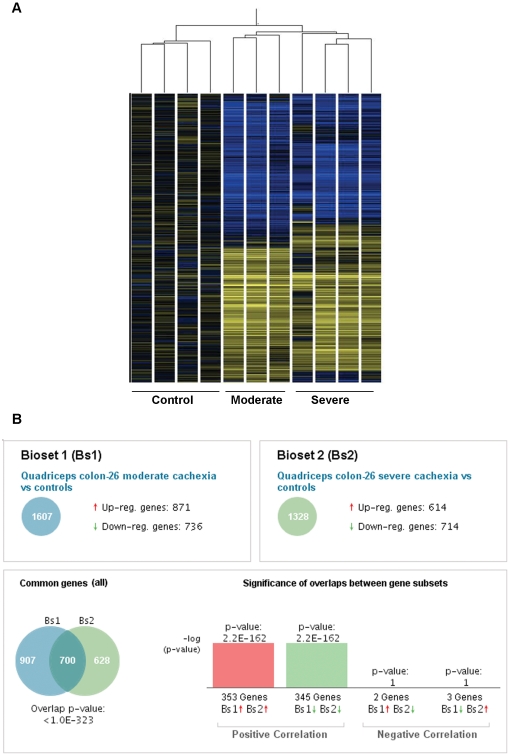
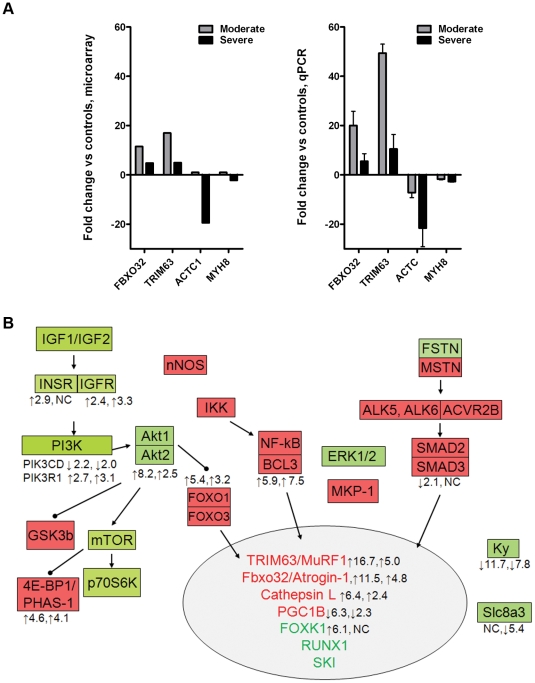
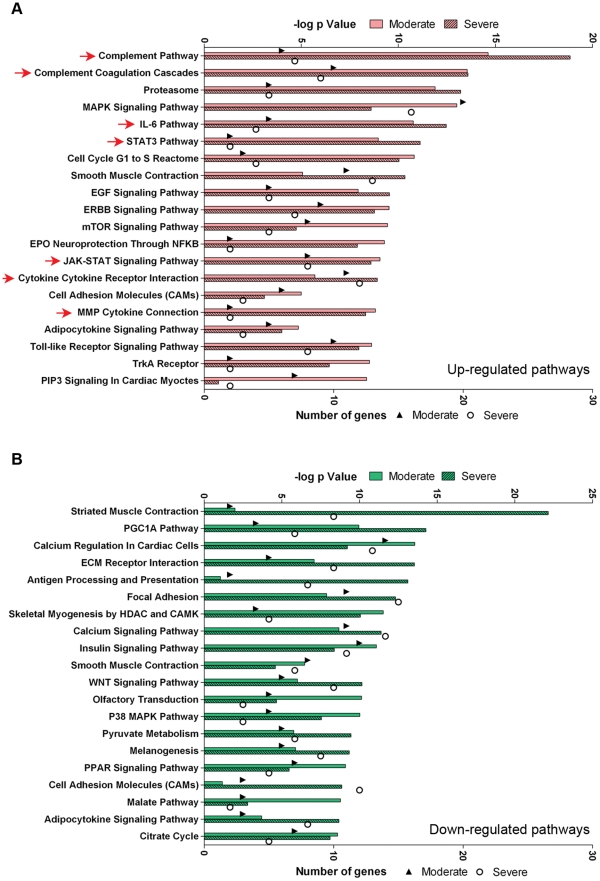
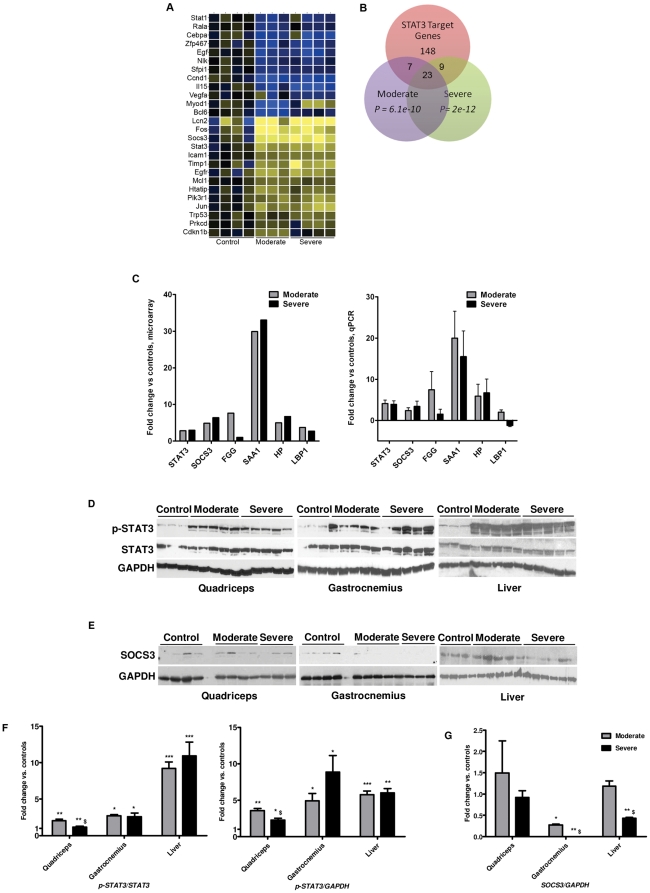
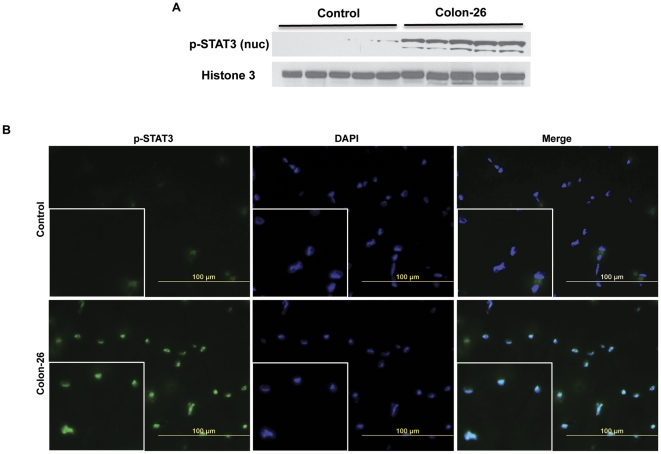
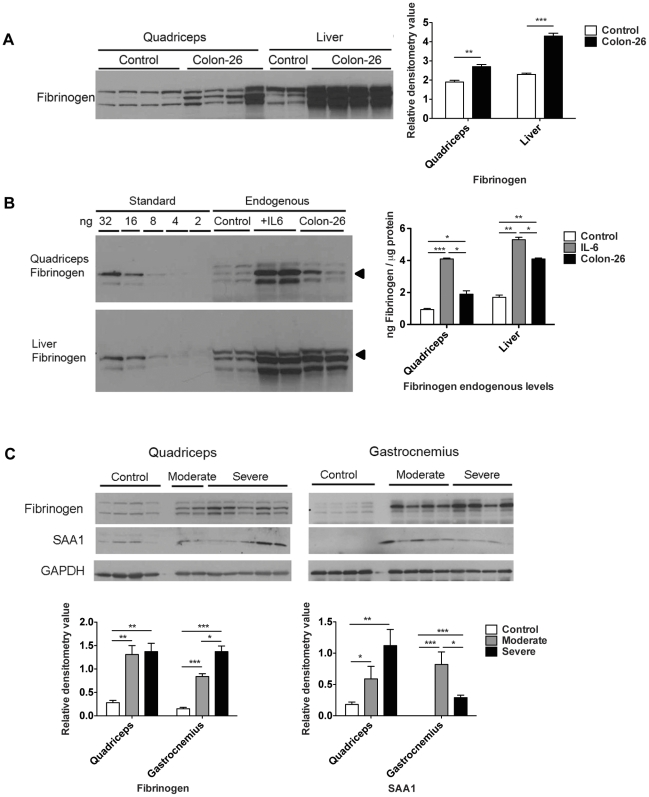
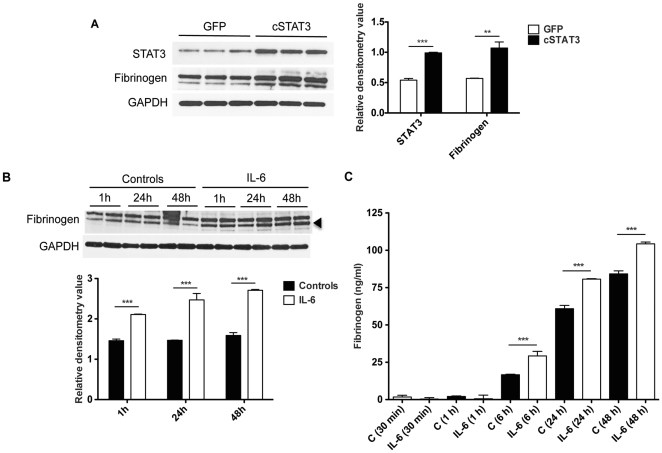
BACKGROUND: Cachexia, or weight loss despite adequate nutrition, significantly impairs quality of life and response to therapy in cancer patients. In cancer patients, skeletal muscle wasting, weight loss and mortality are all positively associated with increased serum cytokines, particularly Interleukin-6 (IL-6), and the presence of the acute phase response. Acute phase proteins, including fibrinogen and serum amyloid A (SAA) are synthesized by hepatocytes in response to IL-6 as part of the innate immune response. To gain insight into the relationships among these observations, we studied mice with moderate and severe Colon-26 (C26)-carcinoma cachexia. METHODOLOGY/PRINCIPAL FINDINGS: Moderate and severe C26 cachexia was associated with high serum IL-6 and IL-6 family cytokines and highly similar patterns of skeletal muscle gene expression. The top canonical pathways up-regulated in both were the complement/coagulation cascade, proteasome, MAPK signaling, and the IL-6 and STAT3 pathways. Cachexia was associated with increased muscle pY705-STAT3 and increased STAT3 localization in myonuclei. STAT3 target genes, including SOCS3 mRNA and acute phase response proteins, were highly induced in cachectic muscle. IL-6 treatment and STAT3 activation both also induced fibrinogen in cultured C2C12 myotubes. Quantitation of muscle versus liver fibrinogen and SAA protein levels indicates that muscle contributes a large fraction of serum acute phase proteins in cancer. CONCLUSIONS/SIGNIFICANCE: These results suggest that the STAT3 transcriptome is a major mechanism for wasting in cancer. Through IL-6/STAT3 activation, skeletal muscle is induced to synthesize acute phase proteins, thus establishing a molecular link between the observations of high IL-6, increased acute phase response proteins and muscle wasting in cancer. These results suggest a mechanism by which STAT3 might causally influence muscle wasting by altering the profile of genes expressed and translated in muscle such that amino acids liberated by increased proteolysis in cachexia are synthesized into acute phase proteins and exported into the blood.
Overview
The claims and statistics of this paper haven’t been checked yet.
Run the check — free, no account needed. It reads the open-access text and checks the sources it cites.
Integrity signals
Registry
Cites
Statistics
Figures
Verification
Claims the paper makes
The claims and statistics of this paper haven’t been checked yet.
Run the check — free, no account needed. It reads the open-access text and checks the sources it cites.
Claims other papers make about this one
Each is checked against this paper’s own text: does it say what the citing paper says it does?
The source backs part of the claim, not all of it — or backs it for a different population, condition or comparison.
In the citing paper
“While an acute increase in systemic IL‐6 promotes muscle growth and hypertrophy, its sustained elevation, as occurring in cancer or diabetes, causes muscle atrophy.”
From Sepsis induces interleukin 6, gp130/JAK2/STAT3, and muscle wasting (2022) · cites this paper as [15]
Experimental — accuracy not yet measuredThe source backs part of the claim, not all of it — or backs it for a different population, condition or comparison.
In the citing paper
“Our data are in accordance with previous reports showing that gp130 via the JAK/STAT pathway mediates muscle atrophy in a cancer cachexia mouse model. 15 , 27 , 28”
From Sepsis induces interleukin 6, gp130/JAK2/STAT3, and muscle wasting (2022) · cites this paper as [15]
Experimental — accuracy not yet measured
Self-check
Percentages, sums and reported differences re-computed from the paper’s own numbers.
The self-check needs the paper’s full text.
Citations
Cites
Analyzing real-time PCR data by the comparative CT method
Schmittgen, T. D., & Livak, K. J. (2008) · Nature Protocols · doi:10.1038/nprot.2008.73 · Cited by 26,190
Darnell, J. E., Kerr, L. M., & Stark, G. R. (1994) · Science · doi:10.1126/science.8197455 · Cited by 6,080 · cited 1×
“STAT3 is activated in part by phosphorylation at Y705, which induces dimerization, nuclear translocation and DNA binding [51,52].”
BackgroundRegulation of skeletal muscle mass in mice by a new TGF-p superfamily member
McPherron, A. C., Lawler, A. M., & Lee, S.-J. (1997) · Nature · doi:10.1038/387083a0 · Cited by 4,013
Identification of ubiquitin ligases required for skeletal muscle atrophy.
Bodine, S. C., Latres, E., Baumhueter, S., Lai, V. K.-M., Nunez, L., Clarke, B. A., Poueymirou, W. T., Panaro, F. J., Na, E., Dharmarajan, K., et al. (2001) · Science · doi:10.1126/science.1065874 · Cited by 3,521
Bromberg, J. F., Wrzeszczynska, M. H., Devgan, G., Zhao, Y., Pestell, R. G., Albanese, C., & Darnell, J. E. (1999) · Cell · doi:10.1016/s0092-8674(00)81959-5 · Cited by 2,790
Bodine, S. C., Stitt, T. N., Gonzalez, M., Kline, W. O., Stover, G. L., Bauerlein, R., Zlotchenko, E., Scrimgeour, A., Lawrence, J. C., Glass, D. J., et al. (2001) · Nature Cell Biology · doi:10.1038/ncb1101-1014 · Cited by 2,752
Chen, X., Han, X., Yuan, P., Fang, F., Huss, M., Vega, V. B., Wong, E., Orlov, Y. L., Zhang, W., Jiang, J., et al. (2008) · Cell · doi:10.1016/j.cell.2008.04.043 · Cited by 2,547
Evans, W., Morley, J., Argilés, J., Bales, C., Baracos, V., Guttridge, D., Jatoi, A., Kalantar-zadeh, K., Lochs, H., Mantovani, G., et al. (2008) · Clinical Nutrition · doi:10.1016/j.clnu.2008.06.013 · Cited by 2,341
Stitt, T. N., Drujan, D., Clarke, B. A., Panaro, F., Timofeyva, Y., Kline, W. O., Gonzalez, M., Yancopoulos, G. D., & Glass, D. J. (2004) · Molecular Cell · doi:10.1016/s1097-2765(04)00211-4 · Cited by 1,964
Atrogin-1, a muscle-specific F-box protein highly expressed during muscle atrophy
Gomes, M. D., Lecker, S. H., Jagoe, R. T., Navon, A., & Goldberg, A. L. (2001) · Proceedings of the National Academy of Sciences · doi:10.1073/pnas.251541198 · Cited by 1,774
Research works printed but not linked: 1
- JR Libonati, 2001, Brief muscle hypoperfusion/hyperemia: an ergogenic aid?, J Strength Cond Res, 15, 362
Cited by
Sorted by citations
Cancer Cachexia: Mediators, Signaling, and Metabolic Pathways
Fearon, K. C. H., Glass, D. J., & Guttridge, D. C. (2012) · Cell Metabolism · doi:10.1016/j.cmet.2012.06.011 · Cited by 1,244
Interleukin‐6 myokine signaling in skeletal muscle: a double‐edged sword?
Muñoz‐Cánoves, P., Scheele, C., Pedersen, B. K., & Serrano, A. L. (2013) · The FEBS Journal · doi:10.1111/febs.12338 · Cited by 774
IL-6 and related cytokines as the critical lynchpins between inflammation and cancer
Taniguchi, K., & Karin, M. (2014) · Seminars in Immunology · doi:10.1016/j.smim.2014.01.001 · Cited by 724
Understanding cachexia as a cancer metabolism syndrome
Porporato, P. E. (2016) · Oncogenesis · doi:10.1038/oncsis.2016.3 · Cited by 562
Role of Inflammation in Muscle Homeostasis and Myogenesis
Costamagna, D., Costelli, P., Sampaolesi, M., & Penna, F. (2015) · Mediators of Inflammation · doi:10.1155/2015/805172 · Cited by 554
Metadata
- Authors
- Bonetto, A., Aydogdu, T., Kunzevitzky, N., Guttridge, D. C., Khuri, S., Koniaris, L. G., & Zimmers, T. A.
- Affiliations
- University of Miami (US)
- Corresponding author
- Zimmers, Teresa A.
- Venue
- PLoS ONE
- Publisher
- Public Library of Science (PLoS)
- Published
- 2011-07-20
- Volume
- 6
- Issue
- 7
- Pages
- e22538
- ISSN
- 1932-6203 (ISSN-L)
- PMC
- PMC3140523
- OpenAlex
- W2052712443
- Cited by
- 348
- References
- 84
- Citations by year
- 2026: 17 · 2025: 24 · 2024: 16 · 2023: 21 · 2022: 17 · 2021: 30 · 2020: 38 · 2019: 28 · 2018: 38 · 2017: 23 · 2016: 20 · 2015: 21 · 2014: 23 · 2013: 19 · 2012: 11
- FWCI
- 7.15
- Type
- journal article
- Language
- en
- Open access
- gold
- doi.org
- Locations
- PLoS ONE (publishedVersion, cc-by)
- Europe PMC (PubMed Central) (publishedVersion, cc-by)
- PubMed Central (publishedVersion, cc-by)
- PubMed (publishedVersion)
- DOAJ (DOAJ: Directory of Open Access Journals) (submittedVersion, cc-by-sa)
- Figshare (submittedVersion, cc-by)
- Funders
- U.S. Department of Defense
- American Cancer Society
- University of Miami
- National Cancer Institute (CA122596, R01CA122596)
- National Institute of General Medical Sciences (R01GM092758)
- Topics
- Life Sciences › Biochemistry, Genetics and Molecular Biology › Molecular Biology › Muscle Physiology and Disorders
- Health Sciences › Medicine › Physiology (medical) › Nutrition and Health in Aging
- Life Sciences › Immunology and Microbiology › Immunology › Cytokine Signaling Pathways and Interactions
- Keywords
- cancer cachexia, STAT3 signaling, skeletal muscle atrophy, interleukin-6, acute phase response, acute phase proteins, fibrinogen, serum amyloid A, SOCS3, C26 colon carcinoma, muscle protein degradation, muscle transcriptome, IL-6 family cytokines
- MeSH terms
- Acute-Phase Reaction, Animals, Cachexia, Colonic Neoplasms, Female, Humans, Liver, Gene Expression Regulation, Neoplastic, Cytokines, Muscle, Skeletal, Cell Line, Tumor, STAT3 Transcription Factor, Mice, Transcriptome
About these checks
Registry, retraction, Cites and statistics results are computed, not judged, with one exception: a printed reference that no index lists is read once by a model before it counts as a citation error. Claims are extracted by a model and kept only when their quote appears verbatim in the text; each cited source is then checked, with a model’s help, for whether it says what the claim relies on. Those verdicts can be wrong — read the claim’s quote and the cited source before relying on one.
Statistics and arithmetic are recomputed, not judged.
Confidence bands are shown only for fields calibrated on our annotated test set. None is calibrated yet, so no band is shown.
What counts as a claim ›How we measure confidence ›How we check this ›
Are you an author, or do you see a problem with this page? Request a review
