

The DOI matches its Crossref record; 76 of the 76 references it cites were found in a registry or an index.
Intestinal Microbiota in Healthy Adults: Temporal Analysis Reveals Individual and Common Core and Relation to Intestinal Symptoms
Open accessAbstract
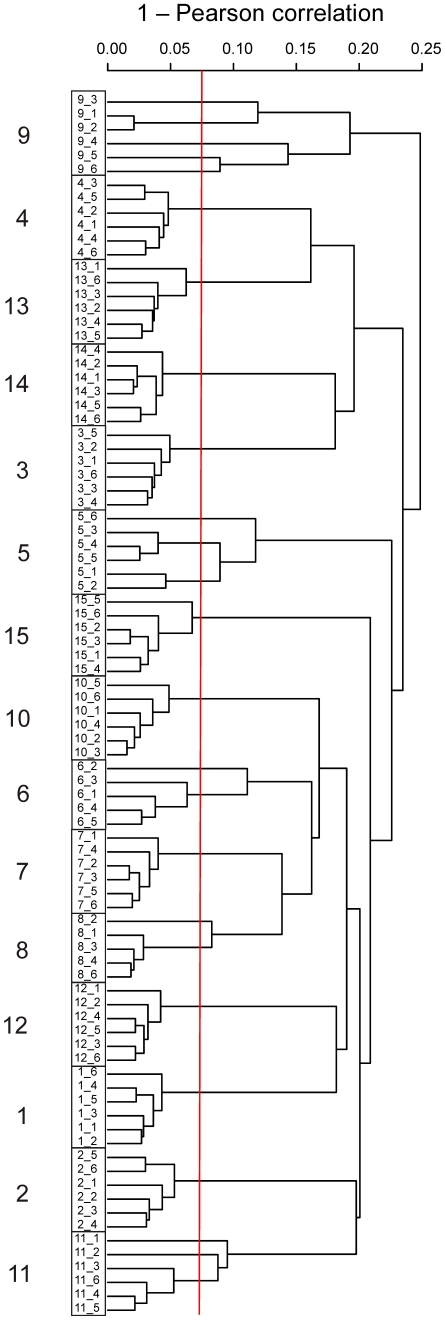
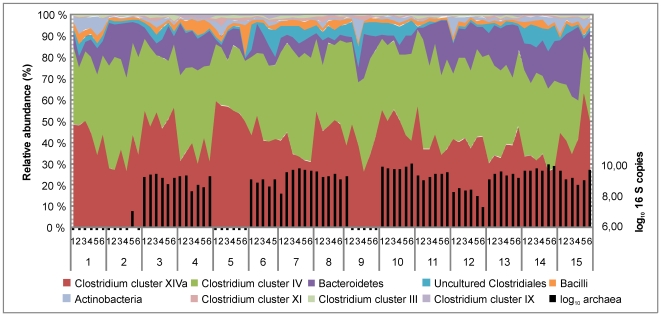
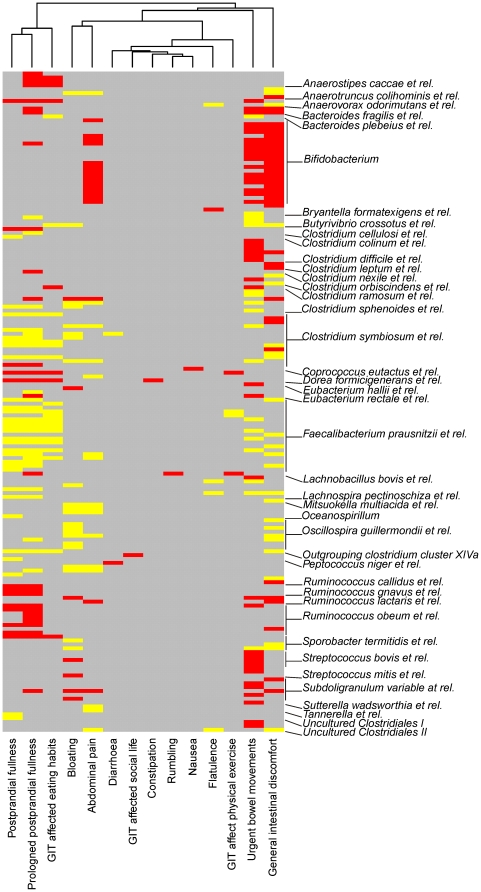
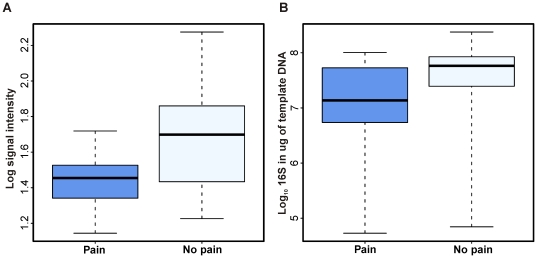
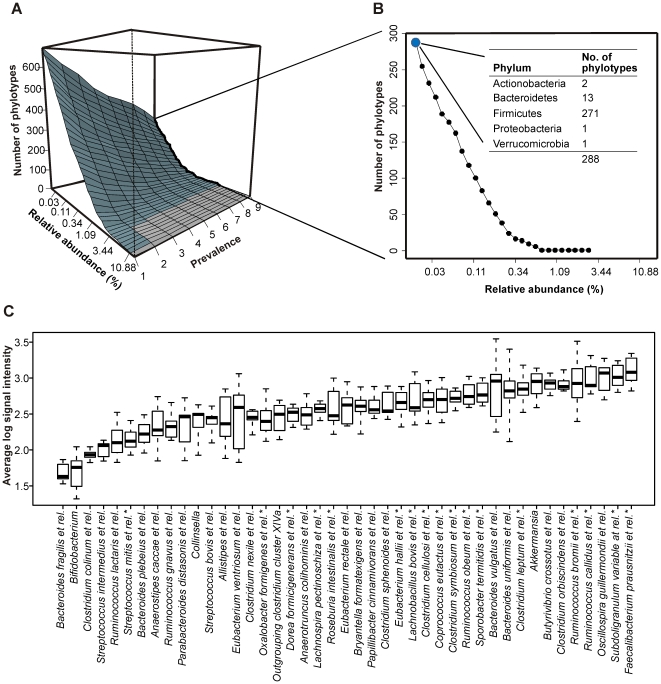
BACKGROUND: While our knowledge of the intestinal microbiota during disease is accumulating, basic information of the microbiota in healthy subjects is still scarce. The aim of this study was to characterize the intestinal microbiota of healthy adults and specifically address its temporal stability, core microbiota and relation with intestinal symptoms. We carried out a longitudinal study by following a set of 15 healthy Finnish subjects for seven weeks and regularly assessed their intestinal bacteria and archaea with the Human Intestinal Tract (HIT) Chip, a phylogenetic microarray, in conjunction with qPCR analyses. The health perception and occurrence of intestinal symptoms was recorded by questionnaire at each sampling point. PRINCIPAL FINDINGS: A high overall temporal stability of the microbiota was observed. Five subjects showed transient microbiota destabilization, which correlated not only with the intake of antibiotics but also with overseas travelling and temporary illness, expanding the hitherto known factors affecting the intestinal microbiota. We identified significant correlations between the microbiota and common intestinal symptoms, including abdominal pain and bloating. The most striking finding was the inverse correlation between Bifidobacteria and abdominal pain: subjects who experienced pain had over five-fold less Bifidobacteria compared to those without pain. Finally, a novel computational approach was used to define the common core microbiota, highlighting the role of the analysis depth in finding the phylogenetic core and estimating its size. The in-depth analysis suggested that we share a substantial number of our intestinal phylotypes but as they represent highly variable proportions of the total community, many of them often remain undetected. CONCLUSIONS/SIGNIFICANCE: A global and high-resolution microbiota analysis was carried out to determine the temporal stability, the associations with intestinal symptoms, and the individual and common core microbiota in healthy adults. The findings provide new approaches to define intestinal health and to further characterize the microbial communities inhabiting the human gut.
Overview
The claims and statistics of this paper haven’t been checked yet.
Run the check — free, no account needed. It reads the open-access text and checks the sources it cites.
Integrity signals
Registry
Cites
Statistics
Figures
Verification
Claims the paper makes
The claims and statistics of this paper haven’t been checked yet.
Run the check — free, no account needed. It reads the open-access text and checks the sources it cites.
Claims other papers make about this one
Each is checked against this paper’s own text: does it say what the citing paper says it does?
In the citing paper
“A strong association was evident between protein intake and Bacteroides and, in particular, Ruminococcaceae and Lachnospiraceae, two of the most abundant families in human gut environments [188], in explaining community diversity.”
From The athletic gut microbiota (2020) · cites this paper as [188]
In the citing paper
“These correlations are in agreement with previous findings from a longitudinal study in healthy individuals, where higher Bifidobacterium abundance was inversely associated with abdominal pain and intestinal discomfort.”
From Adaptation to tolerate high doses of arabinoxylan is associated with fecal levels of Bifidobacterium longum (2024) · cites this paper as [59]
Self-check
Percentages, sums and reported differences re-computed from the paper’s own numbers.
The self-check needs the paper’s full text.
Citations
Cites
R: A Language and Environment for Statistical Computing
R Core Team (2000) · doi:10.32614/r.manuals · Cited by 355,893
A human gut microbial gene catalogue established by metagenomic sequencing
MetaHIT Consortium, Qin, J., Li, R., Raes, J., Arumugam, M., Burgdorf, K. S., Manichanh, C., Nielsen, T., Pons, N., Levenez, F., et al. (2010) · Nature · doi:10.1038/nature08821 · Cited by 11,624
Mixed-Effects Models in Sand S-PLUS
Pinheiro, J. C., & Bates, D. M. (2000) · Statistics and Computing · doi:10.1007/978-1-4419-0318-1 · Cited by 11,187
Mixed-Effects Models in S and S-PLUS
(2001) · Technometrics · doi:10.1198/tech.2001.s574 · Cited by 9,278
Bolstad, B. M., Irizarry, R. A., Åstrand, M., & Speed, T. P. (2003) · Bioinformatics · doi:10.1093/bioinformatics/19.2.185 · Cited by 8,328
Diversity of the Human Intestinal Microbial Flora
Eckburg, P. B., Bik, E. M., Bernstein, C. N., Purdom, E., Dethlefsen, L., Sargent, M., Gill, S. R., Nelson, K. E., & Relman, D. A. (2005) · Science · doi:10.1126/science.1110591 · Cited by 7,913
A core gut microbiome in obese and lean twins
Turnbaugh, P. J., Hamady, M., Yatsunenko, T., Cantarel, B. L., Duncan, A., Ley, R. E., Sogin, M. L., Jones, W. J., Roe, B. A., Affourtit, J. P., et al. (2009) · Nature · doi:10.1038/nature07540 · Cited by 7,823
Nonparametric Statistical Methods
(1999) · Technometrics · doi:10.1080/00401706.1999.10485954 · Cited by 6,118
A Direct Approach to False Discovery Rates
Storey, J. D. (2002) · Journal of the Royal Statistical Society Series B: Statistical Methodology · doi:10.1111/1467-9868.00346 · Cited by 5,603
Host-Bacterial Mutualism in the Human Intestine
Bäckhed, F., Ley, R. E., Sonnenburg, J. L., Peterson, D. A., & Gordon, J. I. (2005) · Science · doi:10.1126/science.1104816 · Cited by 5,277
Research works printed but not linked: 1
- C Liu, 2008, International Journal of Systematic and Evolutionary Microbiology, International Journal of Systematic and Evolutionary Microbiology, 58, 1896
Cited by
Sorted by citations
Items 101–200 of 338
Impact of Changes in Gastrointestinal Microbiota in Canine and Feline Digestive Diseases
Ziese, A.-L., & Suchodolski, J. S. (2020) · Veterinary Clinics of North America Small Animal Practice · doi:10.1016/j.cvsm.2020.09.004 · Cited by 105
Eloe‐Fadrosh, E. A., McArthur, M. A., Seekatz, A. M., Drábek, E. F., Rasko, D. A., Sztein, M. B., & Fraser, C. M. (2013) · PLoS ONE · doi:10.1371/journal.pone.0062026 · Cited by 106
Effect of Yoga in the Therapy of Irritable Bowel Syndrome: A Systematic Review
Schumann, D., Anheyer, D., Lauche, R., Dobos, G. J., Langhorst, J., & Cramer, H. (2016) · Clinical Gastroenterology and Hepatology · doi:10.1016/j.cgh.2016.04.026 · Cited by 108
Rajilić-Stojanović, M. D. (2013) · Best Practice & Research Clinical Gastroenterology · doi:10.1016/j.bpg.2013.03.006 · Cited by 113
Lappi, J., Salojärvi, J., Kolehmainen, M., Mykkänen, H. M., Poutanen, K. S., de Vos, W. M., & Salonen, A. (2013) · Journal of Nutrition · doi:10.3945/jn.112.172668 · Cited by 102
Self-citationThe Use of Defined Microbial Communities To Model Host-Microbe Interactions in the Human Gut
Elzinga, J., John van der, O. O. S. T., de Vos, W. M., & Smidt, H. (2019) · Microbiology and Molecular Biology Reviews · doi:10.1128/mmbr.00054-18 · Cited by 105
Cornely, O. A., Miller, M. A., Fantin, B., Mullane, K. M., Kean, Y., & Gorbach, S. L. (2013) · Journal of Clinical Oncology · doi:10.1200/jco.2012.45.5899 · Cited by 101
From the Bottom-Up: Chemotherapy and Gut-Brain Axis Dysregulation
Bajic, J. E., Johnston, I. N., Howarth, G. S., & Hutchinson, M. R. (2018) · Frontiers in Behavioral Neuroscience · doi:10.3389/fnbeh.2018.00104 · Cited by 100
Han, G., Lee, J.-Y., Jin, G.-D., Park, J., Choi, Y. H., Chae, B. J., Kim, E. B., & Choi, Y. (2017) · Applied Microbiology and Biotechnology · doi:10.1007/s00253-017-8304-7 · Cited by 99
Novel insight into the role of microbiota in colorectal surgery
Bachmann, R., Léonard, D., Delzenne, N. M., Kartheuser, A. H., & Cani, P. D. (2017) · Gut · doi:10.1136/gutjnl-2016-312569 · Cited by 103
Tyler, A. D., Knox, N., Kabakchiev, B., Milgrom, R., Kirsch, R., Cohen, Z., McLeod, R. S., Guttman, D. S., Krause, D. O., & Silverberg, M. S. (2013) · PLoS ONE · doi:10.1371/journal.pone.0066934 · Cited by 93
Ochratoxin A: its impact on poultry gut health and microbiota, an overview
Zhai, S., Zhu, Y., Feng, P., Li, M., Wang, W., Yang, L., & Yang, Y. (2021) · Poultry Science · doi:10.1016/j.psj.2021.101037 · Cited by 92
Maintenance of a healthy trajectory of the intestinal microbiome during aging: A dietary approach
Candela, M., Biagi, E., Brigidi, P., O’Toole, P. W., & de Vos, W. M. (2013) · Mechanisms of Ageing and Development · doi:10.1016/j.mad.2013.12.004 · Cited by 87
Mitchell, H., Porter, J. A., Gibson, P. R., Barrett, J. S., & Garg, M. (2018) · Alimentary Pharmacology & Therapeutics · doi:10.1111/apt.15079 · Cited by 86
Characterization of the gut microbiota of Kawasaki disease patients by metagenomic analysis
Kinumaki, A., Sekizuka, T., Hamada, H., Kato, K., Yamashita, A., & Kuroda, M. (2015) · Frontiers in Microbiology · doi:10.3389/fmicb.2015.00824 · Cited by 86
Contribution of the Intestinal Microbiota to Human Health: From Birth to 100 Years of Age
Cheng, J., Palva, A., de Vos, W. M., & Satokari, R. M. (2011) · Current topics in microbiology and immunology · doi:10.1007/82_2011_189 · Cited by 101
Self-citationKolmeder, C. A., Salojärvi, J., Ritari, J., de Been, M., Raes, J., Falony, G., Vieira‐Silva, S., Kekkonen, R. A., Corthals, G. L., Palva, A., et al. (2016) · PLoS ONE · doi:10.1371/journal.pone.0153294 · Cited by 83
Self-citationModulation of the gut microbiota: a focus on treatments for irritable bowel syndrome
Harris, L. A., & Baffy, N. J. (2017) · Postgraduate Medicine · doi:10.1080/00325481.2017.1383819 · Cited by 89
Vandeputte, D., & Joossens, M. (2020) · Microorganisms · doi:10.3390/microorganisms8111638 · Cited by 86
Analyzing the Human Microbiome: A “How To” guide for Physicians
Tyler, A. D., Smith, M. I., & Silverberg, M. S. (2014) · The American Journal of Gastroenterology · doi:10.1038/ajg.2014.73 · Cited by 89
Kreisinger, J., Čížková, D., Schmiedová, L., & Albrecht, T. (2015) · PLoS ONE · doi:10.1371/journal.pone.0137401 · Cited by 85
de Vos, W. M. (2013) · Microbial Biotechnology · doi:10.1111/1751-7915.12047 · Cited by 84
Patterns of Gut Bacterial Colonization in Three Primate Species
McKenney, E. A., Rodrigo, A. G., & Yoder, A. D. (2015) · PLoS ONE · doi:10.1371/journal.pone.0124618 · Cited by 84
The role of the microbiome in gastrointestinal inflammation
Sanders, D. J., Inniss, S., Sebepos‐Rogers, G., Rahman, F. Z., & Smith, A. M. (2021) · Bioscience Reports · doi:10.1042/bsr20203850 · Cited by 82
Commensal Obligate Anaerobic Bacteria and Health: Production, Storage, and Delivery Strategies
Andrade, J. C., Almeida, D., Domingos, M., Seabra, C. L., Machado, D., Freitas, A. C., & Gomes, A. (2020) · Frontiers in Bioengineering and Biotechnology · doi:10.3389/fbioe.2020.00550 · Cited by 80
The Role of Bacteria, Probiotics and Diet in Irritable Bowel Syndrome
Harper, A. J., Naghibi, M., & Garcha, D. S. (2018) · Foods · doi:10.3390/foods7020013 · Cited by 82
Creedon, A. C., Hung, E. S., Berry, S. E., & Whelan, K. (2020) · Nutrients · doi:10.3390/nu12082347 · Cited by 75
Intestinal microbiome in children with severe and complicated acute viral gastroenteritis
Chen, S.-Y., Tsai, C., Lee, Y.-S., Lin, C., Huang, K.-Y., Chao, H., Lai, M., & Chiu, C. (2017) · Scientific Reports · doi:10.1038/srep46130 · Cited by 74
Global Disparities and Their Implications in the Occurrence and Outcome of Autoimmune Hepatitis
Czaja, A. J. (2017) · Digestive Diseases and Sciences · doi:10.1007/s10620-017-4675-y · Cited by 78
Comparison of bacterial quantities in left and right colon biopsies and faeces
Lyra, A. (2012) · World Journal of Gastroenterology · doi:10.3748/wjg.v18.i32.4404 · Cited by 74
New insights into irritable bowel syndrome: from pathophysiology to treatment
Hadjivasilis, A. (2019) · Annals of Gastroenterology · doi:10.20524/aog.2019.0428 · Cited by 76
Kreisinger, J., Čížková, D., Vohánka, J., & Piálek, J. (2014) · Molecular Ecology · doi:10.1111/mec.12909 · Cited by 74
Mitra, S., Förster‐Fromme, K., Damms-Machado, A., Scheurenbrand, T., Biskup, S., Huson, D. H., & Bischoff, S. C. (2013) · BMC Genomics · doi:10.1186/1471-2164-14-s5-s16 · Cited by 70
Martoni, C. J., Evans, M., Chow, C. T., Chan, L. S., & Leyer, G. (2019) · Journal of Digestive Diseases · doi:10.1111/1751-2980.12797 · Cited by 67
O’Brien, C. E., Meier, A., Cernioglo, K., Mitchell, R. D., Casaburi, G., Frese, S. A., Henrick, B. M., Underwood, M. A., & Smilowitz, J. T. (2021) · Pediatric Research · doi:10.1038/s41390-020-01350-0 · Cited by 67
Vanderhaeghen, S., Lacroix, C., & Schwab, C. (2015) · FEMS Microbiology Letters · doi:10.1093/femsle/fnv092 · Cited by 69
Kvasnovsky, C., Leong, L. E. X., Choo, J. M., Abell, G. C. J., Papagrigoriadis, S., Bruce, K. D., & Rogers, G. B. (2017) · European Journal of Gastroenterology & Hepatology · doi:10.1097/meg.0000000000000995 · Cited by 66
Mushtaq, N., Hussain, S., Zhang, S., Lü, Y., Li, H., Ullah, S., Wang, Y., & Xu, J. (2019) · International Journal of Molecular Medicine · doi:10.3892/ijmm.2019.4235 · Cited by 65
Wu, T., Grootaert, C., Pitart, J., Kardum, N., Kamiloğlu, S., Possemiers, S., Glibetić, M., Smagghe, G. J., Raes, K., de Wiele, T. V., et al. (2018) · Molecular Nutrition & Food Research · doi:10.1002/mnfr.201800607 · Cited by 63
Factoring the intestinal microbiome into the pathogenesis of autoimmune hepatitis
Czaja, A. J. (2016) · World Journal of Gastroenterology · doi:10.3748/wjg.v22.i42.9257 · Cited by 63
Functions of intestinal microflora in children
Buccigrossi, V., Nicastro, E., & Guarino, A. (2012) · Current Opinion in Gastroenterology · doi:10.1097/mog.0b013e32835a3500 · Cited by 63
Linking iron-deficiency with allergy: role of molecular allergens and the microbiome
Roth‐Walter, F., Pacios, L. F., Bianchini, R., & Jensen‐Jarolim, E. (2017) · Metallomics · doi:10.1039/c7mt00241f · Cited by 61
Composition and stability of intestinal microbiota of healthy children within a Dutch population
de Meij, T. G. J., Budding, A. E., de Groot, E. F. J., Jansen, F. M., Kneepkens, C. M. F., Benninga, M. A., Penders, J., Bodegraven, A. A. V., & Savelkoul, P. H. M. (2015) · The FASEB Journal · doi:10.1096/fj.15-278622 · Cited by 63
McDonald, J. A. K., Fuentes, S., Schroeter, K., Jong, I. H., Khursigara, C. M., de Vos, W. M., & Allen‐Vercoe, E. (2014) · Journal of Microbiological Methods · doi:10.1016/j.mimet.2014.11.007 · Cited by 59
Li, L., & Somerset, S. M. (2014) · Clinical Nutrition · doi:10.1016/j.clnu.2014.04.004 · Cited by 59
Ladirat, S. E., Schoterman, M. H. C., Rahaoui, H., Mars, M., Schuren, F. H. J., Gruppen, H., Nauta, A., & Schols, H. A. (2014) · British Journal Of Nutrition · doi:10.1017/s0007114514001135 · Cited by 60
Intestinal microbiota during early life – impact on health and disease
Nylund, L., Satokari, R. M., Salminen, S., & de Vos, W. M. (2014) · Proceedings of The Nutrition Society · doi:10.1017/s0029665114000627 · Cited by 60
Role of the intestinal microbiome in colorectal cancer surgery outcomes
Lauka, L., Reitano, E., Carra, M. C., Gaiani, F., Gavriilidis, P., Brunetti, F., de’Angelis, G. L., Sobhani, I., & de’Angelis, N. (2019) · World Journal of Surgical Oncology · doi:10.1186/s12957-019-1754-x · Cited by 60
Gargari, G., Deon, V., Taverniti, V., Gardana, C., Denina, M., Riso, P., Guardamagna, O., & Guglielmetti, S. (2018) · FEMS Microbiology Ecology · doi:10.1093/femsec/fiy045 · Cited by 57
Bernard, H., Desseyn, J., Bartke, N., Kleinjans, L., Stahl, B., Belzer, C., Knol, J., Gottrand, F., & Husson, M.-O. (2014) · The Journal of Infectious Diseases · doi:10.1093/infdis/jiu391 · Cited by 55
Brasili, E., Hassimotto, N. M. A., CHIERICO, F. D., Marini, F., Quagliariello, A., Sciubba, F., Miccheli, A., Putignani, L., & Lajolo, F. M. (2019) · Journal of Agricultural and Food Chemistry · doi:10.1021/acs.jafc.8b05408 · Cited by 52
Marteau, P., Guyonnet, D., Lafaye de Micheaux, P., & Gelu, S. (2013) · Neurogastroenterology & Motility · doi:10.1111/nmo.12078 · Cited by 50
Leng, J., Huang, F., Hai, Y., Tian, H., Liu, W., Fang, Y., Hu, Y., & Peng, J. (2019) · Phytomedicine · doi:10.1016/j.phymed.2019.153135 · Cited by 50
Wang, R., Sun, J. G., Li, G., Zhang, M., Niu, T., Kang, X., Zhao, H., Chen, J., Sun, E., & Li, Y. (2020) · Beneficial Microbes · doi:10.3920/bm2020.0023 · Cited by 49
The human urinary microbiome and how it relates to urogynecology
Schneeweiss, J., Koch, M., & Umek, W. H. (2016) · International Urogynecology Journal · doi:10.1007/s00192-016-2944-5 · Cited by 48
Microbiome Alteration in Type 2 Diabetes Mellitus Model of Zebrafish
Okazaki, F., Zang, L., Nakayama, H., Chen, Z., Gao, Z.-J., Chiba, H., Hui, S., Aoki, T., Nishimura, N., & Shimada, Y. (2019) · Scientific Reports · doi:10.1038/s41598-018-37242-x · Cited by 48
Toh, M. C. W., & Allen‐Vercoe, E. (2015) · Microbial Ecology in Health and Disease · doi:10.3402/mehd.v26.26309 · Cited by 51
Song, M., & Chan, A. T. (2017) · Current Colorectal Cancer Reports · doi:10.1007/s11888-017-0389-y · Cited by 50
Su, S., Zhao, Y., Liu, Z., Liu, G., Du, M., Wu, J., Bai, D., Li, B., Bou, G., Zhang, X., et al. (2020) · MicrobiologyOpen · doi:10.1002/mbo3.1020 · Cited by 46
Liu, H., Hu, Y. C., & Wan, Y. Y. (2015) · Oncotarget · doi:10.18632/oncotarget.6665 · Cited by 46
Sparagon, W. J., Gentry, E. C., Minich, J. J., Vollbrecht, L., Laurens, L. M. L., Allen, E. E., Sims, N. A., Dorrestein, P. C., Kelly, L. W., & Nelson, C. E. (2022) · Animal Microbiome · doi:10.1186/s42523-022-00182-z · Cited by 45
Faecal microbiota composition associates with abdominal pain in the general population
Hadizadeh, F., Bonfiglio, F., Belheouane, M., Vallier, M., Sauer, S., Bang, C., Bujanda, L., Andréasson, A., Agréus, L., Engstrand, L. G., et al. (2017) · Gut · doi:10.1136/gutjnl-2017-314792 · Cited by 44
Emerging Aspects of Food and Nutrition on Gut Microbiota
He, X. M., Marco, M. L., & Slupsky, C. M. (2013) · Journal of Agricultural and Food Chemistry · doi:10.1021/jf4029046 · Cited by 44
The Kitty Microbiome Project: Defining the Healthy Fecal “Core Microbiome” in Pet Domestic Cats
Ganz, H. H., Jospin, G., Rojas, C. A., Martin, A. L., Dahlhausen, K. E., Kingsbury, D. D., Osborne, C. X., Entrolezo, Z., Redner, S., Ramirez, B., et al. (2022) · Veterinary Sciences · doi:10.3390/vetsci9110635 · Cited by 41
Favero, C., Carriazo, S. M., Cuarental, L., Fernández-Prado, R., Gomá-Garcés, E., Pérez-Gómez, M. V., Ortíz, A., Fernández‐Fernández, B., & Sánchez-Niño, M. D. (2021) · Nutrients · doi:10.3390/nu13041273 · Cited by 42
The microbiota as a component of the celiac disease and non-celiac gluten sensitivity
Nylund, L., Kaukinen, K., & Lindfors, K. (2016) · Clinical Nutrition Experimental · doi:10.1016/j.yclnex.2016.01.002 · Cited by 41
Khan, R., Roy, N., Ali, H., & Naeem, M. (2022) · Gastroenterology Research and Practice · doi:10.1155/2022/9999925 · Cited by 41
Mardanov, A. V., Babykin, M. M., Beletsky, A. V., Grigoriev, A. I., Zinchenko, V. V., Kadnikov, V. V., Kirpichnikov, M. P., Mazur, A. M., Nedoluzhko, A., Novikova, N. D., et al. (2013) · Acta Naturae · doi:10.32607/20758251-2013-5-3-116-125 · Cited by 40
Del’Arco, A. P. W. T., MAGALHÃES, P., & Quilici, F. A. (2017) · Arquivos de Gastroenterologia · doi:10.1590/s0004-2803.201700000-09 · Cited by 38
Application of phylogenetic microarrays to interrogation of human microbiota
Paliy, O., & Agans, R. (2011) · FEMS Microbiology Ecology · doi:10.1111/j.1574-6941.2011.01222.x · Cited by 40
Kainulainen, V., Reunanen, J., Hiippala, K., Guglielmetti, S., Vesterlund, S., Palva, A., & Satokari, R. M. (2013) · Applied and Environmental Microbiology · doi:10.1128/aem.01993-13 · Cited by 39
Self-citationBioaccessible Antioxidants in Milk Fermented byBifidobacterium longumsubsp.longumStrains
Gagnon, M., Savard, P., Rivière, A., LaPointe, G., & Roy, D. (2015) · BioMed Research International · doi:10.1155/2015/169381 · Cited by 40
Comparative characterization of bacterial communities in geese fed all-grass or high-grain diets
Xu, Q., Yuan, X., Gu, T., Li, Y., Dai, W., Shen, X., Song, Y., Zhang, Y., Zhao, W., Chang, G., et al. (2017) · PLoS ONE · doi:10.1371/journal.pone.0185590 · Cited by 37
Granja-Salcedo, Y. T., Uscátegui, R. A. R., Sierra, E. G. M., Messana, J. D., Kishi, L. T., Dias, A. V. L., & Berchielli, T. T. (2017) · PLoS ONE · doi:10.1371/journal.pone.0176701 · Cited by 37
Eshar, D., & Weese, J. S. (2014) · BMC Veterinary Research · doi:10.1186/1746-6148-10-62 · Cited by 36
Keating, C., Bolton‐Warberg, M., Hinchcliffe, J., Davies, R., Whelan, S., Wan, A. H. L., FitzGerald, R. D., Davies, S. J., Ijaz, U. Z., & Smith, C. J. (2021) · Animal Microbiome · doi:10.1186/s42523-020-00065-1 · Cited by 36
Lee, D. H., Seong, H., Chang, D., Gupta, V. K., Kim, J., Cheon, S., Kim, G., Sung, J., & Han, N. S. (2023) · npj Science of Food · doi:10.1038/s41538-023-00195-1 · Cited by 35
Functional brain imaging in gastroenterology: to new beginnings
Omran, Y. A., & Aziz, Q. (2014) · Nature Reviews Gastroenterology & Hepatology · doi:10.1038/nrgastro.2014.89 · Cited by 35
Baumgartner, S., Mensink, R. P., Smet, E. D., Konings, M. C. J. M., Fuentes, S., de Vos, W. M., & Plat, J. (2016) · The Journal of Steroid Biochemistry and Molecular Biology · doi:10.1016/j.jsbmb.2016.02.029 · Cited by 38
Dougal, K., Harris, P. A., Girdwood, S. E., Creevey, C. J., Curtis, G. C., Barfoot, C. F., Argo, C. M., & Newbold, C. J. (2017) · Frontiers in Microbiology · doi:10.3389/fmicb.2017.01502 · Cited by 36
García-Mazcorro, J. F., Minamoto, Y., Kawas, J. R., Suchodolski, J. S., & de Vos, W. M. (2020) · Veterinary Sciences · doi:10.3390/vetsci7020044 · Cited by 35
Global compositional and functional states of the human gut microbiome in health and diseasePreprint
Lee, S., Portlock, T., Chatelier, E. L., García-Guevara, F., Clasen, F., Oñate, F. P., Pons, N., Begum, N., Harzandi, A., Proffitt, C., et al. (2024) · Genome Research · doi:10.1101/gr.278637.123 · Cited by 35
Shin, A., & Kashyap, P. (2023) · Gut Microbes · doi:10.1080/19490976.2023.2195792 · Cited by 34
Boucher, L., Leduc, L., Leclère, M., & Costa, M. (2024) · Animals · doi:10.3390/ani14050758 · Cited by 36
D’Argenio, G., Cariello, R., Tuccillo, C., Mazzone, G., Federico, A., Funaro, A., de Magistris, L., Grossi, E., Callegari, M. L., Chirico, M., et al. (2013) · Liver International · doi:10.1111/liv.12117 · Cited by 33
The Oncobiome in Gastroenteric and Genitourinary Cancers
D’Antonio, D. L., Marchetti, S., Pignatelli, P., Piattelli, A., & Curia, M. C. (2022) · International Journal of Molecular Sciences · doi:10.3390/ijms23179664 · Cited by 33
Transient colonizing microbes promote gut dysbiosis and functional impairment
Lee, S., Meslier, V., Bidkhori, G., García-Guevara, F., Etienne‐Mesmin, L., Clasen, F., Park, J., Oñate, F. P., Cai, H., Chatelier, E. L., et al. (2024) · npj Biofilms and Microbiomes · doi:10.1038/s41522-024-00561-1 · Cited by 34
Abdominal Pain Response to Rifaximin in Patients With Irritable Bowel Syndrome With Diarrhea
Lembo, A. J., Rao, S. S. C., Heimanson, Z., & Pimentel, M. (2020) · Clinical and Translational Gastroenterology · doi:10.14309/ctg.0000000000000144 · Cited by 34
Role of Low FODMAP Diet and Probiotics on Gut Microbiome in Irritable Bowel Syndrome (IBS)
Selvaraj, S. M., Wong, S. H., Ser, H., & Lee, L. (2020) · Progress In Microbes & Molecular Biology · doi:10.36877/pmmb.a0000069 · Cited by 31
Yadav, M., Kumar, T., Kanakan, A., Maurya, R., Pandey, R., & Chauhan, N. S. (2022) · Frontiers in Microbiology · doi:10.3389/fmicb.2022.932795 · Cited by 31
Bai, J., Shen, N., & Liu, Y. (2022) · Pain Management Nursing · doi:10.1016/j.pmn.2022.06.002 · Cited by 33
Effect of gut microbiota in the colorectal cancer and potential target therapy
Li, J., Zhu, Y., Yang, L., & Wang, Z. (2022) · Discover Oncology · doi:10.1007/s12672-022-00517-x · Cited by 29
Effect of Microgravity on the Gut Microbiota Bacterial Composition in a Hindlimb Unloading Model
Siddiqui, R., Qaisar, R., Khan, N. A., Alharbi, A. M., Alfahemi, H. H., & Elmoselhi, A. B. (2022) · Life · doi:10.3390/life12111865 · Cited by 30
The role of the gut microbiome in disorders of gut–brain interaction
Gawey, B. J., Mars, R. A. T., & Kashyap, P. (2024) · FEBS Journal · doi:10.1111/febs.17200 · Cited by 30
Trego, A. C., Holohan, B. C., Keating, C., Graham, A., O’Connor, S., Gerardo, M. L., Hughes, D., Ijaz, U. Z., & O’Flaherty, V. (2021) · Bioresource Technology · doi:10.1016/j.biortech.2021.125786 · Cited by 28
Bach, L., Ram, A., Ijaz, U. Z., Evans, T. J., & Lindström, J. (2021) · Frontiers in Microbiology · doi:10.3389/fmicb.2020.573969 · Cited by 27
Laatikainen, R., Jalanka, J., Loponen, J., Hongisto, S.-M., Hillilä, M. T., Koskenpato, J., Korpela, R., & Salonen, A. (2019) · BMC Nutrition · doi:10.1186/s40795-019-0278-7 · Cited by 26
Self-citationde Jonge, C., Fuentes, S., Zoetendal, E. G., Bouvy, N. D., Nelissen, R. M. E. H., Buurman, W. A., Greve, J.-W. M., de Vos, W. M., & Rensen, S. S. (2019) · International Journal of Obesity · doi:10.1038/s41366-019-0336-x · Cited by 25
Pan, H., Liu, C.-X., Zhu, H.-J., & Zhang, G.-F. (2024) · The Journal of Headache and Pain · doi:10.1186/s10194-024-01906-z · Cited by 24
The Association Between Gut Microbiota, Toll-Like Receptors, and Colorectal Cancer
Fang, Y., Yan, C., Zhao, Q., Zhao, B., Liao, Y., Chen, Y., Wang, D., & Tang, D. (2022) · Clinical Medicine Insights Oncology · doi:10.1177/11795549221130549 · Cited by 24
Metadata
- Authors
- Jalanka-Tuovinen, J., Salonen, A., Nikkilä, J., Immonen, O., Kekkonen, R., Lahti, L., Palva, A., & de Vos, W. M.
- Affiliations
- University of Helsinki (FI)
- Valio (Finland) (FI)
- Corresponding author
- Salonen, Anne
- Venue
- PLoS ONE
- Publisher
- Public Library of Science (PLoS)
- Published
- 2011-07-28
- Volume
- 6
- Issue
- 7
- Pages
- e23035
- ISSN
- 1932-6203 (ISSN-L)
- PMC
- PMC3145776
- OpenAlex
- W2157800726
- Cited by
- 340
- References
- 75
- Citations by year
- 2026: 2 · 2025: 7 · 2024: 19 · 2023: 17 · 2022: 23 · 2021: 20 · 2020: 23 · 2019: 19 · 2018: 19 · 2017: 34 · 2016: 32 · 2015: 28 · 2014: 31 · 2013: 44 · 2012: 20
- FWCI
- 12.61
- Type
- journal article
- Language
- en
- Open access
- gold
- doi.org
- Locations
- PLoS ONE (publishedVersion, cc-by)
- Europe PMC (PubMed Central) (publishedVersion, cc-by)
- PubMed Central (publishedVersion, cc-by)
- PubMed (publishedVersion)
- Socio-Environmental Systems Modeling (acceptedVersion)
- Työväentutkimus Vuosikirja (submittedVersion)
- DOAJ (DOAJ: Directory of Open Access Journals) (submittedVersion, cc-by-sa)
- Figshare (submittedVersion, cc-by)
- Data Archiving and Networked Services (DANS) (submittedVersion, other-oa)
- Funders
- Tekes
- Valio
- Wageningen University and Research
- Topics
- Life Sciences › Biochemistry, Genetics and Molecular Biology › Molecular Biology › Gut microbiota and health
- Health Sciences › Medicine › Gastroenterology › Gastrointestinal motility and disorders
- Life Sciences › Agricultural and Biological Sciences › Food Science › Probiotics and Fermented Foods
- Keywords
- gut microbiota, healthy adults, temporal stability, core microbiome, intestinal symptoms, abdominal pain, bloating, Bifidobacterium, antibiotics, archaea, gut health
- MeSH terms
- Adult, Bacteria, DNA, Bacterial, Double-Blind Method, Feces, Female, Humans, Intestinal Diseases, Intestines, Longitudinal Studies, Male, Middle Aged, Phylogeny, RNA, Messenger, RNA, Ribosomal, 16S, Biomarkers, Reverse Transcriptase Polymerase Chain Reaction, Oligonucleotide Array Sequence Analysis, Gene Expression Profiling, Biodiversity, Metagenome
About these checks
Registry, retraction, Cites and statistics results are computed, not judged, with one exception: a printed reference that no index lists is read once by a model before it counts as a citation error. Claims are extracted by a model and kept only when their quote appears verbatim in the text; each cited source is then checked, with a model’s help, for whether it says what the claim relies on. Those verdicts can be wrong — read the claim’s quote and the cited source before relying on one.
Statistics and arithmetic are recomputed, not judged.
Confidence bands are shown only for fields calibrated on our annotated test set. None is calibrated yet, so no band is shown.
What counts as a claim ›How we measure confidence ›How we check this ›
Are you an author, or do you see a problem with this page? Request a review
