

The DOI matches its Crossref record; 91 of the 92 references it cites were found in a registry or an index.
Reversal of Fragile X Phenotypes by Manipulation of AβPP/Aβ Levels in Fmr1KO Mice
Open accessAbstract
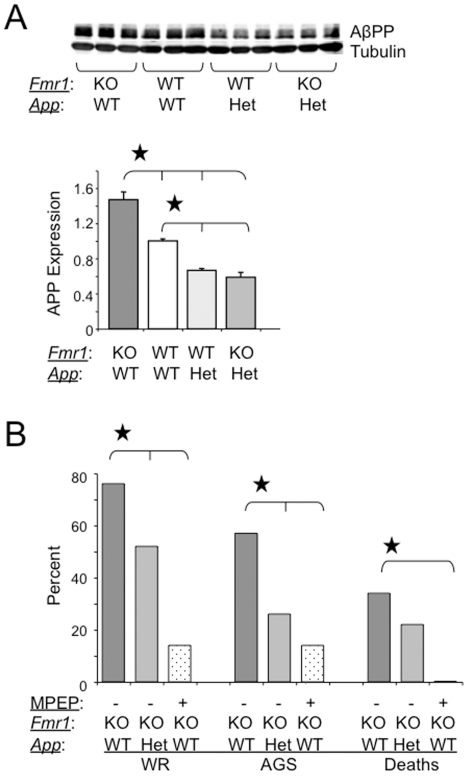
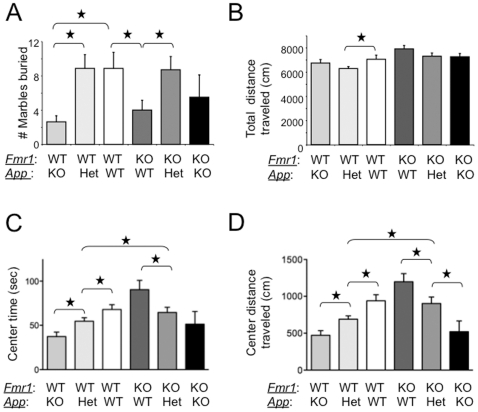
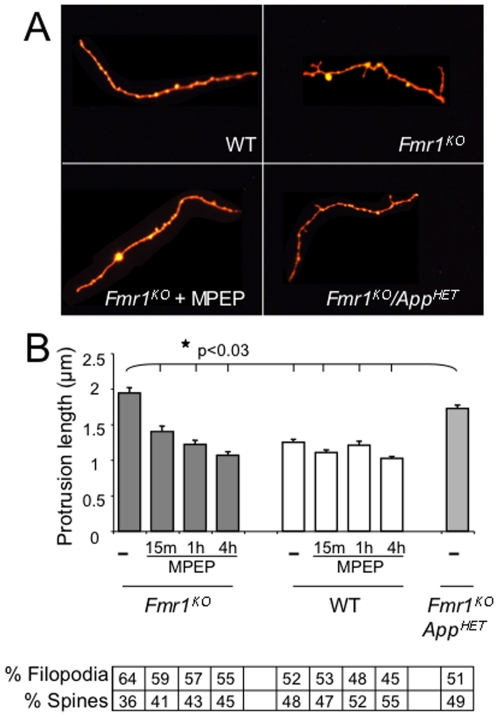
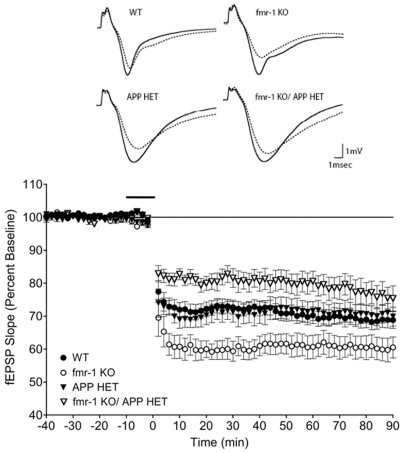
Fragile X syndrome (FXS) is the most common form of inherited intellectual disability and the leading known genetic cause of autism. Fragile X mental retardation protein (FMRP), which is absent or expressed at substantially reduced levels in FXS, binds to and controls the postsynaptic translation of amyloid β-protein precursor (AβPP) mRNA. Cleavage of AβPP can produce β-amyloid (Aβ), a 39-43 amino acid peptide mis-expressed in Alzheimer's disease (AD) and Down syndrome (DS). Aβ is over-expressed in the brain of Fmr1(KO) mice, suggesting a pathogenic role in FXS. To determine if genetic reduction of AβPP/Aβ rescues characteristic FXS phenotypes, we assessed audiogenic seizures (AGS), anxiety, the ratio of mature versus immature dendritic spines and metabotropic glutamate receptor (mGluR)-mediated long-term depression (LTD) in Fmr1(KO) mice after removal of one App allele. All of these phenotypes were partially or completely reverted to normal. Plasma Aβ(1-42) was significantly reduced in full-mutation FXS males compared to age-matched controls while cortical and hippocampal levels were somewhat increased, suggesting that Aβ is sequestered in the brain. Evolving therapies directed at reducing Aβ in AD may be applicable to FXS and Aβ may serve as a plasma-based biomarker to facilitate disease diagnosis or assess therapeutic efficacy.
Overview
The claims and statistics of this paper haven’t been checked yet.
Run the check — free, no account needed. It reads the open-access text and checks the sources it cites.
Integrity signals
Registry
Cites
Statistics
Figures
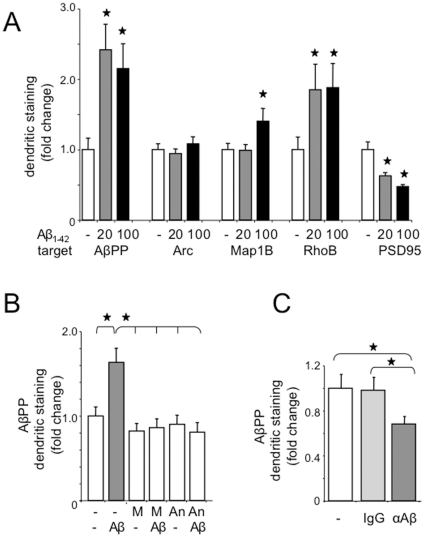
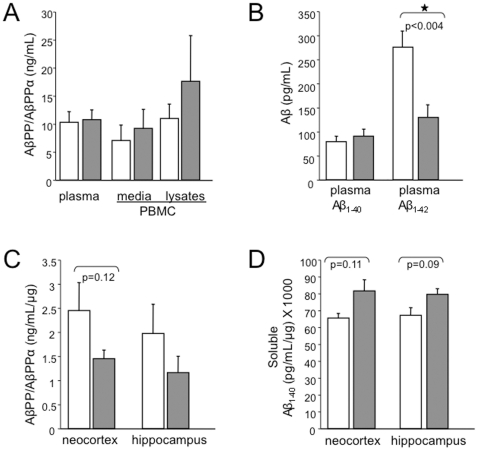
Verification
Claims the paper makes
The claims and statistics of this paper haven’t been checked yet.
Run the check — free, no account needed. It reads the open-access text and checks the sources it cites.
Claims other papers make about this one
Each is checked against this paper’s own text: does it say what the citing paper says it does?
In the citing paper
“many of the other classic behavioural phenotypes used as outcome measures in preclinical studies are inconsistently observed in Fmr1-KO mice (such as open field, rotarod, elevated plus-maze, marble burying, self-grooming and most social paradigms).”
From Drug development for neurodevelopmental disorders: lessons learned from fragile X syndrome (2018) · cites this paper as [65]
In the citing paper
“As a result, the rescue of these behavioural phenotypes has been difficult to consolidate and to use as a guide for clinical studies30,49,56,64,65.”
From Drug development for neurodevelopmental disorders: lessons learned from fragile X syndrome (2018) · cites this paper as [65]
In the citing paper
“Genetic reduction of AβPP in Fmr1 KO mice rescues characteristic FXS phenotypes, such as audiogenic seizures, the ratio of mature versus immature dendritic spines, and mGluR-LTD (91).”
From Fragile X syndrome: causes, diagnosis, mechanisms, and therapeutics (2012) · cites this paper as [91]
Self-check
Percentages, sums and reported differences re-computed from the paper’s own numbers.
The self-check needs the paper’s full text.
Citations
Cites
Amyloid plaque core protein in Alzheimer disease and Down syndrome.
Masters, C. L., Simms, G., Weinman, N. A., Multhaup, G., McDonald, B. L., & Beyreuther, K. (1985) · Proceedings of the National Academy of Sciences · doi:10.1073/pnas.82.12.4245 · Cited by 4,431
Walsh, D. M., Klyubin, I., Fadeeva, J. V., Cullen, W. K., Anwyl, R., Wolfe, M. S., Rowan, M. J., & Selkoe, D. J. (2002) · Nature · doi:10.1038/416535a · Cited by 4,291
Shankar, G. M., Li, S., Mehta, T. H., Garcia-Munoz, A., Shepardson, N. E., Smith, I., Brett, F. M., Farrell, M. A., Rowan, M. J., Lemere, C. A., et al. (2008) · Nature Medicine · doi:10.1038/nm1782 · Cited by 3,685
Diffusible, nonfibrillar ligands derived from Aβ 1–42 are potent central nervous system neurotoxins
Lambert, M. P., Barlow, A. K., Chromy, B. A., Edwards, C., Freed, R., Liosatos, M., Morgan, T. E., Rozovsky, I., Trommer, B., Viola, K. L., et al. (1998) · Proceedings of the National Academy of Sciences · doi:10.1073/pnas.95.11.6448 · Cited by 3,506
Verkerk, A. J. M. H., Pieretti, M., Sutcliffe, J. S., Fu, Y.-H., Kuhl, D. P. A., Pizzuti, A., Reiner, O., Richards, S., Victoria, M. F., Zhang, F., et al. (1991) · Cell · doi:10.1016/0092-8674(91)90397-h · Cited by 3,481
APP Processing and Synaptic Function
Kamenetz, F., Tomita, T., Hsieh, H., Seabrook, G., Borchelt, D., Iwatsubo, T., Sisodia, S., & Malinow, R. (2003) · Neuron · doi:10.1016/s0896-6273(03)00124-7 · Cited by 1,644
The mGluR theory of fragile X mental retardation
Bear, M. F., Huber, K. M., & Warren, S. T. (2004) · Trends in Neurosciences · doi:10.1016/j.tins.2004.04.009 · Cited by 1,580
Instability of a 550-Base Pair DNA Segment and Abnormal Methylation in Fragile X Syndrome
Oberlé, I., Rousseau, F., Heitz, D., Kretz, C., Devys, D., Hanauer, A., Boué, J., Bertheas, M. F., & Mandel, J. L. (1991) · Science · doi:10.1126/science.252.5009.1097 · Cited by 1,499
Altered synaptic plasticity in a mouse model of fragile X mental retardation
Huber, K. M., Gallagher, S. M., Warren, S. T., & Bear, M. F. (2002) · Proceedings of the National Academy of Sciences · doi:10.1073/pnas.122205699 · Cited by 1,349
Occurrence of neuropathological changes and dementia of Alzheimer’s disease in Down’s syndrome
Wisniewski, K. E., Wisniewski, H. M., & Wen, G. Y. (1985) · Annals of Neurology · doi:10.1002/ana.410170310 · Cited by 1,159
Research works printed but not linked: 2
- [1]Hagerman RJ Hagerman PJ 2002 Physical and behavioral phenotype Baltimore John Hopkins University Press 3 109
- [69]Miller LJ McIntosh DN McGrath J Shyu V Lampe M 1999 Electrodermal responses to sensory stimuli in individuals with fragile X syndrome: A preliminary report. Am J Med Genet 83 4 268 279 10208160
Cited by
Sorted by citations
Hagerman, R. J., Berry-Kravis, E., Hazlett, H. C., Bailey, D. B., Moine, H., Kooy, R. F., Tassone, F., Gantois, I., Sonenberg, N., Mandel, J. L., et al. (2017) · Nature Reviews Disease Primers · doi:10.1038/nrdp.2017.65 · Cited by 838
Self-citationThe Pathophysiology of Fragile X (and What It Teaches Us about Synapses)
Bhakar, A. L., Dölen, G., & Bear, M. F. (2012) · Annual Review of Neuroscience · doi:10.1146/annurev-neuro-060909-153138 · Cited by 370
Drug development for neurodevelopmental disorders: lessons learned from fragile X syndrome
Berry-Kravis, E. M., Lindemann, L., Jønch, A. E., Apostol, G., Bear, M. F., Carpenter, R. L., Crawley, J. N., Curie, A., Des Portes, V., Hossain, F., et al. (2018) · Nature Reviews Drug Discovery · doi:10.1038/nrd.2017.221 · Cited by 336
Self-citationFragile X syndrome: causes, diagnosis, mechanisms, and therapeutics
Bagni, C., Tassone, F., Neri, G., & Hagerman, R. (2012) · Journal of Clinical Investigation · doi:10.1172/jci63141 · Cited by 321
Dysregulation and restoration of translational homeostasis in fragile X syndrome
Richter, J. D., Bassell, G. J., & Klann, E. (2015) · Nature Reviews Neuroscience · doi:10.1038/nrn4001 · Cited by 275
Metadata
- Authors
- Westmark, C. J., Westmark, P. R., O'Riordan, K. J., Ray, B. C., Hervey, C. M., Salamat, M. S., Abozeid, S. H., Stein, K. M., Stodola, L. A., Tranfaglia, M., Burger, C., Berry-Kravis, E. M., & Malter, J. S.
- Affiliations
- University of Wisconsin–Madison (US)
- Rush University Medical Center (US)
- Fraxa Research Foundation (US)
- Corresponding author
- Westmark, Cara J.
- Venue
- PLoS ONE
- Publisher
- Public Library of Science (PLoS)
- Published
- 2011-10-26
- Volume
- 6
- Issue
- 10
- Pages
- e26549
- ISSN
- 1932-6203 (ISSN-L)
- PMC
- PMC3202540
- OpenAlex
- W1966255973
- Cited by
- 110
- References
- 92
- Citations by year
- 2026: 3 · 2025: 3 · 2024: 2 · 2023: 6 · 2022: 5 · 2021: 5 · 2020: 4 · 2019: 5 · 2018: 6 · 2017: 9 · 2016: 13 · 2015: 16 · 2014: 13 · 2013: 11 · 2012: 8
- FWCI
- 6.38
- Type
- journal article
- Language
- en
- Open access
- gold
- doi.org
- Locations
- PLoS ONE (publishedVersion, cc-by)
- Europe PMC (PubMed Central) (publishedVersion, cc-by)
- PubMed Central (publishedVersion, cc-by)
- PubMed (publishedVersion)
- RePEc: Research Papers in Economics (submittedVersion)
- DOAJ (DOAJ: Directory of Open Access Journals) (submittedVersion, cc-by-sa)
- Figshare (submittedVersion, cc-by)
- Funders
- FRAXA Research Foundation
- Waisman Center (P30 HD03352, HD03352)
- National Institutes of Health (HD033.52)
- National Institute on Drug Abuse (R01DA026067)
- Eunice Kennedy Shriver National Institute of Child Health and Human Development (P30HD03352., P30HD003352)
- Topics
- Life Sciences › Biochemistry, Genetics and Molecular Biology › Genetics › Genetics and Neurodevelopmental Disorders
- Life Sciences › Neuroscience › Cellular and Molecular Neuroscience › Alzheimer's disease research and treatments
- Life Sciences › Neuroscience › Cellular and Molecular Neuroscience › Neuroscience and Neuropharmacology Research
- Keywords
- fragile X syndrome, FMRP, amyloid precursor protein, amyloid-beta, Fmr1 knockout mice, audiogenic seizures, anxiety, dendritic spines, metabotropic glutamate receptors, long-term depression, plasma biomarkers, intellectual disability, autism spectrum disorder, Alzheimer's disease
- MeSH terms
- Animals, Brain Chemistry, Female, Fragile X Syndrome, Male, Neurons, Peptide Fragments, Phenotype, Genetic Therapy, Down-Regulation, Amyloid beta-Peptides, Amyloid beta-Protein Precursor, Receptors, Metabotropic Glutamate, Mice, Knockout, Dendritic Spines, Mice, Fragile X Mental Retardation Protein, Fragile X Messenger Ribonucleoprotein 1
About these checks
Registry, retraction, Cites and statistics results are computed, not judged, with one exception: a printed reference that no index lists is read once by a model before it counts as a citation error. Claims are extracted by a model and kept only when their quote appears verbatim in the text; each cited source is then checked, with a model’s help, for whether it says what the claim relies on. Those verdicts can be wrong — read the claim’s quote and the cited source before relying on one.
Statistics and arithmetic are recomputed, not judged.
Confidence bands are shown only for fields calibrated on our annotated test set. None is calibrated yet, so no band is shown.
What counts as a claim ›How we measure confidence ›How we check this ›
Are you an author, or do you see a problem with this page? Request a review
