Cited by 221Receptor Mechanisms and SignalingFungal and yeast genetics researchGenomics and Phylogenetic Studies

The DOI matches its Crossref record; 47 of the 47 references it cites were found in a registry or an index.

The Origin of GPCRs: Identification of Mammalian like Rhodopsin, Adhesion, Glutamate and Frizzled GPCRs in Fungi

Open access

Abstract

G protein-coupled receptors (GPCRs) in humans are classified into the five main families named Glutamate, Rhodopsin, Adhesion, Frizzled and Secretin according to the GRAFS classification. Previous results show that these mammalian GRAFS families are well represented in the Metazoan lineages, but they have not been shown to be present in Fungi. Here, we systematically mined 79 fungal genomes and provide the first evidence that four of the five main mammalian families of GPCRs, namely Rhodopsin, Adhesion, Glutamate and Frizzled, are present in Fungi and found 142 novel sequences between them. Significantly, we provide strong evidence that the Rhodopsin family emerged from the cAMP receptor family in an event close to the split of Opisthokonts and not in Placozoa, as earlier assumed. The Rhodopsin family then expanded greatly in Metazoans while the cAMP receptor family is found in 3 invertebrate species and lost in the vertebrates. We estimate that the Adhesion and Frizzled families evolved before the split of Unikonts from a common ancestor of all major eukaryotic lineages. Also, the study highlights that the fungal Adhesion receptors do not have N-terminal domains whereas the fungal Glutamate receptors have a broad repertoire of mammalian-like N-terminal domains. Further, mining of the close unicellular relatives of the Metazoan lineage, Salpingoeca rosetta and Capsaspora owczarzaki, obtained a rich group of both the Adhesion and Glutamate families, which in particular provided insight to the early emergence of the N-terminal domains of the Adhesion family. We identified 619 Fungi specific GPCRs across 79 genomes and revealed that Blastocladiomycota and Chytridiomycota phylum have Metazoan-like GPCRs rather than the GPCRs specific for Fungi. Overall, this study provides the first evidence of the presence of four of the five main GRAFS families in Fungi and clarifies the early evolutionary history of the GPCR superfamily.

Overview

The claims and statistics of this paper haven’t been checked yet.

Run the check — free, no account needed. It reads the open-access text and checks the sources it cites.

A few free checks a day · papers already verified open instantly · results are public

Integrity signals

Registry

Crossref · 10.1371/journal.pone.0029817

Cites

47 of 47 references verified0 citation errors · 0 not checkable

Statistics

Figures

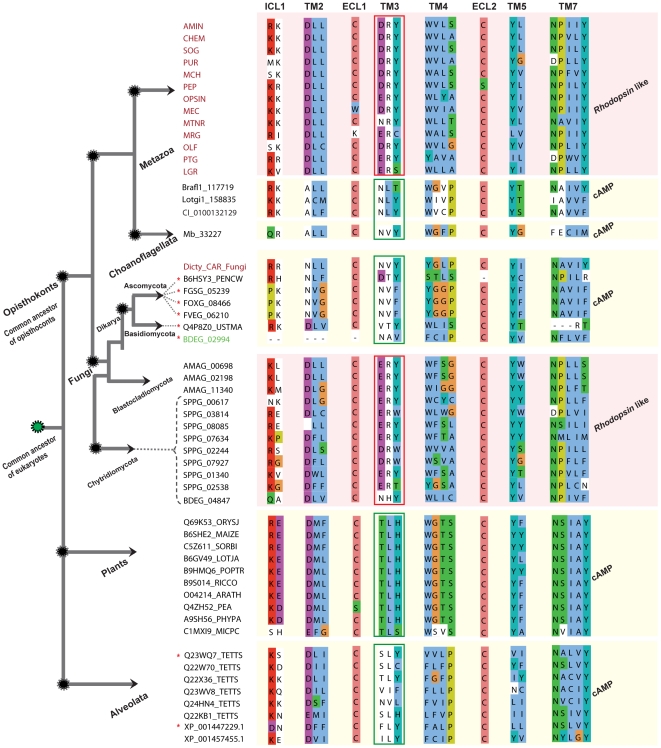
Figure 1 Alignment showing shared and group specific motifs between Rhodopsin and cAMP like receptors in eukaryotes. We include consensus sequences obtained for each of the known 13 subgroups (colored red) of the large Rhodopsin family members from H. sapiens and a lone cAMP member from C. intestinalis to represent the Metazoan lineage. The alignment includes the identified cAMP like sequences from B. floridae (Brafl1_117719), L. gigantea (Lotgi1_158835), M. brevicollis (Mb_33227) a Choanoflagellata, consensus sequence obtained from 51 cAMP receptors from Fungi (Dicty_CAR_Fungi), and Alveolata (8) and Rhodopsin like sequences found only from 3 species, A. macrogynus (3) from Blastocladiomycota, B. dendrobatidis (BDEG_02994) and S. punctatus (8) which are member of the Chytridiomycota, an ancestral fungal lineage. The alignment also includes 10 cAMP receptor sequences from plants, obtained from Pfam database. The sequences are grouped based on family as cAMP and Rhodopsin like with respective to the major lineages across the eukaryotic tree to display the distinctive and shared motifs between them. The sequences which are marked with asterisk (red) received 7tm_1 (Rhodopsin like) as the best domain hit for HMM search against Pfam A families. We grouped those 8 sequences as cAMP receptors based on motifs and with strong support from phylogeny. The sequence (BDEG_02994, colored green) has only 5 TM domains, but was included as a lone representative for cAMP in Chytridiomycota. Major group specific motifs are indicated in red (Rhodopsin) and green (cAMP) rectangular boxes respectively. The text above the alignment denotes the transmembrane (TM) passage, intracellular loops (ICL) or extra-cellular loops (ECL). Schematic representation on the left indicates the evolution of major eukaryotic lineages from a unicellular common ancestor. Nodes defining relationships across the eukaryotic tree are marked with dotted circles (black), common eukaryotic ancestor (green), the same representation applies to Figure 4 and 5. The dotted lines pointing to the sequence id indicate to which phylum it belongs to, within the Fungi kingdom. The overall schematic representation of the eukaryotic tree was adapted from [17].
Figure 1 Alignment showing shared and group specific motifs between Rhodopsin and cAMP like receptors in eukaryotes. We include consensus sequences obtained for each of the known 13 subgroups (colored red) of the large Rhodopsin family members from H. sapiens and a lone cAMP member from C. intestinalis to represent the Metazoan lineage. The alignment includes the identified cAMP like sequences from B. floridae (Brafl1_117719), L. gigantea (Lotgi1_158835), M. brevicollis (Mb_33227) a Choanoflagellata, consensus sequence obtained from 51 cAMP receptors from Fungi (Dicty_CAR_Fungi), and Alveolata (8) and Rhodopsin like sequences found only from 3 species, A. macrogynus (3) from Blastocladiomycota, B. dendrobatidis (BDEG_02994) and S. punctatus (8) which are member of the Chytridiomycota, an ancestral fungal lineage. The alignment also includes 10 cAMP receptor sequences from plants, obtained from Pfam database. The sequences are grouped based on family as cAMP and Rhodopsin like with respective to the major lineages across the eukaryotic tree to display the distinctive and shared motifs between them. The sequences which are marked with asterisk (red) received 7tm_1 (Rhodopsin like) as the best domain hit for HMM search against Pfam A families. We grouped those 8 sequences as cAMP receptors based on motifs and with strong support from phylogeny. The sequence (BDEG_02994, colored green) has only 5 TM domains, but was included as a lone representative for cAMP in Chytridiomycota. Major group specific motifs are indicated in red (Rhodopsin) and green (cAMP) rectangular boxes respectively. The text above the alignment denotes the transmembrane (TM) passage, intracellular loops (ICL) or extra-cellular loops (ECL). Schematic representation on the left indicates the evolution of major eukaryotic lineages from a unicellular common ancestor. Nodes defining relationships across the eukaryotic tree are marked with dotted circles (black), common eukaryotic ancestor (green), the same representation applies to Figure 4 and 5. The dotted lines pointing to the sequence id indicate to which phylum it belongs to, within the Fungi kingdom. The overall schematic representation of the eukaryotic tree was adapted from [17].CC BY · PubMed Central
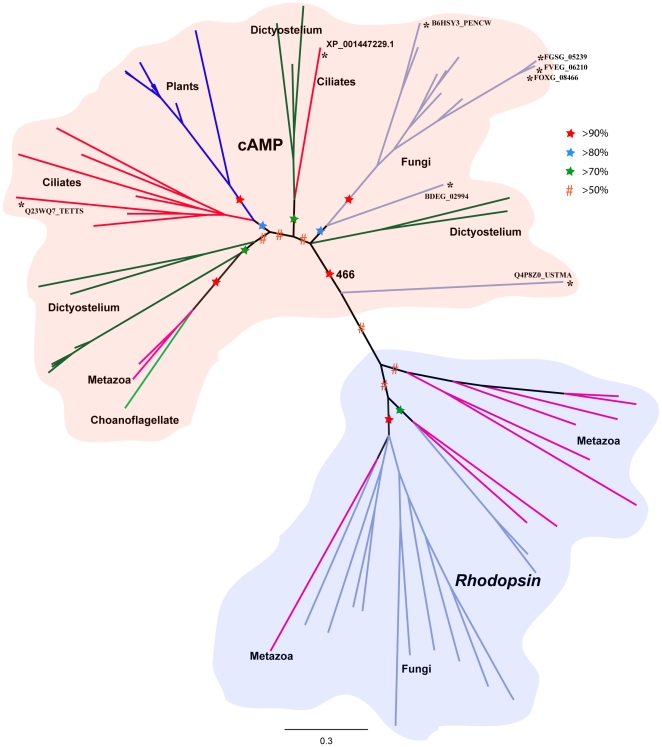
Figure 2 Phylogenetic relationships between the cAMP and Rhodopsin families across eukaryotic lineages. The tree is based on Bayesian method of phylogenetic inference. The phylogenetic tree is based only on the transmembrane region. Robustness of the nodes is tested with posterior probabilities based on MCMC analysis (see Methods). Nodes supported by posterior probabilities between 50–70% are marked with hash symbol (red) and nodes between 70–80%, 80–90% and >90% are marked with a star colored green, blue and red, respectively. Bootstrap support from maximum likelihood approach (PhyML) is indicated for the node that separates Rhodopsin and cAMP receptors. The edges marked with asterisk were found to be Rhodopsin like sequences (8) in HMM search, but classified as cAMP based on phylogeny and motifs. The motifs of those 8 sequences similar to the other cAMP sequences are shown in Figure 1.
Figure 2 Phylogenetic relationships between the cAMP and Rhodopsin families across eukaryotic lineages. The tree is based on Bayesian method of phylogenetic inference. The phylogenetic tree is based only on the transmembrane region. Robustness of the nodes is tested with posterior probabilities based on MCMC analysis (see Methods). Nodes supported by posterior probabilities between 50–70% are marked with hash symbol (red) and nodes between 70–80%, 80–90% and >90% are marked with a star colored green, blue and red, respectively. Bootstrap support from maximum likelihood approach (PhyML) is indicated for the node that separates Rhodopsin and cAMP receptors. The edges marked with asterisk were found to be Rhodopsin like sequences (8) in HMM search, but classified as cAMP based on phylogeny and motifs. The motifs of those 8 sequences similar to the other cAMP sequences are shown in Figure 1.CC BY · PubMed Central
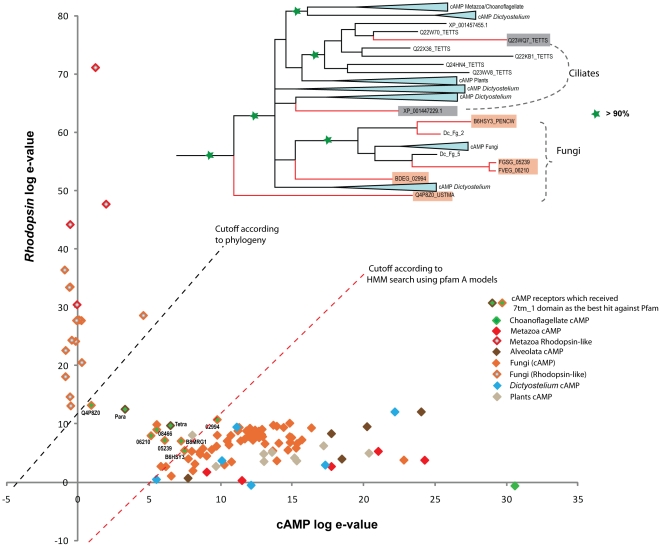
Figure 3 Scatter plot distinguishing cAMP and the Rhodopsin like sequences. The sequences which are plotted were tested with HMM search using 7tm_1 (PF00001) and Dicty_CAR (PF05462) HMM models downloaded from Pfam. The e-values for each Rhodopsin like sequence (Y-axis) is plotted against the e-values of cAMP like sequences (X-axis) in a logarithmic scale. The members are distinguished with colors corresponding to each group shown in the right corner. The dotted line in red shows the approximate cutoff which clearly distinguishes cAMP and Rhodopsin like sequences according to the HMM search with the HMM models. The special cases which are shown in green with accession id, received e-values very similar in HMM search against both the models, but were classified as Rhodopsin like sequences according to the HMM search. Those 8 sequences which belong to ciliates (2) and Fungi (6) were classified as cAMP like sequences with strong support from phylogeny, which is shown as an inset at the top. The posterior probability more than 90% is marked with a star (green). An approximate cutoff according to the phylogeny is shown as dotted lines (black).
Figure 3 Scatter plot distinguishing cAMP and the Rhodopsin like sequences. The sequences which are plotted were tested with HMM search using 7tm_1 (PF00001) and Dicty_CAR (PF05462) HMM models downloaded from Pfam. The e-values for each Rhodopsin like sequence (Y-axis) is plotted against the e-values of cAMP like sequences (X-axis) in a logarithmic scale. The members are distinguished with colors corresponding to each group shown in the right corner. The dotted line in red shows the approximate cutoff which clearly distinguishes cAMP and Rhodopsin like sequences according to the HMM search with the HMM models. The special cases which are shown in green with accession id, received e-values very similar in HMM search against both the models, but were classified as Rhodopsin like sequences according to the HMM search. Those 8 sequences which belong to ciliates (2) and Fungi (6) were classified as cAMP like sequences with strong support from phylogeny, which is shown as an inset at the top. The posterior probability more than 90% is marked with a star (green). An approximate cutoff according to the phylogeny is shown as dotted lines (black).CC BY · PubMed Central
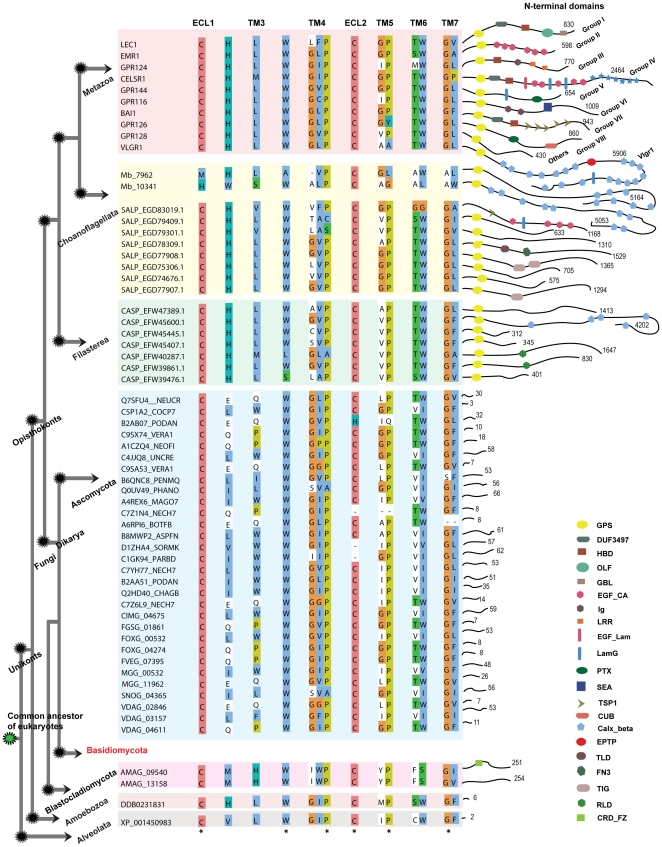
Figure 4 Conserved features and structural motifs within the Adhesion receptor family in eukaryotes. The illustration represents known Adhesion receptors from Metazoan lineage with one sequence for each group I–VIII, GPR128 as others and VLGR1. Sequence DDB0231831, only member from D. discoideum represents Amoebozoa. The illustration includes newly identified sequences from other eukaryotic lineages like Choanoflagellata (S. rosetta; 8), Filasterea (C. owczarzaki; 7), Fungi (32), and Alveolata (P. tetraurelia; 1). The sequences are grouped respective to the major lineages across the eukaryotic tree. Common motifs of the Adhesion receptors were adapted from [8]. The residues which have ≥90% conservation across the eukaryotic tree are marked with a star at the bottom of the alignment. Interestingly, the loss of the Adhesion receptors in Basidiomycota phylum which descended from a common ancestor of Dikarya is indicated in red. The right part of the figure displays the diversity within the N-termini of the Adhesion receptors. The domains were identified with Pfam search and also verified with RPS-Blast with a cutoff e-value of 0.1. Each domain is marked with a symbol, and the explanation is found in the legend in the lower right corner. The numbers at corner of each connective thread along the domain symbols indicates the length of the N-termini. The following domains were found: GPS (GPCR proteolytic site), DUF3497 (Domain of unknown function), HBD (hormone-binding domain), OLF (olfactomedin domain), GBL (galactose-binding lectin domain), EGF_CA (calcium-binding epidermal growth factor-like domain), Ig (immunoglobulin domain), LRR (leucine-rich repeat), CA (cadherin repeats), EGF_Lam (laminin type epidermal growth factor domain), LamG (laminin G domain), Pentaxin domain, SEA (sea urchin sperm protein domain), TSP1 (thrombospondin repeats, type 1), CUB (C1r/C1s urinary epidermal growth factor and bone morphogenetic domain), Calx-beta domain, EPTP (epitempin protein domain), TLD (this domain is predicted to be an enzyme and is often found associated with pfam0147), FN3 (Fibronectin type III domain), TIG (this family consists of a domain that has an immunoglobulin like fold), RLD (Receptor L domain), CRD_FZ (CRD_domain cysteine-rich domain, also known as Fz (frizzled) domain).
Figure 4 Conserved features and structural motifs within the Adhesion receptor family in eukaryotes. The illustration represents known Adhesion receptors from Metazoan lineage with one sequence for each group I–VIII, GPR128 as others and VLGR1. Sequence DDB0231831, only member from D. discoideum represents Amoebozoa. The illustration includes newly identified sequences from other eukaryotic lineages like Choanoflagellata (S. rosetta; 8), Filasterea (C. owczarzaki; 7), Fungi (32), and Alveolata (P. tetraurelia; 1). The sequences are grouped respective to the major lineages across the eukaryotic tree. Common motifs of the Adhesion receptors were adapted from [8]. The residues which have ≥90% conservation across the eukaryotic tree are marked with a star at the bottom of the alignment. Interestingly, the loss of the Adhesion receptors in Basidiomycota phylum which descended from a common ancestor of Dikarya is indicated in red. The right part of the figure displays the diversity within the N-termini of the Adhesion receptors. The domains were identified with Pfam search and also verified with RPS-Blast with a cutoff e-value of 0.1. Each domain is marked with a symbol, and the explanation is found in the legend in the lower right corner. The numbers at corner of each connective thread along the domain symbols indicates the length of the N-termini. The following domains were found: GPS (GPCR proteolytic site), DUF3497 (Domain of unknown function), HBD (hormone-binding domain), OLF (olfactomedin domain), GBL (galactose-binding lectin domain), EGF_CA (calcium-binding epidermal growth factor-like domain), Ig (immunoglobulin domain), LRR (leucine-rich repeat), CA (cadherin repeats), EGF_Lam (laminin type epidermal growth factor domain), LamG (laminin G domain), Pentaxin domain, SEA (sea urchin sperm protein domain), TSP1 (thrombospondin repeats, type 1), CUB (C1r/C1s urinary epidermal growth factor and bone morphogenetic domain), Calx-beta domain, EPTP (epitempin protein domain), TLD (this domain is predicted to be an enzyme and is often found associated with pfam0147), FN3 (Fibronectin type III domain), TIG (this family consists of a domain that has an immunoglobulin like fold), RLD (Receptor L domain), CRD_FZ (CRD_domain cysteine-rich domain, also known as Fz (frizzled) domain).CC BY · PubMed Central
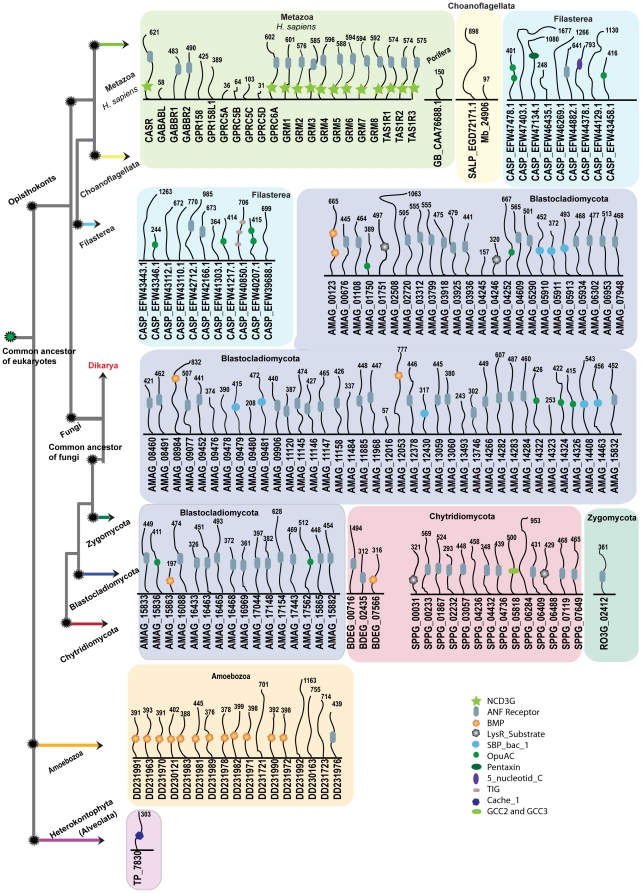
Figure 5 Schematic presentations of N-terminal domains of the Glutamate receptor family across the eukaryotic tree. The figure illustrates N-terminal domain architecture of the Glutamate receptors across different kingdoms of eukaryotes. The domains were identified with Pfam search and verified with RPS-Blast with a cutoff e-value of 0.1. For comparison, we represent known domain architecture of 22 Glutamate receptors from Homo sapiens for Metazoan lineage and 17 from D. discoideum for Amoebozoa and 1 from T. pseudonana for Alveolata. The illustration displays newly identified sequences from other eukaryotic lineages like Porifera (G. cydonium) a sister group to Metazoans, Choanoflagellata (M. brevicollis and S. rosetta), Filasterea (C. owczarzaki) and 4 genomes of Fungi; 1 for Blastocladiomycota (A. macrogynus) 2 representing for Chytridiomycota (B. dendrobatidis, S. punctatus) and 1 for Zygomycota (R. oryzae). The sequences are grouped respective to the major lineages across the eukaryotic tree. The colored boxes indicate the sequences to which phylum they belong to. The loss of Glutamate receptors in Dikarya which descended from a common ancestor of Fungi is indicated in red. The numbers at the top of each connective thread along domain symbols indicates the length of the N-termini. Each domain is marked with a symbol and abbreviated in the lower right corner. The domains are NCD3G (Nine Cysteines Domain of family 3 GPCR), ANF receptor (Receptor family ligand binding region), BMP (Basic membrane protein), LysR_Substrate (LysR substrate binding domain), SBP_bac_1 (Bacterial extracellular solute-binding protein), OpuAC (Substrate binding domain of ABC-type glycine betaine transport system), Pentaxin domain, 5_nucleotid_C domain, TIG (this family consists of a domain that has an immunoglobulin like fold), Cache_1 (Cache domain) and GCC2_GCC3.
Figure 5 Schematic presentations of N-terminal domains of the Glutamate receptor family across the eukaryotic tree. The figure illustrates N-terminal domain architecture of the Glutamate receptors across different kingdoms of eukaryotes. The domains were identified with Pfam search and verified with RPS-Blast with a cutoff e-value of 0.1. For comparison, we represent known domain architecture of 22 Glutamate receptors from Homo sapiens for Metazoan lineage and 17 from D. discoideum for Amoebozoa and 1 from T. pseudonana for Alveolata. The illustration displays newly identified sequences from other eukaryotic lineages like Porifera (G. cydonium) a sister group to Metazoans, Choanoflagellata (M. brevicollis and S. rosetta), Filasterea (C. owczarzaki) and 4 genomes of Fungi; 1 for Blastocladiomycota (A. macrogynus) 2 representing for Chytridiomycota (B. dendrobatidis, S. punctatus) and 1 for Zygomycota (R. oryzae). The sequences are grouped respective to the major lineages across the eukaryotic tree. The colored boxes indicate the sequences to which phylum they belong to. The loss of Glutamate receptors in Dikarya which descended from a common ancestor of Fungi is indicated in red. The numbers at the top of each connective thread along domain symbols indicates the length of the N-termini. Each domain is marked with a symbol and abbreviated in the lower right corner. The domains are NCD3G (Nine Cysteines Domain of family 3 GPCR), ANF receptor (Receptor family ligand binding region), BMP (Basic membrane protein), LysR_Substrate (LysR substrate binding domain), SBP_bac_1 (Bacterial extracellular solute-binding protein), OpuAC (Substrate binding domain of ABC-type glycine betaine transport system), Pentaxin domain, 5_nucleotid_C domain, TIG (this family consists of a domain that has an immunoglobulin like fold), Cache_1 (Cache domain) and GCC2_GCC3.CC BY · PubMed Central
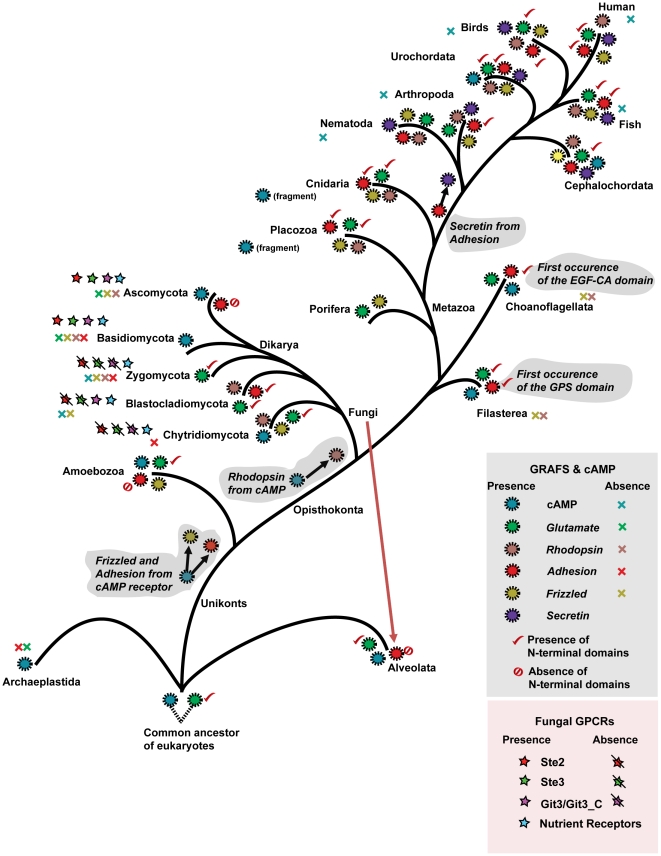
Figure 6 Schematic presentation of the origin, evolution and lineage-specific losses of the five main GRAFS families, cAMP receptor family and the Fungi kingdom specific GPCRs. The eukaryotic evolutionary tree is constructed with references from the tree of life Web project (http://tolweb.org/tree/phylogeny.html). Each branch shows the presence (colored circles) and the loss (colored cross symbol) of the five main GRAFS families and the cAMP receptor family. The presence and absence of the N-terminal domains of the Glutamate and the Adhesion family is indicated with a tick mark and a crossed circle, respectively. The presence of Fungi kingdom specific GPCRs were represented by colored star symbols, and their absence with a line segment in black against the respective colored star symbol. The putative connection and origin of the Glutamate and cAMP receptor family is indicated with dotted lines at the bottom. The horizontal gene transfer of the Adhesion receptor family from Fungi to Alveolata is indicated with dotted lines in red. Branch lengths are not drawn to represent actual evolutionary distances.
Figure 6 Schematic presentation of the origin, evolution and lineage-specific losses of the five main GRAFS families, cAMP receptor family and the Fungi kingdom specific GPCRs. The eukaryotic evolutionary tree is constructed with references from the tree of life Web project (http://tolweb.org/tree/phylogeny.html). Each branch shows the presence (colored circles) and the loss (colored cross symbol) of the five main GRAFS families and the cAMP receptor family. The presence and absence of the N-terminal domains of the Glutamate and the Adhesion family is indicated with a tick mark and a crossed circle, respectively. The presence of Fungi kingdom specific GPCRs were represented by colored star symbols, and their absence with a line segment in black against the respective colored star symbol. The putative connection and origin of the Glutamate and cAMP receptor family is indicated with dotted lines at the bottom. The horizontal gene transfer of the Adhesion receptor family from Fungi to Alveolata is indicated with dotted lines in red. Branch lengths are not drawn to represent actual evolutionary distances.CC BY · PubMed Central

Verification

Claims the paper makes

The claims and statistics of this paper haven’t been checked yet.

Run the check — free, no account needed. It reads the open-access text and checks the sources it cites.

A few free checks a day · papers already verified open instantly · results are public

Claims other papers make about this one

Each is checked against this paper’s own text: does it say what the citing paper says it does?

Self-check

Percentages, sums and reported differences re-computed from the paper’s own numbers.

The self-check needs the paper’s full text.

Citations

Cites

Show all 47 references

Cited by

Sorted by citations

See all 221

Metadata

Authors
Krishnan, A., Almén, M. S., Fredriksson, R., & Schiöth, H. B.
Affiliations
Uppsala University (SE)
Corresponding author
Schiöth, Helgi B.
Venue
PLoS ONE
Published
2012-01-04
Volume
7
Issue
1
Pages
e29817
ISSN
1932-6203 (ISSN-L)
OpenAlex
W1983820999
Cited by
204
References
47
Citations by year
2026: 6 · 2025: 11 · 2024: 16 · 2023: 11 · 2022: 11 · 2021: 7 · 2020: 16 · 2019: 14 · 2018: 8 · 2017: 14 · 2016: 23 · 2015: 20 · 2014: 18 · 2013: 18 · 2012: 10
FWCI
8.48
Type
journal article
Language
en
Open access
Locations
  • PLoS ONE (publishedVersion, cc-by)
  • Europe PMC (PubMed Central) (publishedVersion, cc-by)
  • PubMed Central (publishedVersion, cc-by)
  • PubMed (publishedVersion)
  • Uppsala University Publications (Uppsala University) (submittedVersion, other-oa)
  • RePEc: Research Papers in Economics (submittedVersion)
  • DOAJ (DOAJ: Directory of Open Access Journals) (submittedVersion, cc-by-sa)
  • Figshare (submittedVersion, cc-by)
Funders
  • Novo Nordisk
  • Vetenskapsrådet
  • Magnus Bergvalls Stiftelse
  • Uppsala Universitet
  • Novo Nordisk Fonden
Topics
  • Life Sciences › Biochemistry, Genetics and Molecular Biology › Molecular Biology › Receptor Mechanisms and Signaling
  • Life Sciences › Biochemistry, Genetics and Molecular Biology › Molecular Biology › Fungal and yeast genetics research
  • Life Sciences › Biochemistry, Genetics and Molecular Biology › Molecular Biology › Genomics and Phylogenetic Studies
Keywords
G protein-coupled receptors, GPCR evolution, rhodopsin family, cell adhesion receptors, glutamate receptors, Frizzled receptors, N-terminal domain, Salpingoeca rosetta, Capsaspora owczarzaki, Blastocladiomycota, Chytridiomycota, fungal genome
MeSH terms
Amino Acid Sequence, Animals, Cloning, Molecular, Fungi, Genes, Fungal, Humans, Mammals, Molecular Sequence Data, Phylogeny, Rhodopsin, Cell Adhesion Molecules, Genome, Fungal, Receptors, Glutamate, Evolution, Molecular, Receptors, G-Protein-Coupled, Frizzled Receptors

About these checks

Registry, retraction, Cites and statistics results are computed, not judged, with one exception: a printed reference that no index lists is read once by a model before it counts as a citation error. Claims are extracted by a model and kept only when their quote appears verbatim in the text; each cited source is then checked, with a model’s help, for whether it says what the claim relies on. Those verdicts can be wrong — read the claim’s quote and the cited source before relying on one.

Statistics and arithmetic are recomputed, not judged.

Confidence bands are shown only for fields calibrated on our annotated test set. None is calibrated yet, so no band is shown.

What counts as a claim ›How we measure confidence ›How we check this ›

Are you an author, or do you see a problem with this page? Request a review