

The DOI matches its Crossref record; 62 of the 62 references it cites were found in a registry or an index.
Isoform Diversity and Regulation in Peripheral and Central Neurons Revealed through RNA-Seq
Open accessAbstract
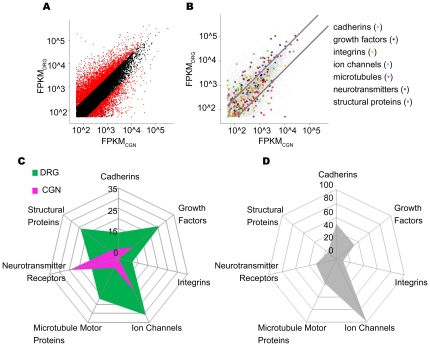
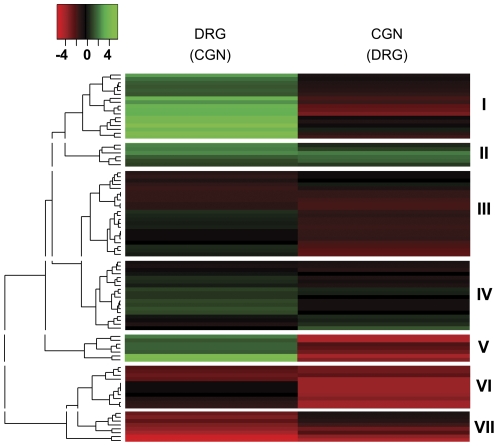
To fully understand cell type identity and function in the nervous system there is a need to understand neuronal gene expression at the level of isoform diversity. Here we applied Next Generation Sequencing of the transcriptome (RNA-Seq) to purified sensory neurons and cerebellar granular neurons (CGNs) grown on an axonal growth permissive substrate. The goal of the analysis was to uncover neuronal type specific isoforms as a prelude to understanding patterns of gene expression underlying their intrinsic growth abilities. Global gene expression patterns were comparable to those found for other cell types, in that a vast majority of genes were expressed at low abundance. Nearly 18% of gene loci produced more than one transcript. More than 8000 isoforms were differentially expressed, either to different degrees in different neuronal types or uniquely expressed in one or the other. Sensory neurons expressed a larger number of genes and gene isoforms than did CGNs. To begin to understand the mechanisms responsible for the differential gene/isoform expression we identified transcription factor binding sites present specifically in the upstream genomic sequences of differentially expressed isoforms, and analyzed the 3' untranslated regions (3' UTRs) for microRNA (miRNA) target sites. Our analysis defines isoform diversity for two neuronal types with diverse axon growth capabilities and begins to elucidate the complex transcriptional landscape in two neuronal populations.
Overview
The claims and statistics of this paper haven’t been checked yet.
Run the check — free, no account needed. It reads the open-access text and checks the sources it cites.
Integrity signals
Registry
Cites
Statistics
Figures
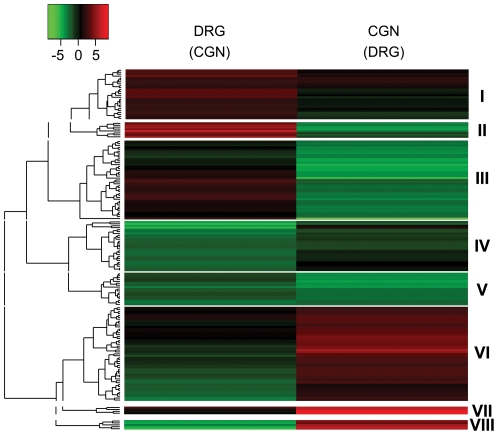
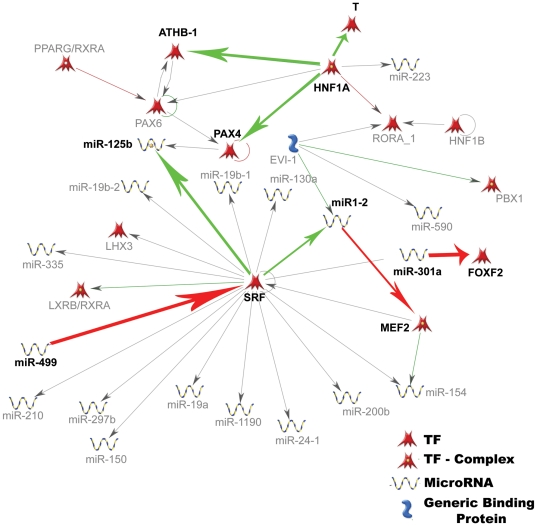
Verification
Claims the paper makes
The claims and statistics of this paper haven’t been checked yet.
Run the check — free, no account needed. It reads the open-access text and checks the sources it cites.
Claims other papers make about this one
Each is checked against this paper’s own text: does it say what the citing paper says it does?
The cited source doesn’t support the claim as written.
In the citing paper
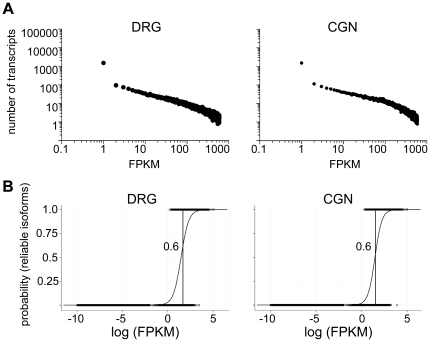
“Therefore, genes expressed at FPKM values Ͼ0.1 are expressed at statistically significant levels (Ͼ99% confidence)”
From An RNA-Sequencing Transcriptome and Splicing Database of Glia, Neurons, and Vascular Cells of the Cerebral Cortex (2014) · cites this paper as Lerch et al., 2012
Checked by a reasoning model — may be wrong.
Experimental — accuracy not yet measured
Self-check
Percentages, sums and reported differences re-computed from the paper’s own numbers.
The self-check needs the paper’s full text.
Citations
Cites
Analysis of Relative Gene Expression Data Using Real-Time Quantitative PCR and the 2−ΔΔCT Method
Livak, K. J., & Schmittgen, T. D. (2001) · Methods · doi:10.1006/meth.2001.1262 · Cited by 180,860
Bartel (2004) · doi:10.1016/s0092-8674(04)00045-5 · Cited by 34,714
Ultrafast and memory-efficient alignment of short DNA sequences to the human genome.
Langmead, B., Trapnell, C., Pop, M., & Salzberg, S. L. (2009) · Genome Biology · doi:10.1186/gb-2009-10-3-r25 · Cited by 21,849
Trapnell, C., Williams, B. A., Pertea, G., Mortazavi, A., Kwan, G., van Baren, M. J., Salzberg, S. L., Wold, B. J., & Pachter, L. (2010) · Nature Biotechnology · doi:10.1038/nbt.1621 · Cited by 15,556
Mapping and quantifying mammalian transcriptomes by RNA-Seq
Mortazavi, A., Williams, B. A., McCue, K., Schaeffer, L., & Wold, B. (2008) · Nature Methods · doi:10.1038/nmeth.1226 · Cited by 13,696
RNA-Seq: a revolutionary tool for transcriptomics
Wang, Z., Gerstein, M., & Snyder, M. (2009) · Nature Reviews Genetics · doi:10.1038/nrg2484 · Cited by 13,174
Lewis, B. P., Burge, C. B., & Bartel, D. P. (2005) · Cell · doi:10.1016/j.cell.2004.12.035 · Cited by 11,855
TopHat: discovering splice junctions with RNA-Seq
Trapnell, C., Pachter, L. S., & Salzberg, S. L. (2009) · Bioinformatics · doi:10.1093/bioinformatics/btp120 · Cited by 11,682
A ceRNA Hypothesis: The Rosetta Stone of a Hidden RNA Language?
Salmena, L., Poliseno, L., Tay, Y., Kats, L., & Pandolfi, P. P. (2011) · Cell · doi:10.1016/j.cell.2011.07.014 · Cited by 7,262
RNA-seq: An assessment of technical reproducibility and comparison with gene expression arrays
Marioni, J. C., Mason, C. E., Mane, S. M., Stephens, M., & Gilad, Y. (2008) · Genome Research · doi:10.1101/gr.079558.108 · Cited by 2,771
The Transcriptional Program in the Response of Human Fibroblasts to Serum
Iyer, V. R., Eisen, M. B., Ross, D. T., Schuler, G. D., Moore, T. A., Lee, J. C. F., Trent, J. M., Staudt, L. M., Hudson, J., Boguski, M. S., et al. (1999) · Science · doi:10.1126/science.283.5398.83 · Cited by 1,966
MicroRNA-Directed Cleavage of HOXB8 mRNA
Yekta, S., Shih, I.-H., & Bartel, D. P. (2004) · Science · doi:10.1126/science.1097434 · Cited by 1,702
Promoting Axon Regeneration in the Adult CNS by Modulation of the PTEN/mTOR Pathway
Park, K. K., Liu, K., Hu, Y., Smith, P. D., Wang, C., Cai, B., Xu, B., Connolly, L., Kramvis, I., Sahin, M., et al. (2008) · Science · doi:10.1126/science.1161566 · Cited by 1,686
Bullard, J. H., Purdom, E., Hansen, K. D., & Dudoit, S. (2010) · BMC Bioinformatics · doi:10.1186/1471-2105-11-94 · Cited by 1,680
MicroRNAs to Nanog, Oct4 and Sox2 coding regions modulate embryonic stem cell differentiation
Tay, Y., Zhang, J., Thomson, A. M., Lim, B., & Rigoutsos, I. (2008) · Nature · doi:10.1038/nature07299 · Cited by 1,415
Target mRNAs are repressed as efficiently by microRNA-binding sites in the 5′ UTR as in the 3′ UTR
Lytle, J., Yario, T. A., & STEITZ, J. A. (2007) · Proceedings of the National Academy of Sciences · doi:10.1073/pnas.0703820104 · Cited by 1,236
Jones, K. R., Fariñas, I., Backus, C., & Reichardt, L. F. (1994) · Cell · doi:10.1016/0092-8674(94)90377-8 · Cited by 1,041
PTEN deletion enhances the regenerative ability of adult corticospinal neurons
Liu, K., Lü, Y., Lee, J. K., Samara, R. F., Willenberg, R., Sears‐Kraxberger, I., Tedeschi, A., Park, K. K., Jin, D., Cai, B., et al. (2010) · Nature Neuroscience · doi:10.1038/nn.2603 · Cited by 987
Tsujino, H., Kondo, E., Fukuoka, T., Dai, Y., Tokunaga, A., Miki, K., Yonenobu, K., Ochi, T., & Noguchi, K. (2000) · Molecular and Cellular Neuroscience · doi:10.1006/mcne.1999.0814 · Cited by 769
Gallo, V., Kingsbury, A. E., Balázs, R., & Jørgensen, O. S. (1987) · Journal of Neuroscience · doi:10.1523/jneurosci.07-07-02203.1987 · Cited by 750
Bryne, J. C., Valen, E., Tang, M. E., Marstrand, T. T., Winther, O., da Piedade, I., Krogh, A., Lenhard, B., & Sandelin, A. (2007) · Nucleic Acids Research · doi:10.1093/nar/gkm955 · Cited by 702
An, J. J., Gharami, K., Liao, G., Woo, N. H., Lau, A. G., Vanevski, F., Torre, E. R., Jones, K. R., Feng, Y., Lu, B., et al. (2008) · Cell · doi:10.1016/j.cell.2008.05.045 · Cited by 698
Sumazin, P., Yang, X., Chiu, H., Chung, W., Iyer, A. P., Llobet‐Navàs, D., Rajbhandari, P., Bansal, M., Guarnieri, P., Silva, J., et al. (2011) · Cell · doi:10.1016/j.cell.2011.09.041 · Cited by 695
Neumann, S., & Woolf, C. J. (1999) · Neuron · doi:10.1016/s0896-6273(00)80755-2 · Cited by 659
Davies, S. J. A., Goucher, D. R., Doller, C., & Silver, J. (1999) · The Journal of Neuroscience · doi:10.1523/jneurosci.19-14-05810.1999 · Cited by 606
ATF3 Increases the Intrinsic Growth State of DRG Neurons to Enhance Peripheral Nerve Regeneration
Seijffers, R., Mills, C. D., & Woolf, C. J. (2007) · Journal of Neuroscience · doi:10.1523/jneurosci.5313-06.2007 · Cited by 425
Fiore, R., Khudayberdiev, S., Christensen, M., Siegel, G., Flavell, S. W., Kim, T., Greenberg, M. E., & Schratt, G. (2009) · The EMBO Journal · doi:10.1038/emboj.2009.10 · Cited by 382
Nuclear PTEN Regulates the APC-CDH1 Tumor-Suppressive Complex in a Phosphatase-Independent Manner
Song, M. S., Carracedo, A., Salmena, L., Song, S. J., Egia, A., Malumbres, M., & Pandolfi, P. P. (2011) · Cell · doi:10.1016/j.cell.2010.12.020 · Cited by 379
oPOSSUM: identification of over-represented transcription factor binding sites in co-expressed genes
Sui, S. J. H. (2005) · Nucleic Acids Research · doi:10.1093/nar/gki624 · Cited by 370
PTEN Inhibition to Facilitate Intrinsic Regenerative Outgrowth of Adult Peripheral Axons
Christie, K. J., Webber, C. A., Martinez, J. A., Singh, B., & Zochodne, D. W. (2010) · Journal of Neuroscience · doi:10.1523/jneurosci.6271-09.2010 · Cited by 336
Twine, N. A., Janitz, K., Wilkins, M. R., & Janitz, M. (2011) · PLoS ONE · doi:10.1371/journal.pone.0016266 · Cited by 309
Axonal regeneration in the rat sciatic nerve: Effect of a conditioning lesion and of dbcAMP
McQuarrie, I. G., Grafstein, B., & Gershon, M. D. (1977) · Brain Research · doi:10.1016/0006-8993(77)90193-7 · Cited by 290
PTEN/mTOR and axon regeneration
Park, K. K., Liu, K., Hu, Y., Kanter, J. L., & He, Z. (2010) · Experimental Neurology · doi:10.1016/j.expneurol.2009.12.032 · Cited by 285
A Transcriptomic Atlas of Mouse Neocortical Layers
Belgard, T. G., Marques, A. C., Oliver, P. L., Abaan, H. Ö., Sirey, T., Hoerder‐Suabedissen, A., García‐Moreno, F., Molnár, Z., Margulies, E. H., & Ponting, C. P. (2011) · Neuron · doi:10.1016/j.neuron.2011.06.039 · Cited by 277
MicroRNAs acting in a double-negative feedback loop to control a neuronal cell fate decision
Johnston, R. J., Chang, S., Etchberger, J. F., Ortiz, C. O., & Hobert, O. (2005) · Proceedings of the National Academy of Sciences · doi:10.1073/pnas.0505530102 · Cited by 276
Axon Outgrowth Enhanced by a Previous Nerve Injury
McQuarrie, I. G., & Grafstein, B. (1973) · Archives of Neurology · doi:10.1001/archneur.1973.00490250071008 · Cited by 268
Changes in neurotrophin responsiveness during the development of cerebellar granule neurons
Segal, R. A., Takahashi, H., & McKay, R. D. G. (1992) · Neuron · doi:10.1016/0896-6273(92)90064-k · Cited by 238
Expression of distinct RNAs from 3′ untranslated regions
Mercer, T. R., Wilhelm, D., Dinger, M. E., Soldà, G., Korbie, D. J., Glazov, E. A., Truong, V., Schwenke, M., Simons, C., Matthaei, K. I., et al. (2010) · Nucleic Acids Research · doi:10.1093/nar/gkq1158 · Cited by 225
Schlesinger, J., Schueler, M., Grunert, M., Fischer, J. J., Zhang, Q., Krueger, T., Lange, M., Tönjes, M., Dunkel, I., & Sperling, S. (2011) · PLoS Genetics · doi:10.1371/journal.pgen.1001313 · Cited by 224
Thangnipon, W., Kingsbury, A. E., Webb, M., & Balázs, R. (1983) · Developmental Brain Research · doi:10.1016/0165-3806(83)90215-8 · Cited by 194
Requirement of nerve growth factor for development of substance P-containing sensory neurones
Otten, U., Goedert, M., Mayer, N., & Lembeck, F. (1980) · Nature · doi:10.1038/287158a0 · Cited by 190
Wu, J. Q., Habegger, L., Noisa, P., Szekely, A., Qiu, C., Hutchison, S., Raha, D., Egholm, M., Lin, H., Weissman, S., et al. (2010) · Proceedings of the National Academy of Sciences · doi:10.1073/pnas.0914114107 · Cited by 189
Chang, S. S., Johnston, R. J., & Hobert, O. (2003) · Genes & Development · doi:10.1101/gad.1117903 · Cited by 182
Tang, W., Ehrlich, I., Wolff, S. B. E., Michalski, A., Wölfl, S., Hasan, M. T., Lüthi, A., & Sprengel, R. (2009) · Journal of Neuroscience · doi:10.1523/jneurosci.0359-09.2009 · Cited by 179
Universality and flexibility in gene expression from bacteria to human
Ueda, H. R., Hayashi, S., Matsuyama, S., Yomo, T., Hashimoto, S., Kay, S. A., Hogenesch, J. B., & Iino, M. (2004) · Proceedings of the National Academy of Sciences · doi:10.1073/pnas.0306244101 · Cited by 168
oPOSSUM: integrated tools for analysis of regulatory motif over-representation
Sui, S. J. H., Fulton, D. L., Arenillas, D. J., Kwon, A. T.-J., & Wasserman, W. W. (2007) · Nucleic Acids Research · doi:10.1093/nar/gkm427 · Cited by 162
Genome-wide detection and analysis of hippocampus core promoters using DeepCAGEPreprint
Valen, E., Pascarella, G., Chalk, A. M., Maeda, N., Kojima, M., Kawazu, C., Murata, M., Nishiyori, H., Lazarević, D., Motti, D., et al. (2008) · Genome Research · doi:10.1101/gr.084541.108 · Cited by 140
Self-citationDysregulation and cellular mislocalization of specific miRNAs in myotonic dystrophy type 1
Perbellini, R., Greco, S., Sarra-Ferraris, G., Cardani, R., Capogrossi, M. C., Meola, G., & Martelli, F. (2010) · Neuromuscular Disorders · doi:10.1016/j.nmd.2010.11.012 · Cited by 137
Serum Response Factor Mediates NGF-Dependent Target Innervation by Embryonic DRG Sensory Neurons
Wickramasinghe, S. R., Alvania, R. S., Ramanan, N., Wood, J. N., Mandai, K., & Ginty, D. D. (2008) · Neuron · doi:10.1016/j.neuron.2008.03.006 · Cited by 123
High content screening of cortical neurons identifies novel regulators of axon growth
Blackmore, M. G., Moore, D. L., Smith, R. P., Goldberg, J. L., Bixby, J. L., & Lemmon, V. (2010) · Molecular and Cellular Neuroscience · doi:10.1016/j.mcn.2010.02.002 · Cited by 123
Self-citationPolo‐Parada, L., Böse, C., Plattner, F., & Landmesser, L. T. (2004) · Journal of Neuroscience · doi:10.1523/jneurosci.4406-03.2004 · Cited by 105
Inhibition of neuronal phenotype by PTEN in PC12 cells
Musatov, S. A., Roberts, J., Brooks, A. I., Pena, J., Betchen, S. A., Pfaff, D. W., & Kaplitt, M. G. (2004) · Proceedings of the National Academy of Sciences · doi:10.1073/pnas.0308289101 · Cited by 68
Usher, L., Johnstone, A. L., Ertürk, A., Hu, Y. J., Strikis, D., Wanner, I. B., Moorman, S., Lee, J.-W., Min, J., Ha, H., et al. (2010) · Journal of Neuroscience · doi:10.1523/jneurosci.0302-10.2010 · Cited by 58
Self-citationMiyazaki, K., Inoue, S., Yamada, K., Watanabe, M., Liu, Q., Watanabe, T., Adachi, M. T., Tanaka, Y., & Kitajima, S. (2009) · Nucleic Acids Research · doi:10.1093/nar/gkn1082 · Cited by 58
Transcriptional profiling of intrinsic PNS factors in the postnatal mouse
Smith, R. P., Lerch, J. K., Pardinas, J. R., Buchser, W., Bixby, J. L., & Lemmon, V. (2010) · Molecular and Cellular Neuroscience · doi:10.1016/j.mcn.2010.07.015 · Cited by 56
Self-citationThe extracellular-matrix protein matrilin 2 participates in peripheral nerve regeneration
Malin, D., Sonnenberg-Riethmacher, E., Guseva, D., Wagener, R., Aszódi, A., Irintchev, A., & Riethmacher, D. (2009) · Journal of Cell Science · doi:10.1242/jcs.040378 · Cited by 54
Serum Response Factor–Dependent MicroRNAs Regulate Gastrointestinal Smooth Muscle Cell Phenotypes
Park, C., Hennig, G. W., Sanders, K. M., Cho, J. H., Hatton, W. J., Redelman, D. D., Park, J. K., Ward, S. M., Miano, J. M., Yan, W., et al. (2011) · Gastroenterology · doi:10.1053/j.gastro.2011.03.058 · Cited by 51
Beck, D., Ayers, S., Wen, J., Brandl, M., Pham, T. D., Webb, P., Chang, C.-C., & Zhou, X. (2011) · BMC Medical Genomics · doi:10.1186/1755-8794-4-19 · Cited by 47
Asap: A Framework for Over-Representation Statistics for Transcription Factor Binding Sites
Marstrand, T. T., Frellsen, J., Moltke, I., Thiim, M., Valen, E., Retelska, D., & Krogh, A. (2008) · PLoS ONE · doi:10.1371/journal.pone.0001623 · Cited by 46
Chen, H., Liu, Z., Gong, S., Wu, X.-J., Taylor, W. L., Williams, R. W., Matta, S. G., & Sharp, B. (2011) · Frontiers in Neuroscience · doi:10.3389/fnins.2011.00098 · Cited by 36
96-Well Electroporation Method for Transfection of Mammalian Central Neurons
Buchser, W., Pardinas, J. R., Shi, Y., Bixby, J. L., & Lemmon, V. (2006) · BioTechniques · doi:10.2144/000112279 · Cited by 36
Self-citationN‐terminally truncated BAF57 isoforms contribute to the diversity of SWI/SNF complexes in neurons
Kazantseva, A., Sepp, M., Kazantseva, J., Sadam, H., Pruunsild, P., Timmusk, T., Neuman, T., & Palm, K. (2009) · Journal of Neurochemistry · doi:10.1111/j.1471-4159.2009.06005.x · Cited by 32
Cited by
Sorted by citations
Zhang, Y., Chen, K., Sloan, S. A., Bennett, M. L., Scholze, A. R., O'Keeffe, S., Phatnani, H. P., Guarnieri, P., Caneda, C., Ruderisch, N., et al. (2014) · The Journal of Neuroscience · doi:10.1523/jneurosci.1860-14.2014 · Cited by 4,875
“…assess the accuracy and reliability of our RNA-Seq experiments, we applied a widely used procedure to determine the threshold for reliable FPKM estimation based on optimizing the intersection of falsepositive and false-negative rates (Ramskold et al., 2009; Lerch et al., 2012; Chen et al., 2013).”
BackgroundMethodInfluentialEvolution to the rescue: using comparative genomics to understand long non-coding RNAs
Ulitsky, I. (2016) · Nature Reviews Genetics · doi:10.1038/nrg.2016.85 · Cited by 548
Immune Cytokines and Their Receptors in Inflammatory Pain
Cook, A. D., Christensen, A. D., Tewari, D., McMahon, S. B., & Hamilton, J. A. (2018) · Trends in Immunology · doi:10.1016/j.it.2017.12.003 · Cited by 275
Transcriptome Analysis of the Human Striatum in Tourette Syndrome
Lennington, J. B., Coppola, G., Kataoka-Sasaki, Y., Fernandez, T. V., Palejev, D., Li, Y., Huttner, A., Pletikos, M., Sestan, N., Leckman, J. F., et al. (2016) · Biological Psychiatry · doi:10.1016/j.biopsych.2014.07.018 · Cited by 211
Zhu, Y., Lyapichev, K. A., Lee, D. H., Motti, D., Ferraro, N. M., Zhang, Y., Yahn, S. L., Soderblom, C., Zha, J., Bethea, J. R., et al. (2017) · Journal of Neuroscience · doi:10.1523/jneurosci.2751-16.2017 · Cited by 130
Self-citation
Metadata
- Authors
- Lerch, J. K., Kuo, F., Motti, D., Morris, R., Bixby, J. L., & Lemmon, V. P.
- Affiliations
- University of Miami (US)
- Corresponding author
- Bixby, John L.
- Lemmon, Vance P.
- Venue
- PLoS ONE
- Publisher
- Public Library of Science (PLoS)
- Published
- 2012-01-17
- Volume
- 7
- Issue
- 1
- Pages
- e30417
- ISSN
- 1932-6203 (ISSN-L)
- PMC
- PMC3260295
- OpenAlex
- W2064384407
- Cited by
- 50
- References
- 62
- Citations by year
- 2026: 1 · 2023: 4 · 2022: 3 · 2021: 3 · 2020: 5 · 2018: 3 · 2017: 5 · 2016: 7 · 2015: 6 · 2014: 6 · 2013: 4 · 2012: 3
- FWCI
- 2.44
- Type
- journal article
- Language
- en
- Open access
- gold
- doi.org
- Locations
- PLoS ONE (publishedVersion, cc-by)
- Europe PMC (PubMed Central) (publishedVersion, cc-by)
- PubMed Central (publishedVersion, cc-by)
- PubMed (publishedVersion)
- DOAJ (DOAJ: Directory of Open Access Journals) (submittedVersion)
- Figshare (submittedVersion, cc-by)
- Funders
- National Institutes of Health (W81XWH, HD057632)
- National Institute of Neurological Disorders and Stroke (NS059866, R01NS059866)
- Eunice Kennedy Shriver National Institute of Child Health and Human Development (R01HD057632, HD057632)
- Topics
- Life Sciences › Biochemistry, Genetics and Molecular Biology › Molecular Biology › RNA Research and Splicing
- Life Sciences › Biochemistry, Genetics and Molecular Biology › Molecular Biology › Genomics and Phylogenetic Studies
- Life Sciences › Biochemistry, Genetics and Molecular Biology › Molecular Biology › Single-cell and spatial transcriptomics
- Keywords
- alternative splicing, isoform diversity, sensory neurons, neuronal gene expression, axon growth, transcription factor binding sites, microRNA binding sites, 3' untranslated region, cell type-specific gene expression, transcriptome
- MeSH terms
- Animals, Binding Sites, Cells, Cultured, Central Nervous System, Cerebellum, Ganglia, Spinal, Gene Expression Regulation, Mice, Inbred C57BL, Neurons, Sensory Receptor Cells, Transcription Factors, Cluster Analysis, Logistic Models, Open Reading Frames, Peripheral Nervous System, Protein Isoforms, 5' Untranslated Regions, Gene Expression Profiling, Transcription Initiation Site, MicroRNAs, Mice, Gene Regulatory Networks, High-Throughput Nucleotide Sequencing, Transcriptome
About these checks
Registry, retraction, Cites and statistics results are computed, not judged, with one exception: a printed reference that no index lists is read once by a model before it counts as a citation error. Claims are extracted by a model and kept only when their quote appears verbatim in the text; each cited source is then checked, with a model’s help, for whether it says what the claim relies on. Those verdicts can be wrong — read the claim’s quote and the cited source before relying on one.
Statistics and arithmetic are recomputed, not judged.
Confidence bands are shown only for fields calibrated on our annotated test set. None is calibrated yet, so no band is shown.
What counts as a claim ›How we measure confidence ›How we check this ›
Are you an author, or do you see a problem with this page? Request a review
