

The DOI matches its Crossref record; 34 of the 35 references it cites were found in a registry or an index.
Speech Graphs Provide a Quantitative Measure of Thought Disorder in Psychosis
Open accessAbstract
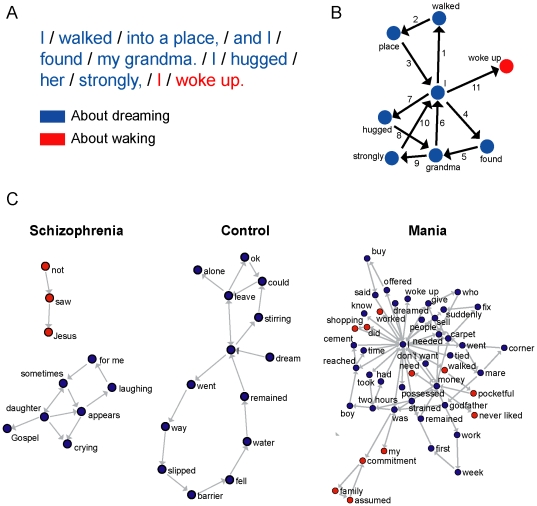
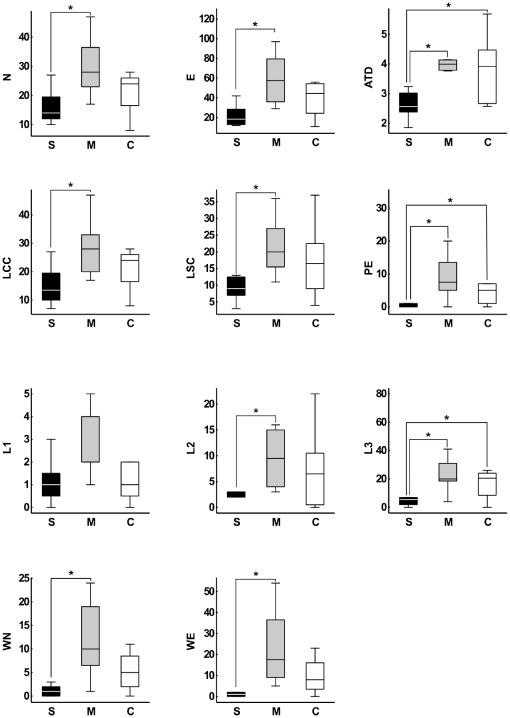
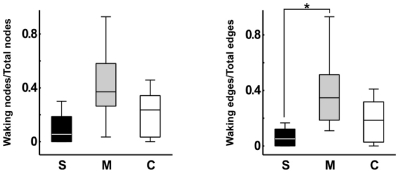
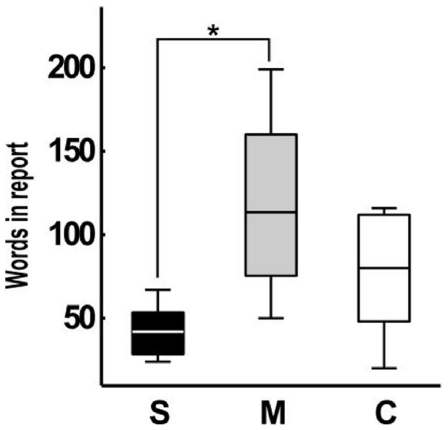
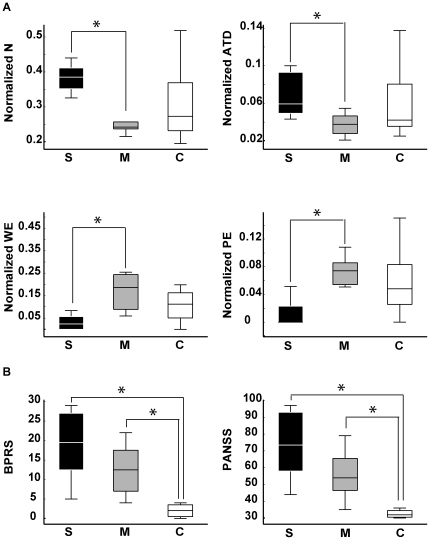
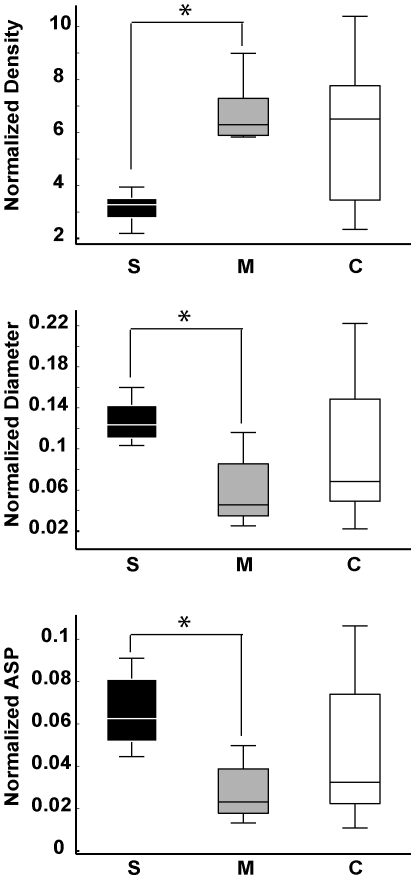
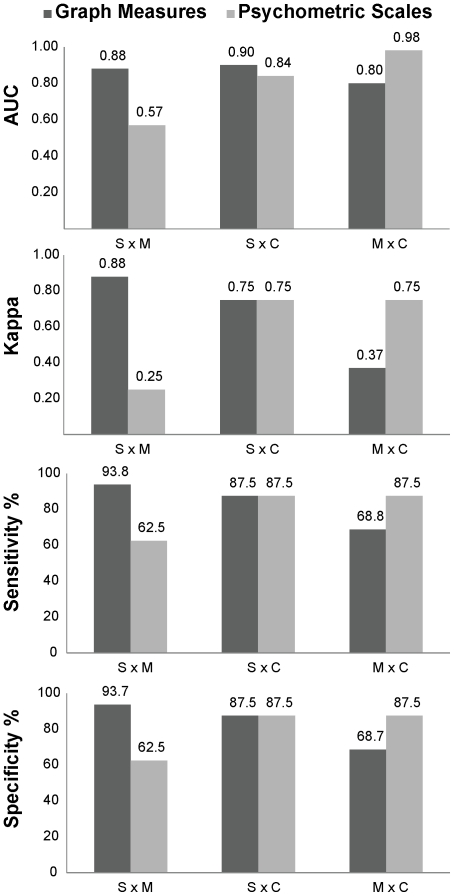
BACKGROUND: Psychosis has various causes, including mania and schizophrenia. Since the differential diagnosis of psychosis is exclusively based on subjective assessments of oral interviews with patients, an objective quantification of the speech disturbances that characterize mania and schizophrenia is in order. In principle, such quantification could be achieved by the analysis of speech graphs. A graph represents a network with nodes connected by edges; in speech graphs, nodes correspond to words and edges correspond to semantic and grammatical relationships. METHODOLOGY/PRINCIPAL FINDINGS: To quantify speech differences related to psychosis, interviews with schizophrenics, manics and normal subjects were recorded and represented as graphs. Manics scored significantly higher than schizophrenics in ten graph measures. Psychopathological symptoms such as logorrhea, poor speech, and flight of thoughts were grasped by the analysis even when verbosity differences were discounted. Binary classifiers based on speech graph measures sorted schizophrenics from manics with up to 93.8% of sensitivity and 93.7% of specificity. In contrast, sorting based on the scores of two standard psychiatric scales (BPRS and PANSS) reached only 62.5% of sensitivity and specificity. CONCLUSIONS/SIGNIFICANCE: The results demonstrate that alterations of the thought process manifested in the speech of psychotic patients can be objectively measured using graph-theoretical tools, developed to capture specific features of the normal and dysfunctional flow of thought, such as divergence and recurrence. The quantitative analysis of speech graphs is not redundant with standard psychometric scales but rather complementary, as it yields a very accurate sorting of schizophrenics and manics. Overall, the results point to automated psychiatric diagnosis based not on what is said, but on how it is said.
Overview
The claims and statistics of this paper haven’t been checked yet.
Run the check — free, no account needed. It reads the open-access text and checks the sources it cites.
Integrity signals
Registry
Cites
Statistics
Figures
Verification
Claims the paper makes
The claims and statistics of this paper haven’t been checked yet.
Run the check — free, no account needed. It reads the open-access text and checks the sources it cites.
Claims other papers make about this one
Each is checked against this paper’s own text: does it say what the citing paper says it does?
In the citing paper
“They noted that when using the tangentiality model of semantic coherence (i.e. regression of the coherence over time with the sliding window) of Elvevåg et al. [25] and the incoherence model of semantic coherence of Bedi et al. [16], they were unable to convincingly separate their clinical and control participants based on language analysis.”
From A Review of Automated Speech and Language Features for Assessment of Cognitive and Thought Disorders (2020) · cites this paper as [16]
In the citing paper
“The language features with the best predictive power in the classifier were the minimum coherence between consecutive phrases for each participant (maximum discontinuity) and the frequency of use of determiners (normalized by sentence length).”
From A Review of Automated Speech and Language Features for Assessment of Cognitive and Thought Disorders (2020) · cites this paper as [16]
In the citing paper
“This initial study only had 34 participants total (only 5 CHR+ participants) and was intended as a proof-of-principle exploration.”
From A Review of Automated Speech and Language Features for Assessment of Cognitive and Thought Disorders (2020) · cites this paper as [16]
Self-check
Percentages, sums and reported differences re-computed from the paper’s own numbers.
The self-check needs the paper’s full text.
Citations
Cites
A Coefficient of Agreement for Nominal Scales
Cohen, J. (1960) · Educational and Psychological Measurement · doi:10.1177/001316446002000104 · Cited by 42,398
(2003) · Journal of Machine Learning Research · doi:10.5555/944919.944937 · Cited by 32,337
Book Review: Pattern Recognition and Machine Learning
Nasrabadi, N. M. (2007) · Journal of Electronic Imaging · doi:10.1117/1.2819119 · Cited by 22,066
An introduction to ROC analysis
Fawcett, T. (2006) · Pattern Recognition Letters · doi:10.1016/j.patrec.2005.10.010 · Cited by 21,879
The Positive and Negative Syndrome Scale (PANSS) for schizophrenia.
Kay, S. R., Fiszbein, A., & Opler, L. A. (1987) · Schizophrenia Bulletin · doi:10.1093/schbul/13.2.261 · Cited by 21,378
Seel, N. M. (2012) · Springer eBooks · doi:10.1007/978-1-4419-1428-6_5195 · Cited by 19,482
The WEKA data mining software: an update
Hall, M., Frank, E., Holmes, G., Pfahringer, B., Reutemann, P., & Witten, I. H. (2009) · ACM SIGKDD Explorations Newsletter · doi:10.1145/1656274.1656278 · Cited by 17,750
Blei, D. M., Ng, A. Y., & Jordan, M. I. (2002) · The MIT Press eBooks · doi:10.7551/mitpress/1120.003.0082 · Cited by 12,683
Complex brain networks: graph theoretical analysis of structural and functional systems
Bullmore, E., & Sporns, O. (2009) · Nature Reviews Neuroscience · doi:10.1038/nrn2575 · Cited by 11,820
I.—COMPUTING MACHINERY AND INTELLIGENCE
TURING, A. M. (1950) · Mind · doi:10.1093/mind/lix.236.433 · Cited by 10,290
(2006) · Springer eBooks · Cited by 8,123
Russell, E. L., Chiang, L. H., & Braatz, R. D. (2000) · Advances in industrial control · doi:10.1007/978-1-4471-0409-4_3 · Cited by 7,938
Computing Machinery and Intelligence (1950)
Turing, A. M. (2004) · doi:10.1093/oso/9780198250791.003.0017 · Cited by 6,120
Supervised Machine Learning: A Review of Classification Techniques
Kotsiantis, S. B. (2007) · Informatica · Cited by 4,192
Bollobás, B. (1998) · Graduate texts in mathematics · doi:10.1007/978-1-4612-0619-4 · Cited by 3,867
Comprehensive Textbook of Psychiatry
Freedman, A. M., & Kaplan, H. I. (1967) · The American Journal of the Medical Sciences · doi:10.1097/00000441-196712000-00052 · Cited by 3,825
Estimating Continuous Distributions in Bayesian ClassifiersPreprint
John, G. H., & Pat Langley, B. (2013) · arXiv (Cornell University) · doi:10.48550/arxiv.1302.4964 · Cited by 2,914
Duda, R. O., Hart, P. E., & Stork, D. G. (2001) · Cited by 2,463
Insel, T. R. (2010) · Nature · doi:10.1038/nature09552 · Cited by 1,783
The Structured Clinical Interview for DSM-III-R (SCID)
Williams, J. B. W. (1992) · Archives of General Psychiatry · doi:10.1001/archpsyc.1992.01820080038006 · Cited by 1,641
Kaplan & Sadock's Comprehensive Textbook of Psychiatry
Sadock, B. J., & Sadock, V. A. (2000) · Cited by 1,523
The small world of human language
Ferrer‐i‐Cancho, R., & Solé, R. V. (2001) · Proceedings of the Royal Society B Biological Sciences · doi:10.1098/rspb.2001.1800 · Cited by 1,050
Revisiting the Foundations of Network Analysis
Butts, C. T. (2009) · Science · doi:10.1126/science.1171022 · Cited by 555
Bech, P., Kastrup, M., & Rafaelsen, O. J. (1986) · PubMed · Cited by 467
High interrater reliability for the Structured Clinical Interview for DSM-III-R Axis I (SCID-I)
Skre, I., Onstad, S., Torgersen, S., & Kringlen, E. (1991) · Acta Psychiatrica Scandinavica · doi:10.1111/j.1600-0447.1991.tb03123.x · Cited by 353
Global organization of the Wordnet lexicon
Sigman, M., & Cecchi, G. (2002) · Proceedings of the National Academy of Sciences · doi:10.1073/pnas.022341799 · Cited by 281
Self-citationMoretti, F. (2011) · New Left Review · doi:10.64590/vko · Cited by 180
Graph theoretic modeling of large-scale semantic networks
Bales, M. E., & Johnson, S. B. (2005) · Journal of Biomedical Informatics · doi:10.1016/j.jbi.2005.10.007 · Cited by 91
Thesaurus as a complex network
Holanda, A. D. J., Pisa, I. T., Kinouchi, O., Martinêz, A. S., & Ruiz, E. E. S. (2004) · Physica A Statistical Mechanics and its Applications · doi:10.1016/j.physa.2004.06.025 · Cited by 63
Self-citationIn retrospect: The five lives of the psychiatry manual
GRINKER, R. R. (2010) · Nature · doi:10.1038/468168a · Cited by 63
Ordered cyclic motifs contribute to dynamic stability in biological and engineered networks
Ma’ayan, A., Cecchi, G., Wagner, J., Rao, A. R., Iyengar, R., & Stolovitzky, G. A. (2008) · Proceedings of the National Academy of Sciences · doi:10.1073/pnas.0805344105 · Cited by 51
Self-citationUsing Computational Patients to Evaluate Illness Mechanisms in Schizophrenia
Hoffman, R. E., Grasemann, U., Gueorguieva, R. V., Quinlan, D. M., Lane, D., & Miikkulainen, R. (2011) · Biological Psychiatry · doi:10.1016/j.biopsych.2010.12.036 · Cited by 43
A Comparison of Induction Algorithms for Selective and non-Selective Bayesian Classifiers
Singh, M., & Provan, G. M. (1995) · Elsevier eBooks · doi:10.1016/b978-1-55860-377-6.50068-2 · Cited by 32
Scale-invariant transition probabilities in free word association trajectories
Costa, M. E. (2009) · Frontiers in Integrative Neuroscience · doi:10.3389/neuro.07.019.2009 · Cited by 16
Research works printed but not linked: 1
- MH First, 1990, Structured Clinical Interview for DSM-IV Axis I Disorders – Research Version, Patient Edition (SCID-I/P)
Cited by
Sorted by citations
Automated analysis of free speech predicts psychosis onset in high-risk youths
Bedi, G., Carrillo, F., Cecchi, G. A., Slezak, D. F., Sigman, M., Mota, N. B., Ribeiro, S., Javitt, D. C., Copelli, M., & Corcoran, C. M. (2015) · npj Schizophrenia · doi:10.1038/npjschz.2015.30 · Cited by 673
Self-citationPrediction of psychosis across protocols and risk cohorts using automated language analysis
Corcoran, C. M., Carrillo, F., Slezak, D. F., Bedi, G., Klim, C. C., Javitt, D. C., Bearden, C. E., & Cecchi, G. (2018) · World Psychiatry · doi:10.1002/wps.20491 · Cited by 381
Self-citationWang, X., & Krystal, J. H. (2014) · Neuron · doi:10.1016/j.neuron.2014.10.018 · Cited by 327
Rezaii, N., Walker, E. F., & Wolff, P. (2019) · Schizophrenia · doi:10.1038/s41537-019-0077-9 · Cited by 213
Language as a biomarker for psychosis: a natural language processing approach
Corcoran, C. M., Mittal, V. A., Bearden, C. E., E. Gur, R., Hitczenko, K., Bilgrami, Z., Savic, A., Cecchi, G. A., & Wolff, P. (2020) · Schizophrenia Research · doi:10.1016/j.schres.2020.04.032 · Cited by 186
Self-citation
Metadata
- Authors
- Mota, N. B., Vasconcelos, N. A. P., Lemos, N., Pieretti, A. C., Kinouchi, O., Cecchi, G. A., Copelli, M., & Ribeiro, S.
- Affiliations
- Universidade Federal do Rio Grande do Norte (BR)
- Universidade de São Paulo (BR)
- IBM Research - Thomas J. Watson Research Center (US)
- Universidade Federal de Pernambuco (BR)
- Corresponding author
- Ribeiro, Sidarta
- Venue
- PLoS ONE
- Publisher
- Public Library of Science (PLoS)
- Published
- 2012-04-09
- Volume
- 7
- Issue
- 4
- Pages
- e34928
- ISSN
- 1932-6203 (ISSN-L)
- PMC
- PMC3322168
- OpenAlex
- W2091298722
- Cited by
- 265
- References
- 35
- Citations by year
- 2026: 22 · 2025: 18 · 2024: 24 · 2023: 43 · 2022: 34 · 2021: 21 · 2020: 30 · 2019: 15 · 2018: 13 · 2017: 10 · 2016: 12 · 2015: 4 · 2014: 11 · 2013: 6 · 2012: 2
- FWCI
- 5.17
- Type
- journal article
- Language
- en
- Open access
- gold
- doi.org
- Locations
- PLoS ONE (publishedVersion, cc-by)
- Europe PMC (PubMed Central) (publishedVersion, cc-by)
- PubMed Central (publishedVersion, cc-by)
- PubMed (publishedVersion)
- Americanae (AECID Library) (publishedVersion, other-oa)
- LA Referencia (Red Federada de Repositorios Institucionales de Publicaciones Científicas) (publishedVersion, other-oa)
- Portuguese National Funding Agency for Science, Research and Technology (RCAAP Project by FCT) (publishedVersion)
- DOAJ (DOAJ: Directory of Open Access Journals) (submittedVersion, cc-by-sa)
- Figshare (submittedVersion, cc-by)
- Funders
- Governo Brasil
- Conselho Nacional de Desenvolvimento Científico e Tecnológico (481506/2007-1)
- Financiadora de Estudos e Projetos (01.06.1092.00)
- Universidade Federal do Rio Grande do Norte
- Topics
- Health Sciences › Medicine › Psychiatry and Mental health › Schizophrenia research and treatment
- Social Sciences › Psychology › Experimental and Cognitive Psychology › Mental Health Research Topics
- Social Sciences › Psychology › Social Psychology › Mental Health via Writing
- Keywords
- thought disorder, psychosis, schizophrenia, mania, differential diagnosis, graph theory, speech analysis, flight of ideas, automated psychiatric diagnosis, psychiatric symptoms
- MeSH terms
- Adult, Female, Humans, Male, Middle Aged, Psychiatric Status Rating Scales, Psychotic Disorders, Schizophrenia, Speech, Thinking, Young Adult
About these checks
Registry, retraction, Cites and statistics results are computed, not judged, with one exception: a printed reference that no index lists is read once by a model before it counts as a citation error. Claims are extracted by a model and kept only when their quote appears verbatim in the text; each cited source is then checked, with a model’s help, for whether it says what the claim relies on. Those verdicts can be wrong — read the claim’s quote and the cited source before relying on one.
Statistics and arithmetic are recomputed, not judged.
Confidence bands are shown only for fields calibrated on our annotated test set. None is calibrated yet, so no band is shown.
What counts as a claim ›How we measure confidence ›How we check this ›
Are you an author, or do you see a problem with this page? Request a review
