

The DOI matches its Crossref record; 27 of the 27 references it cites were found in a registry or an index.
Thought disorder measured as random speech structure classifies negative symptoms and schizophrenia diagnosis 6 months in advance
Open accessAbstract
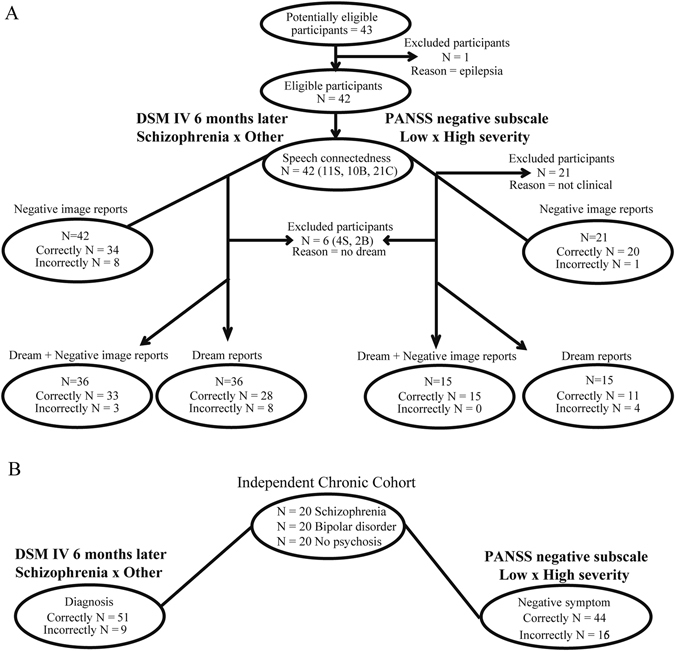
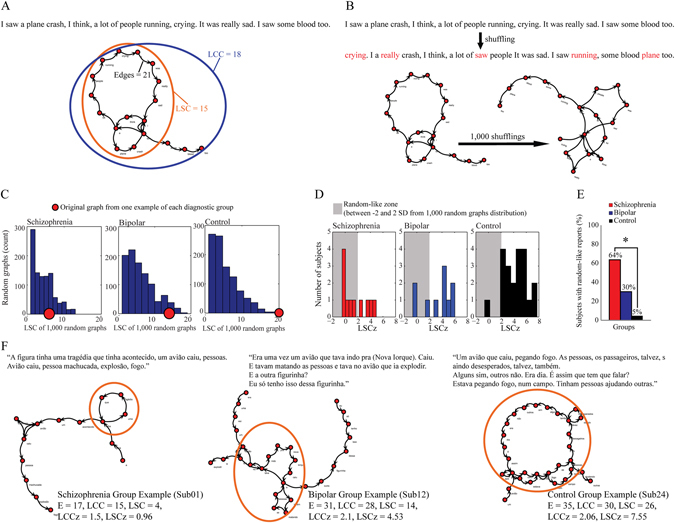
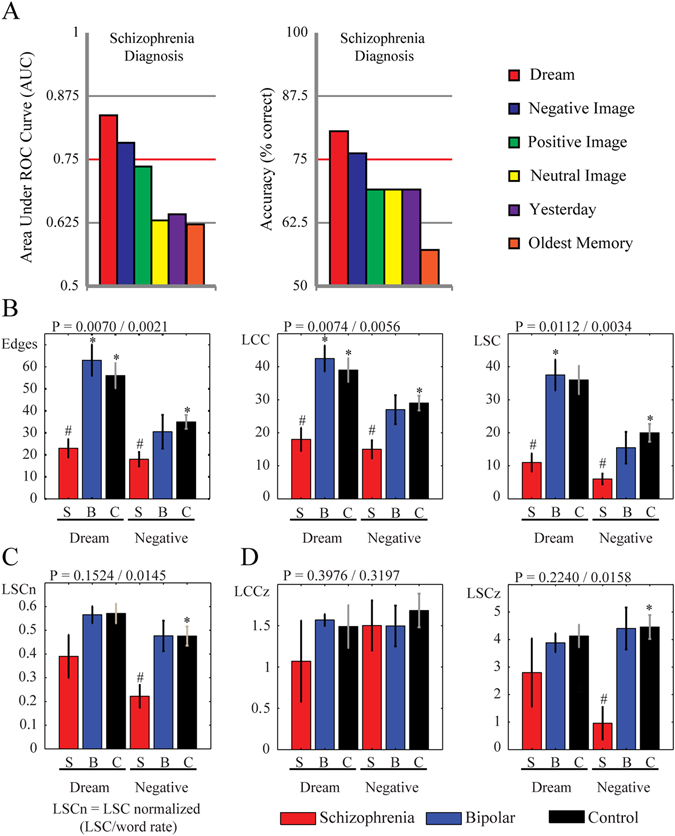
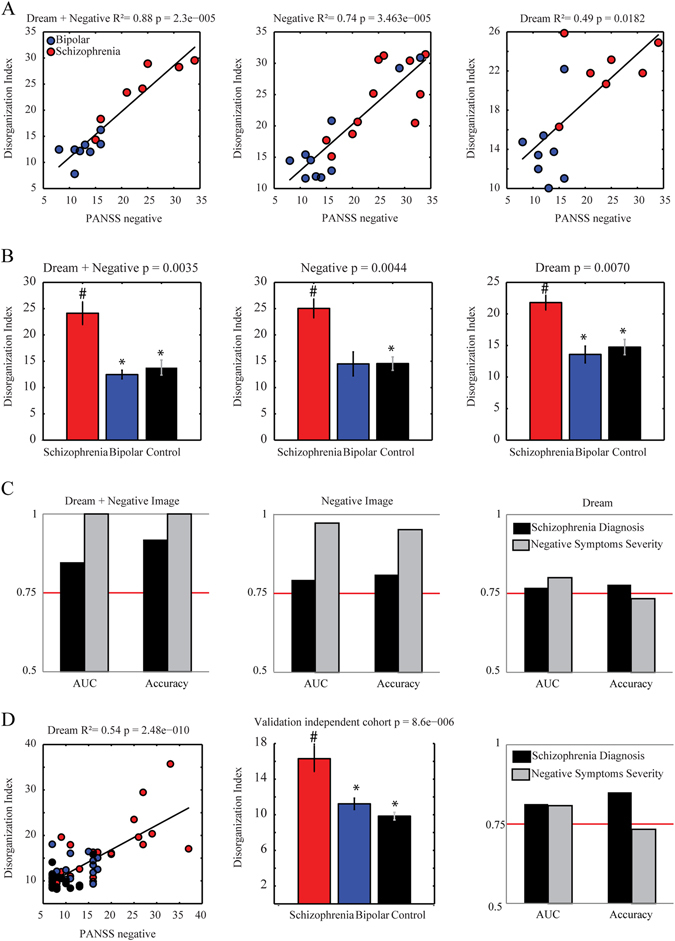
In chronic psychotic patients, word graph analysis shows potential as complementary psychiatric assessment. This analysis relies mostly on connectedness, a structural feature of speech that is anti-correlated with negative symptoms. Here we aimed to verify whether speech disorganization during the first clinical contact, as measured by graph connectedness, can correctly classify negative symptoms and the schizophrenia diagnosis 6 months in advance. Positive and negative syndrome scale scores and memory reports were collected from 21 patients undergoing first clinical contact for recent-onset psychosis, followed for 6 months to establish diagnosis, and compared to 21 well-matched healthy subjects. Each report was represented as a word-trajectory graph. Connectedness was measured by number of edges, number of nodes in the largest connected component and number of nodes in the largest strongly connected component. Similarities to random graphs were estimated. All connectedness attributes were combined into a single Disorganization Index weighted by the correlation with the positive and negative syndrome scale negative subscale, and used for classifications. Random-like connectedness was more prevalent among schizophrenia patients (64 × 5% in Control group, p = 0.0002). Connectedness from two kinds of memory reports (dream and negative image) explained 88% of negative symptoms variance (p < 0.0001). The Disorganization Index classified low vs. high severity of negative symptoms with 100% accuracy (area under the receiver operating characteristic curve = 1), and schizophrenia diagnosis with 91.67% accuracy (area under the receiver operating characteristic curve = 0.85). The index was validated in an independent cohort of chronic psychotic patients and controls (N = 60) (85% accuracy). Thus, speech disorganization during the first clinical contact correlates tightly with negative symptoms, and is quite discriminative of the schizophrenia diagnosis.
Overview
The claims and statistics of this paper haven’t been checked yet.
Free: it reads the open-access text and checks the first 5 claims that cite a source we can check. Create a free account to check every claim.
Integrity signals
Registry
Cites
Statistics
Figures
Verification
Claims the paper makes
The claims and statistics of this paper haven’t been checked yet.
Free: it reads the open-access text and checks the first 5 claims that cite a source we can check. Create a free account to check every claim.
Claims other papers make about this one
Each is checked against this paper’s own text: does it say what the citing paper says it does?
The source backs part of the claim, not all of it — or backs it for a different population, condition or comparison.
In the citing paper
“Third, it opens the door to voice or speech analysis, whereas features of the patient’s utterances can be passively monitored to derive health states [28-31].”
From Voice-Based Conversational Agents for the Prevention and Management of Chronic and Mental Health Conditions: Systematic Literature Review (2021) · cites this paper as [30]
Experimental — accuracy not yet measured
Self-check
Percentages, sums and reported differences re-computed from the paper’s own numbers.
The self-check needs the paper’s full text.
Citations
Cites
The Positive and Negative Syndrome Scale (PANSS) for schizophrenia.
Kay, S. R., Fiszbein, A., & Opler, L. A. (1987) · Schizophrenia Bulletin · doi:10.1093/schbul/13.2.261 · Cited by 21,378 · cited 1×
“The negative subscale measured seven symptoms: Blunted affect (N1), Emotional withdrawal (N2), Poor rapport (N3), Passive/apathetic social withdrawal (N4), Difficulty in abstract thinking (N5), Lack of spontaneity and flow of conversation (N6), Stereotyped thinking (N7).(28) Only one researcher performed PANSS scoring…”
The WEKA data mining software: an update
Hall, M., Frank, E., Holmes, G., Pfahringer, B., Reutemann, P., & Witten, I. H. (2009) · ACM SIGKDD Explorations Newsletter · doi:10.1145/1656274.1656278 · Cited by 17,750
Comprehensive Textbook of Psychiatry
Freedman, A. M., & Kaplan, H. I. (1967) · The American Journal of the Medical Sciences · doi:10.1097/00000441-196712000-00052 · Cited by 3,799
Looking at pictures: Affective, facial, visceral, and behavioral reactions
LANG, P. J., GREENWALD, M. K., BRADLEY, M. M., & HAMM, A. O. (1993) · Psychophysiology · doi:10.1111/j.1469-8986.1993.tb03352.x · Cited by 3,190
Biostatistics: A Foundation for Analysis in the Health Sciences.
Rosenfeld, B., & Daniel, W. W. (1984) · Journal of the American Statistical Association · doi:10.2307/2288760 · Cited by 2,834
The NIMH Research Domain Criteria (RDoC) Project: Precision Medicine for Psychiatry
Insel, T. R. (2014) · American Journal of Psychiatry · doi:10.1176/appi.ajp.2014.14020138 · Cited by 1,472 · cited 1×
“This raises the point that precise behavioral measurements are more likely to describe symptomatology than standard diagnosis.(20) Importantly, it was possible to correctly classify schizophrenia diagnosis and negative symptom severity using the Disorganization Index from dream reports of an independent cohort of chro…”
Computational psychiatry as a bridge from neuroscience to clinical applications
Huys, Q. J. M., Maia, T. V., & Frank, M. J. (2016) · Nature Neuroscience · doi:10.1038/nn.4238 · Cited by 1,002
Automated analysis of free speech predicts psychosis onset in high-risk youths
Bedi, G., Carrillo, F., Cecchi, G. A., Slezak, D. F., Sigman, M., Mota, N. B., Ribeiro, S., Javitt, D. C., Copelli, M., & Corcoran, C. M. (2015) · npj Schizophrenia · doi:10.1038/npjschz.2015.30 · Cited by 673
Self-citationWhitaker, K. J., Vértes, P. E., Romero-Garcia, R., Váša, F., Moutoussis, M., Prabhu, G., Weiskopf, N., Callaghan, M. F., Wagstyl, K., Rittman, T., et al. (2016) · Proceedings of the National Academy of Sciences · doi:10.1073/pnas.1601745113 · Cited by 520
Thought, Language, and Communication in Schizophrenia: Diagnosis and Prognosis
Andreasen, N. C., & Grove, W. M. (1986) · Schizophrenia Bulletin · doi:10.1093/schbul/12.3.348 · Cited by 385
Research works printed but not linked: 2
- Mota, N. B., Carrillo, F., Slezak, D. F., Copelli, M. & Ribeiro, S. in Fiftieth Asilomar Conference on Signals, Systems and Computers. (IEEE Conference Publishing).
- First, M. H., Spitzer, R. L., Gibbon, M. & Williams, J. Structured clinical interview for DSM-IV Axis I disorders -- Research version, patient edition (SCID-I/P). (Biometrics Research, New York State Psychiatric Institute, 1990).
Cited by
Rezaii, N., Walker, E., & Wolff, P. (2019) · npj Schizophrenia · doi:10.1038/s41537-019-0077-9 · Cited by 203
“In an analysis of the speech, Mota et al. 13 could distinguish those with mania from schizophrenia by drawing on a set of ten different graph measures with 93.7% accuracy.”
BackgroundMethodInfluentialLanguage as a biomarker for psychosis: a natural language processing approach
Corcoran, C. M., Mittal, V. A., Bearden, C. E., E. Gur, R., Hitczenko, K., Bilgrami, Z., Savic, A., Cecchi, G. A., & Wolff, P. (2020) · Schizophrenia Research · doi:10.1016/j.schres.2020.04.032 · Cited by 186
Evaluation of Speech-Based Digital Biomarkers: Review and Recommendations
Robin, J., Harrison, J. E., Kaufman, L. D., Rudzicz, F., Simpson, W., & Yancheva, M. (2020) · Digital Biomarkers · doi:10.1159/000510820 · Cited by 171
Corcoran, C. M., & Cecchi, G. (2020) · Biological Psychiatry Cognitive Neuroscience and Neuroimaging · doi:10.1016/j.bpsc.2020.06.004 · Cited by 203
A survey on big data-driven digital phenotyping of mental health
Liang, Y., Zheng, X., & Zeng, D. D. (2019) · Information Fusion · doi:10.1016/j.inffus.2019.04.001 · Cited by 158
Metadata
- Authors
- Mota, N. B., Copelli, M., & Ribeiro, S.
- Affiliations
- Universidade Federal do Rio Grande do Norte (BR)
- Universidade Federal de Pernambuco (BR)
- Corresponding author
- Mota, Natália B.
- Venue
- npj Schizophrenia
- Published
- 2017-04-13
- Volume
- 3
- Issue
- 1
- Pages
- 18-18
- ISSN
- 2334-265X (ISSN-L)
- PMC
- PMC5441540
- OpenAlex
- W2604132829
- Cited by
- 157
- References
- 27
- Citations by year
- 2026: 10 · 2025: 13 · 2024: 17 · 2023: 29 · 2022: 32 · 2021: 17 · 2020: 20 · 2019: 11 · 2018: 5 · 2017: 3
- FWCI
- 8.76
- Type
- journal article
- Language
- en
- Open access
- gold
- doi.org
- Licence
- cc-by
- creativecommons.org/licenses/by/4.0 (tdm)
- creativecommons.org/licenses/by/4.0 (vor)
- Locations
- Schizophrenia (publishedVersion, cc-by)
- Europe PMC (PubMed Central) (publishedVersion, other-oa)
- PubMed Central (publishedVersion, cc-by)
- PubMed (publishedVersion)
- LA Referencia (Red Federada de Repositorios Institucionales de Publicaciones Científicas) (publishedVersion, other-oa)
- Americanae (AECID Library) (submittedVersion, other-oa)
- DOAJ (DOAJ: Directory of Open Access Journals) (submittedVersion, cc-by-sa)
- Funders
- Fundação de Amparo à Pesquisa do Estado de São Paulo (2013-07699-0, 13/07699-0)
- Coordenação de Aperfeiçoamento de Pessoal de Nível Superior (2013/07699-0, 0898/2013, 308775/2015-5, 408145/2016-1, 062/2015, OBEDUC-ACERTA 0898/2013)
- Conselho Nacional de Desenvolvimento Científico e Tecnológico (2013/07699–0, 308775/20155, 408145/2016-1)
- Universidade Federal do Rio Grande do Norte
- Topics
- Health Sciences › Medicine › Psychiatry and Mental health › Schizophrenia research and treatment
- Social Sciences › Psychology › Experimental and Cognitive Psychology › Mental Health Research Topics
- Social Sciences › Arts and Humanities › Philosophy › Mental Health and Psychiatry
- Keywords
- thought disorder, graph connectivity, negative symptoms, schizophrenia diagnosis, early diagnosis, recent-onset psychosis, memory reports, chronic psychosis
About these checks
Registry, retraction, Cites and statistics results are computed, not judged, with one exception: a printed reference that no index lists is read once by a model before it counts as a citation error. Claims are extracted by a model and kept only when their quote appears verbatim in the text; each cited source is then checked, with a model’s help, for whether it says what the claim relies on. Those verdicts can be wrong — read the claim’s quote and the cited source before relying on one.
Statistics and arithmetic are recomputed, not judged.
Confidence bands are shown only for fields calibrated on our annotated test set. None is calibrated yet, so no band is shown.
What counts as a claim ›How we measure confidence ›How we check this ›
Are you an author, or do you see a problem with this page? Request a review
How to cite
Cite CoChat for the checks on this page, and the paper for its own findings.
- This page
- CoChat. (2026). Citation check: Thought disorder measured as random speech structure classifies negative symptoms and schizophrenia diagnosis 6 months in advance. https://app.cochat.ai/papers/10.1038/s41537-017-0019-3
- The paper
- Mota, N. B., Copelli, M., & Ribeiro, S. (2017). Thought disorder measured as random speech structure classifies negative symptoms and schizophrenia diagnosis 6 months in advance. npj Schizophrenia. https://doi.org/10.1038/s41537-017-0019-3
Data sources
Bibliographic data: Semantic Scholar, OpenAlex, Crossref.
Contains information from the Semantic Scholar Academic Graph Datasets, made available under the ODC Attribution License (ODC-BY 1.0).
Semantic Scholar’s data is described in: Kinney, R., et al. (2023). The Semantic Scholar Open Data Platform. arXiv:2301.10140.
