

A Hybrid Least Squares and Principal Component Analysis Algorithm for Raman Spectroscopy
Open accessThe DOI matches its Crossref record; 14 of the 14 references it cites were found in a registry or an index.
Abstract
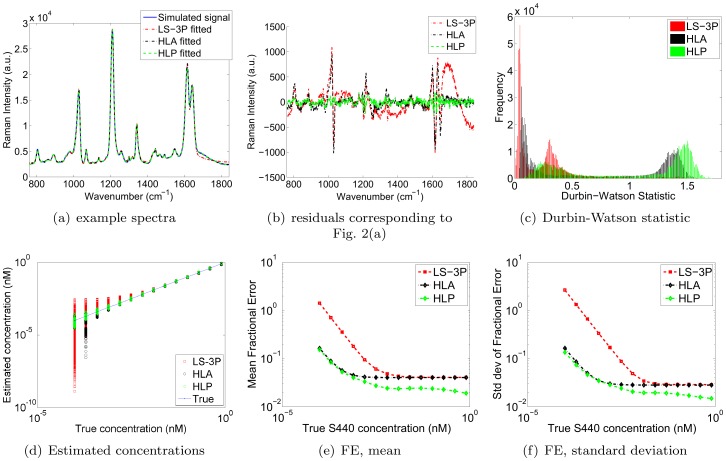
Raman spectroscopy is a powerful technique for detecting and quantifying analytes in chemical mixtures. A critical part of Raman spectroscopy is the use of a computer algorithm to analyze the measured Raman spectra. The most commonly used algorithm is the classical least squares method, which is popular due to its speed and ease of implementation. However, it is sensitive to inaccuracies or variations in the reference spectra of the analytes (compounds of interest) and the background. Many algorithms, primarily multivariate calibration methods, have been proposed that increase robustness to such variations. In this study, we propose a novel method that improves robustness even further by explicitly modeling variations in both the background and analyte signals. More specifically, it extends the classical least squares model by allowing the declared reference spectra to vary in accordance with the principal components obtained from training sets of spectra measured in prior characterization experiments. The amount of variation allowed is constrained by the eigenvalues of this principal component analysis. We compare the novel algorithm to the least squares method with a low-order polynomial residual model, as well as a state-of-the-art hybrid linear analysis method. The latter is a multivariate calibration method designed specifically to improve robustness to background variability in cases where training spectra of the background, as well as the mean spectrum of the analyte, are available. We demonstrate the novel algorithm's superior performance by comparing quantitative error metrics generated by each method. The experiments consider both simulated data and experimental data acquired from in vitro solutions of Raman-enhanced gold-silica nanoparticles.
Overview
The claims and statistics of this paper haven’t been checked yet.
Free: it reads the open-access text and checks the first 5 claims that cite a source we can check. Create a free account to check every claim.
Integrity signals
Registry
Cites
Statistics
Figures



Verification
Claims the paper makes
The claims and statistics of this paper haven’t been checked yet.
Free: it reads the open-access text and checks the first 5 claims that cite a source we can check. Create a free account to check every claim.
Claims other papers make about this one
Each is checked against this paper’s own text: does it say what the citing paper says it does?
The cited source says what the claim attributes to it.
In the citing paper
“Fitting spectra with a matrix of averaged references augmented with eigenvectors of the pure datasets comprises the hybrid least-squares, principal component analysis (PCA) algorithm (HLP) introduced by Van de Sompel et al. expressly for Raman spectroscopy to account for substances’ characteristic spectral variance.38”
From Assessment of unmixing approaches for the quantitation of SERS nanoparticles in highly multiplexed spectral images (2024) · cites this paper as [38]
Self-check
Percentages, sums and reported differences re-computed from the paper’s own numbers.
The self-check needs the paper’s full text.
Citations
Cites
Partial least-squares regression: a tutorial
Geladi, P., & Kowalski, B. R. (1986) · Analytica Chimica Acta · doi:10.1016/0003-2670(86)80028-9 · Cited by 6,992
Haaland, D. M., & Thomas, E. V. (1988) · Analytical Chemistry · doi:10.1021/ac00162a020 · Cited by 2,539
Baseline correction using adaptive iteratively reweighted penalized least squares
Zhang, Z.-M., Chen, S., & Liang, Y.-Z. (2010) · The Analyst · doi:10.1039/b922045c · Cited by 1,124
Automated Method for Subtraction of Fluorescence from Biological Raman Spectra
Lieber, C. A., & Mahadevan-Jansen, A. (2003) · Applied Spectroscopy · doi:10.1366/000370203322554518 · Cited by 1,049
Automated Autofluorescence Background Subtraction Algorithm for Biomedical Raman Spectroscopy
Zhao, J., Lui, H., McLean, D. I., & Zeng, H. (2007) · Applied Spectroscopy · doi:10.1366/000370207782597003 · Cited by 810
Zavaleta, C. L., Smith, B. R., Walton, I., Doering, W., Davis, G., Shojaei, B., Natan, M. J., & Gambhir, S. S. (2009) · Proceedings of the National Academy of Sciences · doi:10.1073/pnas.0813327106 · Cited by 714
Self-citationNoninvasive molecular imaging of small living subjects using Raman spectroscopy
Keren, S., Zavaleta, C., Cheng, Z., de la Zerda, A., Gheysens, O., & Gambhir, S. S. (2008) · Proceedings of the National Academy of Sciences · doi:10.1073/pnas.0710575105 · Cited by 604
Self-citationNanobiotechnology: the promise and reality of new approaches to molecular recognition
Fortina, P., Kricka, L. J., Surrey, S., & Grodzinski, P. (2005) · Trends in Biotechnology · doi:10.1016/j.tibtech.2005.02.007 · Cited by 241
Faber, K., & Kowalski, B. R. (1997) · Journal of Chemometrics · doi:10.1002/(sici)1099-128x(199705)11:3<181::aid-cem459>3.0.co;2-7 · Cited by 237
Spectral Analysis of Multiplex Raman Probe Signatures
Lutz, B. R., Dentinger, C. E., Nguyen, L. N., Sun, L., Zhang, J., Allen, A. N., Chan, S., & Knudsen, B. S. (2008) · ACS Nano · doi:10.1021/nn800243g · Cited by 135
Cited by
Cutshaw, G., Uthaman, S., Hassan, N., Kothadiya, S., Wen, X., & Bardhan, R. (2023) · Chemical Reviews · doi:10.1021/acs.chemrev.2c00897 · Cited by 199
Ong, Y. H., Lim, M., & Liu, Q. (2012) · Optics Express · doi:10.1364/oe.20.022158 · Cited by 161
Karim, M., Ganose, A. M., Pieters, L., Leung, W. W. W., Wade, J., Zhang, L., Scanlon, D. O., & Palgrave, R. G. (2019) · Chemistry of Materials · doi:10.1021/acs.chemmater.9b03267 · Cited by 147
Pan, L., Zhang, P., Daengngam, C., Peng, S., & Chongcheawchamnan, M. (2022) · Journal of Raman Spectroscopy · doi:10.1002/jrs.6225 · Cited by 116
Wang, Y., Kang, S., Khan, A., Ruttner, G., Leigh, S. Y., Murray, M., Abeytunge, S., Peterson, G., Rajadhyaksha, M., Dintzis, S., et al. (2016) · Scientific Reports · doi:10.1038/srep21242 · Cited by 113
Metadata
- Authors
- Van de Sompel, D., Garai, E., Zavaleta, C., & Gambhir, S. S.
- Affiliations
- Stanford Medicine (US)
- Corresponding author
- Gambhir, Sanjiv Sam
- Venue
- PLoS ONE
- Publisher
- Public Library of Science (PLoS)
- Published
- 2012-06-18
- Volume
- 7
- Issue
- 6
- Pages
- e38850
- ISSN
- 1932-6203 (ISSN-L)
- PMC
- PMC3377733
- OpenAlex
- W2019737081
- Semantic Scholar
- 67aeedfb36b4be429dc16c9ba0988ef08ae61fa5
- Cited by
- 39
- References
- 14
- Citations by year
- 2026: 1 · 2025: 2 · 2024: 3 · 2023: 2 · 2022: 2 · 2021: 4 · 2020: 4 · 2019: 3 · 2018: 2 · 2017: 3 · 2016: 1 · 2015: 3 · 2014: 3 · 2013: 5 · 2012: 1
- FWCI
- 3.75
- Type
- journal article
- Language
- en
- Open access
- gold
- doi.org
- Locations
- PLoS ONE (publishedVersion, cc-by)
- Europe PMC (PubMed Central) (publishedVersion, cc-by)
- PubMed Central (publishedVersion, cc-by)
- PubMed (publishedVersion)
- RePEc: Research Papers in Economics (submittedVersion)
- DOAJ (DOAJ: Directory of Open Access Journals) (submittedVersion, cc-by-sa)
- Funders
- Peter Michael Foundation
- Canary Foundation
- National Cancer Institute (P50CA114747, ICMIC P50 CA114747, T U54 U54CA151459, U54 U54CA151459, U54CA151459)
- Topics
- Physical Sciences › Chemistry › Analytical Chemistry › Spectroscopy and Chemometric Analyses
- Life Sciences › Biochemistry, Genetics and Molecular Biology › Biophysics › Spectroscopy Techniques in Biomedical and Chemical Research
- Physical Sciences › Mathematics › Statistics and Probability › Advanced Statistical Methods and Models
- Keywords
- Raman spectroscopy, classical least squares, multivariate calibration, background variation, eigenvalue constraints
- MeSH terms
- Algorithms, Animals, Computer Simulation, Gold, Silicon Dioxide, Spectrum Analysis, Raman, Least-Squares Analysis, Principal Component Analysis, Nanoparticles
About these checks
Registry, retraction, Cites and statistics results are computed, not judged, with one exception: a printed reference that no index lists is read once by a model before it counts as a citation error. Claims are extracted by a model and kept only when their quote appears verbatim in the text; each cited source is then checked, with a model’s help, for whether it says what the claim relies on. Those verdicts can be wrong — read the claim’s quote and the cited source before relying on one.
Statistics and arithmetic are recomputed, not judged.
Confidence bands are shown only for fields calibrated on our annotated test set. None is calibrated yet, so no band is shown.
What counts as a claim ›How we measure confidence ›How we check this ›
Are you an author, or do you see a problem with this page? Request a review
How to cite
Cite CoChat for the checks on this page, and the paper for its own findings.
- This page
- CoChat. (2026). Citation check: A Hybrid Least Squares and Principal Component Analysis Algorithm for Raman Spectroscopy. https://app.cochat.ai/papers/10.1371/journal.pone.0038850
- The paper
- Van de Sompel, D., Garai, E., Zavaleta, C., & Gambhir, S. S. (2012). A Hybrid Least Squares and Principal Component Analysis Algorithm for Raman Spectroscopy. PLoS ONE. https://doi.org/10.1371/journal.pone.0038850
Data sources
Bibliographic data: Semantic Scholar, OpenAlex, Crossref.
Contains information from the Semantic Scholar Academic Graph Datasets, made available under the ODC Attribution License (ODC-BY 1.0).
Semantic Scholar’s data is described in: Kinney, R., et al. (2023). The Semantic Scholar Open Data Platform. arXiv:2301.10140.
