

The DOI matches its Crossref record; 44 of the 44 references it cites were found in a registry or an index.
From Single Molecule Fluctuations to Muscle Contraction: A Brownian Model of A.F. Huxley's Hypotheses
Open accessAbstract
Muscular force generation in response to external stimuli is the result of thermally fluctuating, cyclical interactions between myosin and actin, which together form the actomyosin complex. Normally, these fluctuations are modelled using transition rate functions that are based on muscle fiber behaviour, in a phenomenological fashion. However, such a basis reduces the predictive power of these models. As an alternative, we propose a model which uses direct single molecule observations of actomyosin fluctuations reported in the literature. We precisely estimate the actomyosin potential bias and use diffusion theory to obtain a brownian ratchet model that reproduces the complete cross-bridge cycle. The model is validated by simulating several macroscopic experimental conditions, while its interpretation is compatible with two different force-generating scenarios.
Overview
The claims and statistics of this paper haven’t been checked yet.
Run the check — free, no account needed. It reads the open-access text and checks the sources it cites.
Integrity signals
Registry
Cites
Statistics
Figures
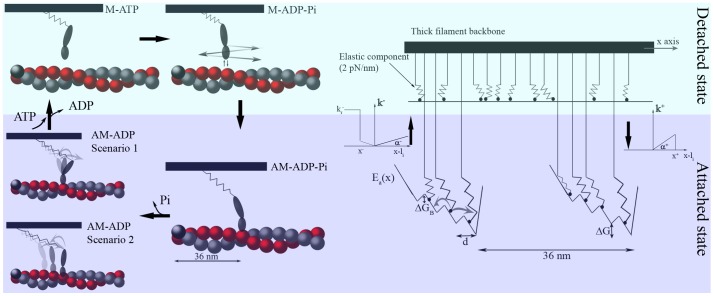
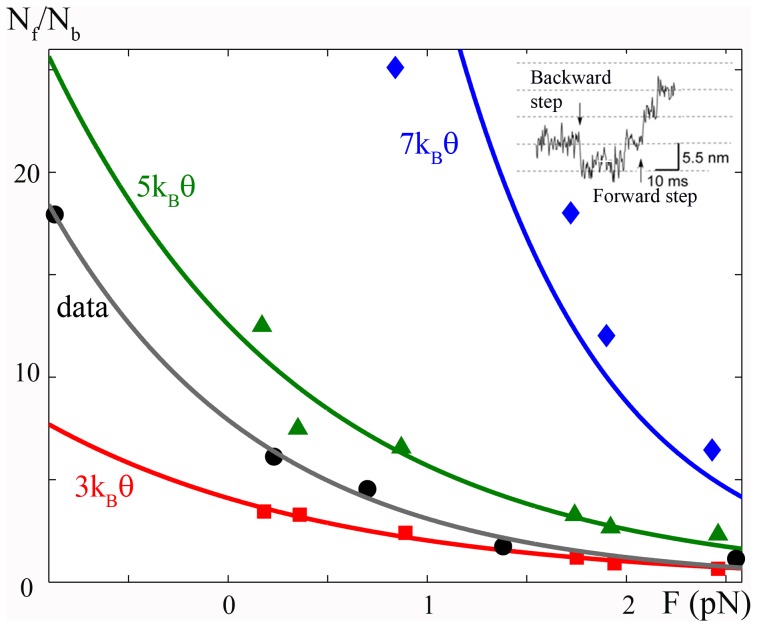
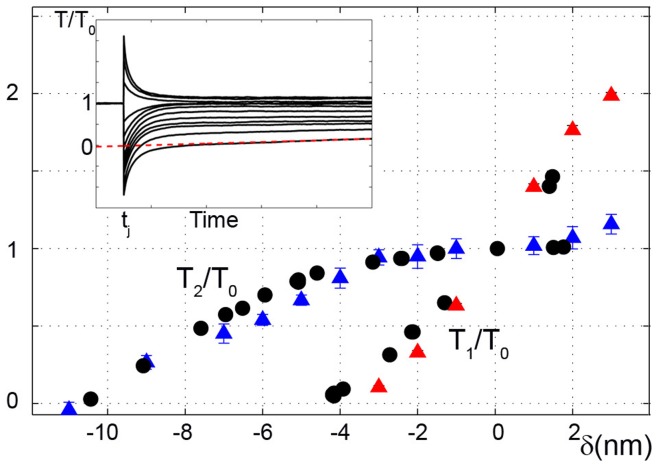
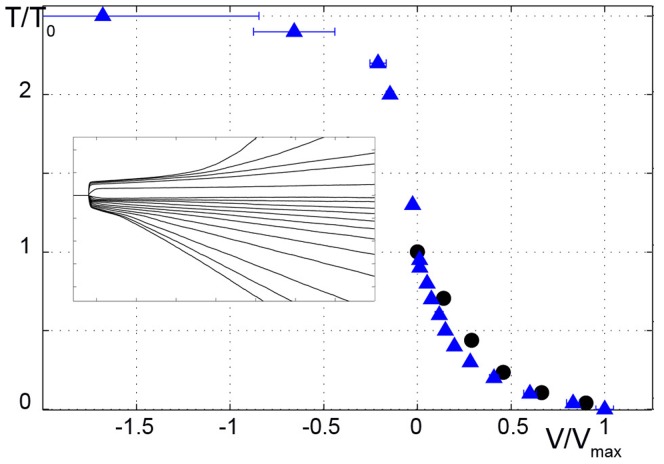
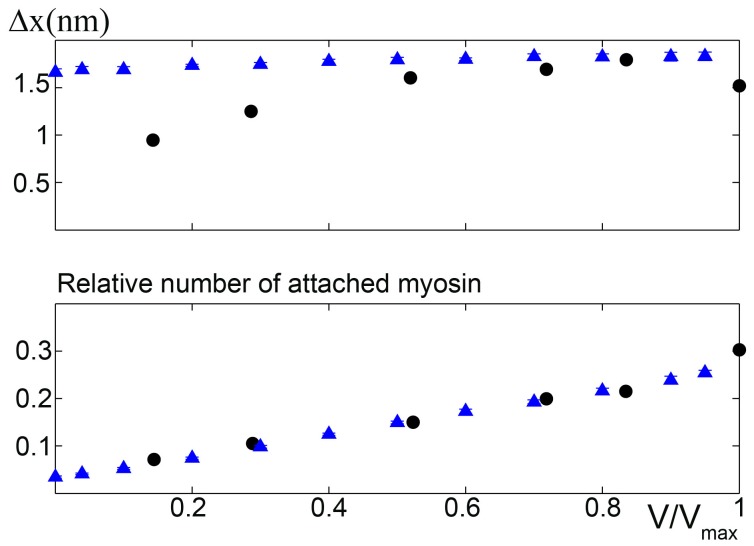
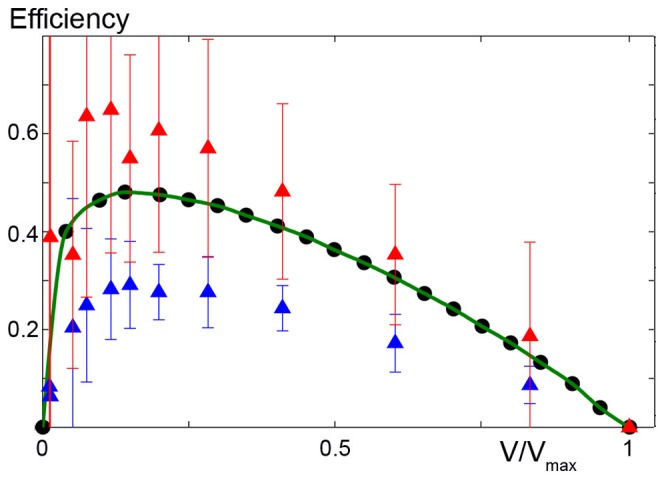
Verification
Claims the paper makes
The claims and statistics of this paper haven’t been checked yet.
Run the check — free, no account needed. It reads the open-access text and checks the sources it cites.
Claims other papers make about this one
Each is checked against this paper’s own text: does it say what the citing paper says it does?
In the citing paper
“In the classic example of muscle contraction as biomolecular machines, the release of chemical energy is often accompanied by thermal fluctuation, which can transform muscular force generated in response to external stimuli through cyclical interactions between myosin and actin.539”
From Protein Ensembles: How Does Nature Harness Thermodynamic Fluctuations for Life? The Diverse Functional Roles of Conformational Ensembles in the Cell (2016) · cites this paper as [539]
Self-check
Percentages, sums and reported differences re-computed from the paper’s own numbers.
The self-check needs the paper’s full text.
Citations
Cites
Handbook of Stochastic Methods
Gardiner, C. W. (1983) · Springer series in synergetics · doi:10.1007/978-3-662-02377-8 · Cited by 6,085
Handbook of Stochastic Methods for Physics, Chemistry and the Natural Sciences
Gardiner, C. W. (1985) · Springer series in synergetics · doi:10.1007/978-3-662-02452-2 · Cited by 3,748
The heat of shortening and the dynamic constants of muscle
Hill, A. V. (1938) · Proceedings of the Royal Society of London. Series B - Biological Sciences · doi:10.1098/rspb.1938.0050 · Cited by 3,669
Handbook of Stochastic Methods
Gardiner, C. W. (2004) · Springer series in synergetics · doi:10.1007/978-3-662-05389-8 · Cited by 3,468
Mechanics of Motor Proteins and the Cytoskeleton
Howard, & Clark (2002) · Applied Mechanics Reviews · doi:10.1115/1.1451234 · Cited by 2,909
Muscle Structure and Theories of Contraction
Huxley, A. F. (1957) · Progress in Biophysics and Biophysical Chemistry · doi:10.1016/s0096-4174(18)30128-8 · Cited by 2,318
Proposed Mechanism of Force Generation in Striated Muscle
Huxley, A. F., & Simmons, R. M. (1971) · Nature · doi:10.1038/233533a0 · Cited by 2,276
Three-dimensional structure of myosin subfragment-1: a molecular motor
Rayment, I., Rypniewski, W. R., Schmidt‐Bäse, K., Smith, R., Tomchick, D. R., Benning, M. M., Winkelmann, D. A., Wesenberg, G. E., & Holden, H. M. (1993) · Science · doi:10.1126/science.8316857 · Cited by 2,054
Single myosin molecule mechanics: piconewton forces and nanometre steps
Finer, J. T., Simmons, R. M., & Spudich, J. A. (1994) · Nature · doi:10.1038/368113a0 · Cited by 1,945
The Mechanism of Muscular Contraction
Huxley, H. E. (1969) · Science · doi:10.1126/science.164.3886.1356 · Cited by 1,945
Cited by
Sorted by citations
Items 101–115 of 115
Verma, N. R., Naik, G., Patel, S., Padhi, P., Naik, T., & Nanda, R. (2021) · Egyptian Pediatric Association Gazette · doi:10.1186/s43054-021-00080-0 · Cited by 4
Elevated RGMA Expression Predicts Poor Prognosis in Patients with Glioblastoma
Phan, T. L., Kim, H., Lee, S. J., Choi, M., & Kim, S.-H. (2021) · OncoTargets and Therapy · doi:10.2147/ott.s317285 · Cited by 3
Abuaish, S., & McGowan, P. O. (2017) · Springer eBooks · doi:10.1007/978-3-319-60289-9_17 · Cited by 6
Adam, R., Schaeffer, D. J., Johnston, K., Menon, R. S., & Everling, S. (2021) · NeuroImage · doi:10.1016/j.neuroimage.2021.117919 · Cited by 3
Clinico-radiological profile of the patients with empyema thoracis: A prospective analytical study
Shekhar, H., Sharma, N., Singh, S. K., Garg, P. K., Bhatt, S., Saha, R., & Verma, A. (2021) · Indian Journal of Tuberculosis · doi:10.1016/j.ijtb.2021.03.007 · Cited by 3
Multi-scale Biophysical Principles in Clinical Irreversible Electroporation
Sweeney, D. C., Neal, R. E., & Davalos, R. V. (2017) · Springer eBooks · doi:10.1007/978-3-319-55113-5_3 · Cited by 3
Ultra-fast force-clamp spectroscopy data on the interaction between skeletal muscle myosin and actin
Maffei, M., Beneventi, D., Canepari, M., Bottinelli, R., Pavone, F. S., & Capitanio, M. (2019) · Data in Brief · doi:10.1016/j.dib.2019.104017 · Cited by 3
dos Santos, T. R. M., da Silva, A. C. G., de Carvalho, F. S., Lobón, G. S., Vaz, B. G., Lião, L. M., Menegatti, R., & Valadares, M. C. (2018) · Chemico-Biological Interactions · doi:10.1016/j.cbi.2018.07.004 · Cited by 2
Kimmig, F., Moireau, P., & Dominique Chapelle, A. (2021) · Computational Mechanics · doi:10.1007/s00466-021-02051-z · Cited by 2
Marcucci, L., & Yanagida, T. (2013) · Physical Review E · doi:10.1103/physreve.87.062711 · Cited by 2
Self-citationUnrevealed part of myosin's powerstroke accounts for high efficiency of muscle contraction
Bibó, A., Károlyi, G., & Kovács, M. (2017) · Biochimica et Biophysica Acta (BBA) - General Subjects · doi:10.1016/j.bbagen.2017.05.024 · Cited by 2
Premature ventricular complexes: How benign are they in epilepsy?
Pansani, A. P., Sonoda, E. Y. F., Scorza, F. A., & Colugnati, D. B. (2015) · Epilepsy & Behavior · doi:10.1016/j.yebeh.2015.08.016 · Cited by 1
Functional Roles of Yuragi in Biosystems
Yanagida, T., & Murata, T. (2020) · Springer eBooks · doi:10.1007/978-981-33-4976-6_2 · Cited by 1
Self-citationA Dynamic Escape Problem of Molecular Motors
Culver, D. R., Glaz, B. J., & Stanton, S. C. (2019) · Journal of Biomechanical Engineering · doi:10.1115/1.4044580 · Cited by 1
Pierce, S. (2025) · Life · doi:10.3390/life15121914
“Note that within myocytes (contractile muscle cells), Brownian motion and ATP hydrolysis induce the single myosin molecules to pull against actin, evident collectively at the macroscopic scale literally as the physical force with which the muscle contracts [40].”
Metadata
- Authors
- Marcucci, L., & Yanagida, T.
- Affiliations
- The University of Osaka (JP)
- RIKEN (JP)
- Corresponding author
- Marcucci, Lorenzo
- ORCID
- Marcucci, Lorenzo
- Venue
- PLoS ONE
- Publisher
- Public Library of Science (PLoS)
- Published
- 2012-07-16
- Volume
- 7
- Issue
- 7
- Pages
- e40042
- ISSN
- 1932-6203 (ISSN-L)
- PMC
- PMC3397984
- OpenAlex
- W2100332633
- Cited by
- 115
- References
- 44
- Citations by year
- 2025: 1 · 2024: 1 · 2023: 2 · 2021: 21 · 2020: 10 · 2019: 13 · 2018: 10 · 2017: 22 · 2016: 16 · 2015: 8 · 2014: 5 · 2013: 4 · 2012: 2
- FWCI
- 3.91
- Type
- journal article
- Language
- en
- Open access
- gold
- doi.org
- Locations
- PLoS ONE (publishedVersion, cc-by)
- Europe PMC (PubMed Central) (publishedVersion, cc-by)
- PubMed Central (publishedVersion, cc-by)
- PubMed (publishedVersion)
- Padua Research Archive (University of Padova) (submittedVersion, cc-by)
- RePEc: Research Papers in Economics (submittedVersion)
- DOAJ (DOAJ: Directory of Open Access Journals) (submittedVersion, cc-by-sa)
- Figshare (submittedVersion, cc-by)
- Funders
- Ministry of Education, Culture, Sports, Science and Technology
- Topics
- Health Sciences › Medicine › Cardiology and Cardiovascular Medicine › Cardiomyopathy and Myosin Studies
- Physical Sciences › Physics and Astronomy › Statistical and Nonlinear Physics › Advanced Thermodynamics and Statistical Mechanics
- Physical Sciences › Physics and Astronomy › Statistical and Nonlinear Physics › stochastic dynamics and bifurcation
- Keywords
- muscle contraction, actomyosin, cross-bridge cycling, Huxley model, potential bias, diffusion theory, actin-myosin interaction, muscle force production
- MeSH terms
- Actomyosin, Diffusion, Models, Biological, Muscle Contraction, Sarcomeres, Temperature, Thermodynamics
About these checks
Registry, retraction, Cites and statistics results are computed, not judged, with one exception: a printed reference that no index lists is read once by a model before it counts as a citation error. Claims are extracted by a model and kept only when their quote appears verbatim in the text; each cited source is then checked, with a model’s help, for whether it says what the claim relies on. Those verdicts can be wrong — read the claim’s quote and the cited source before relying on one.
Statistics and arithmetic are recomputed, not judged.
Confidence bands are shown only for fields calibrated on our annotated test set. None is calibrated yet, so no band is shown.
What counts as a claim ›How we measure confidence ›How we check this ›
Are you an author, or do you see a problem with this page? Request a review
