

The DOI matches its Crossref record; 48 of the 48 references it cites were found in a registry or an index.
Temporal Changes in Cell Marker Expression and Cellular Infiltration in a Controlled Cortical Impact Model in Adult Male C57BL/6 Mice
Open accessAbstract
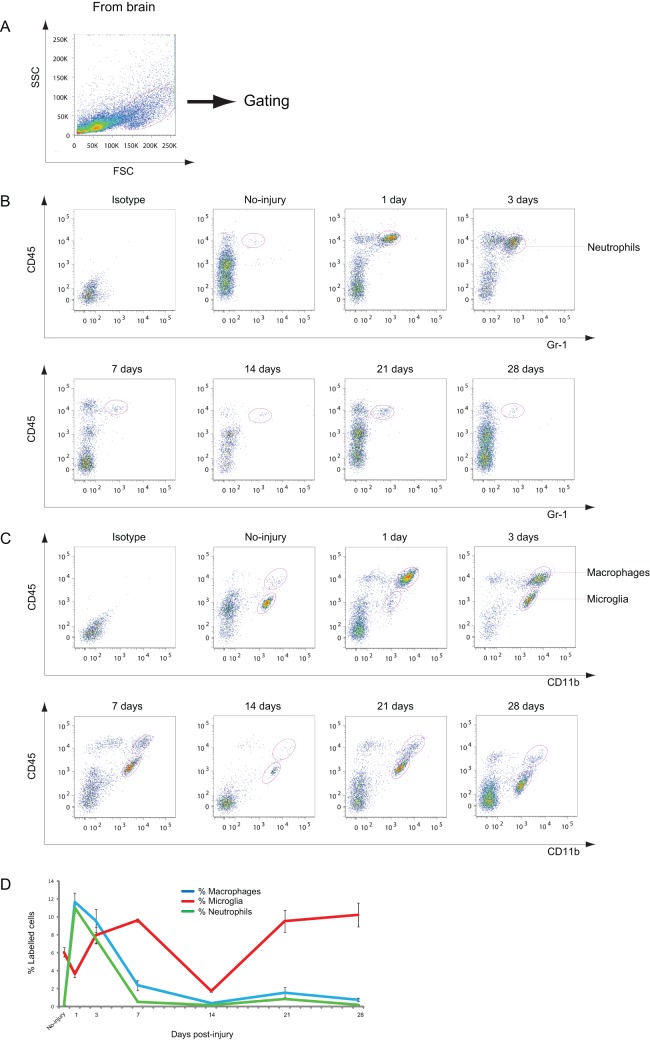
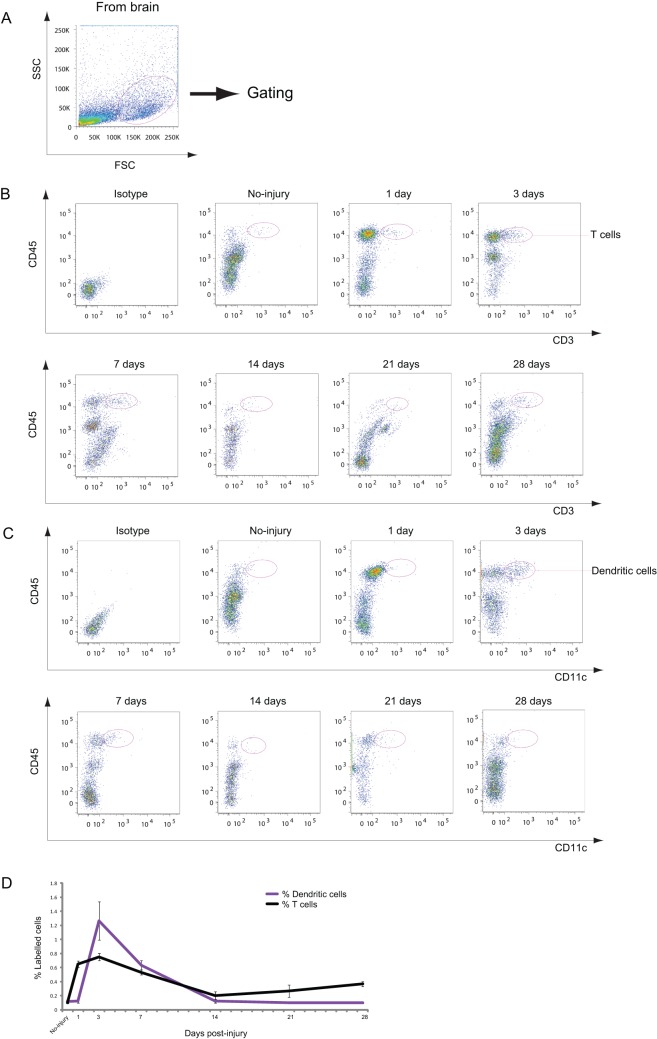
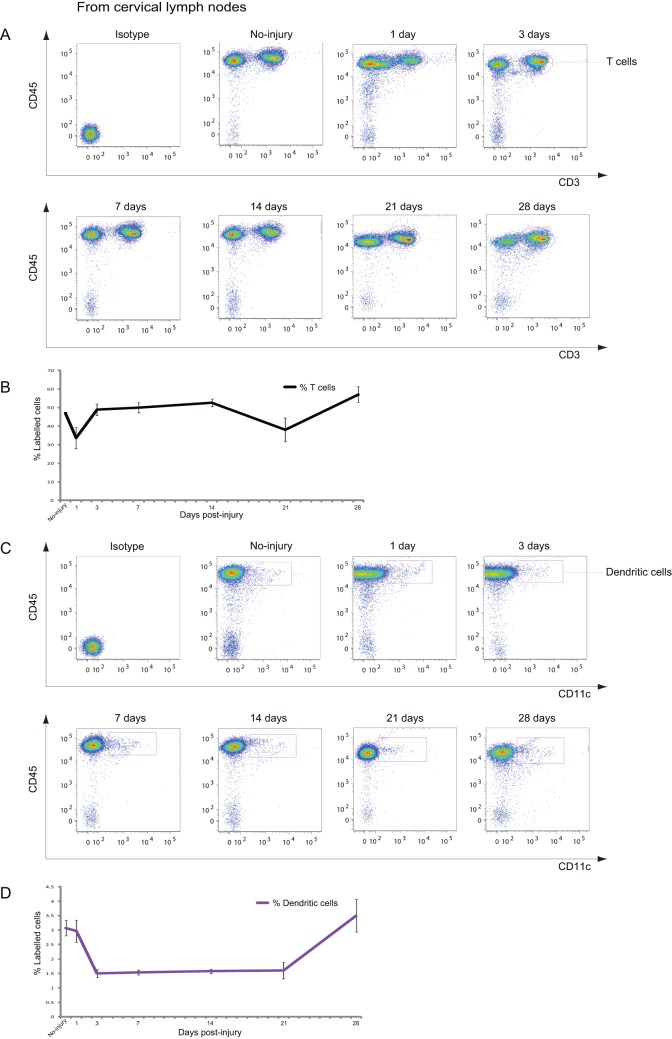
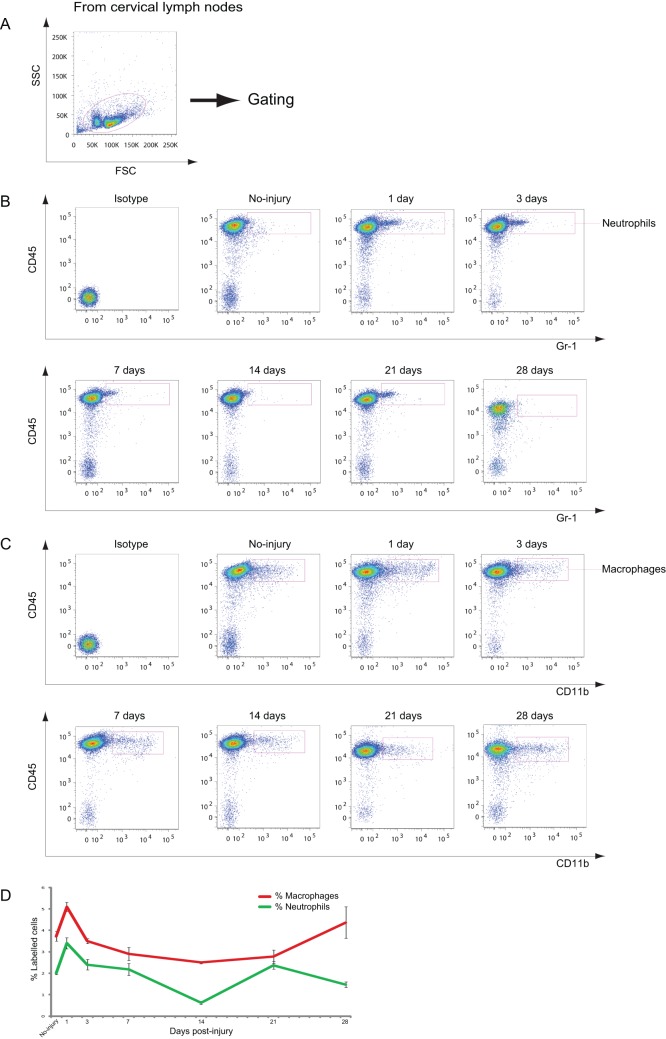
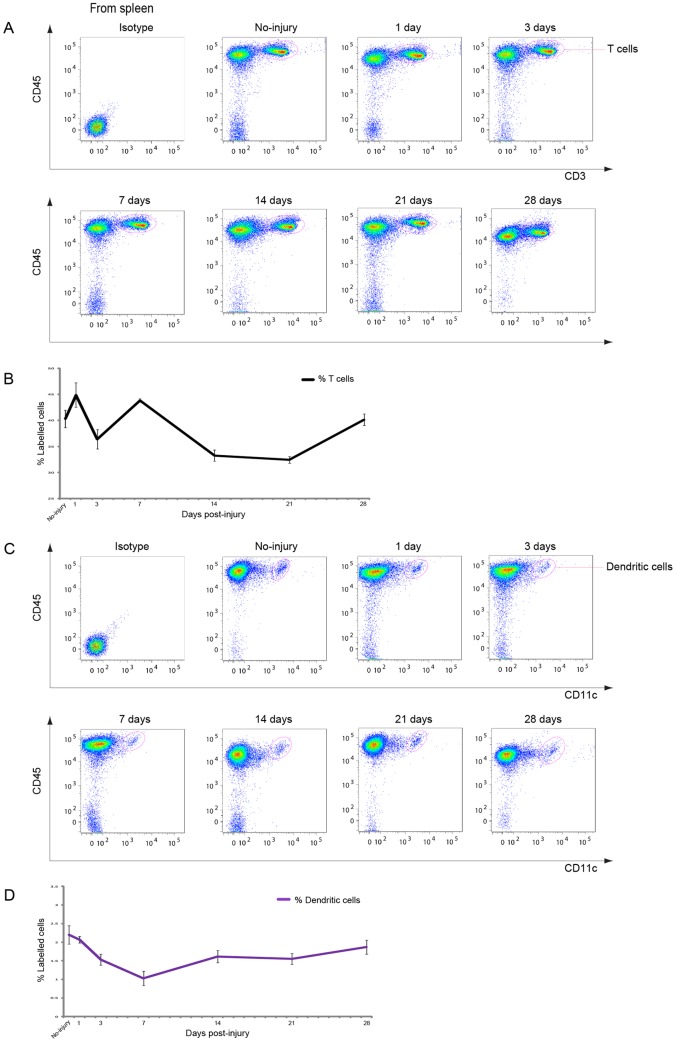
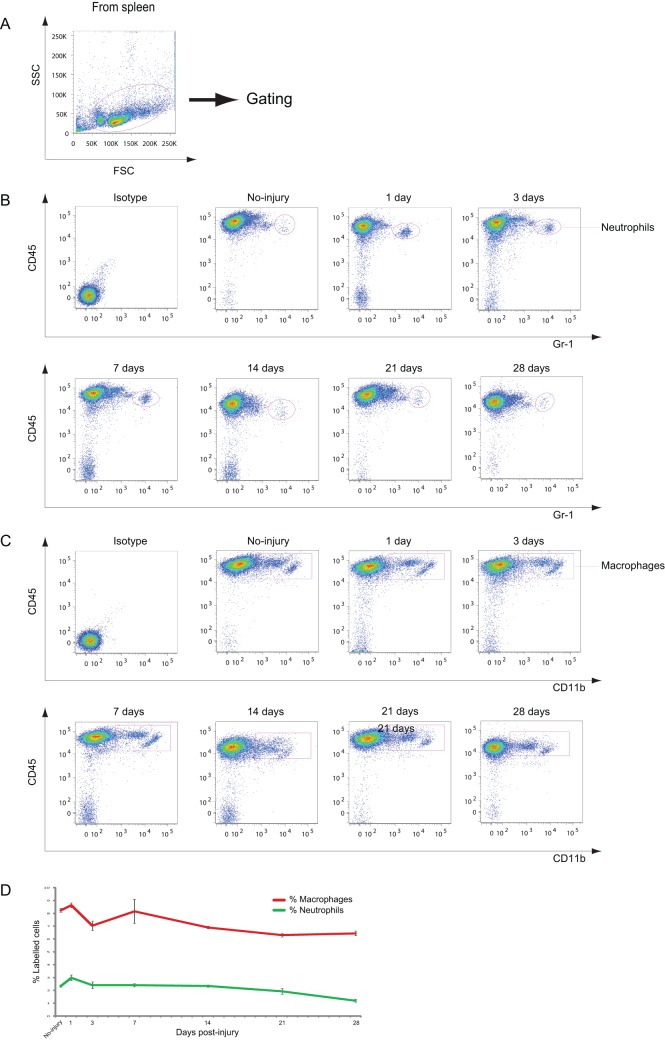
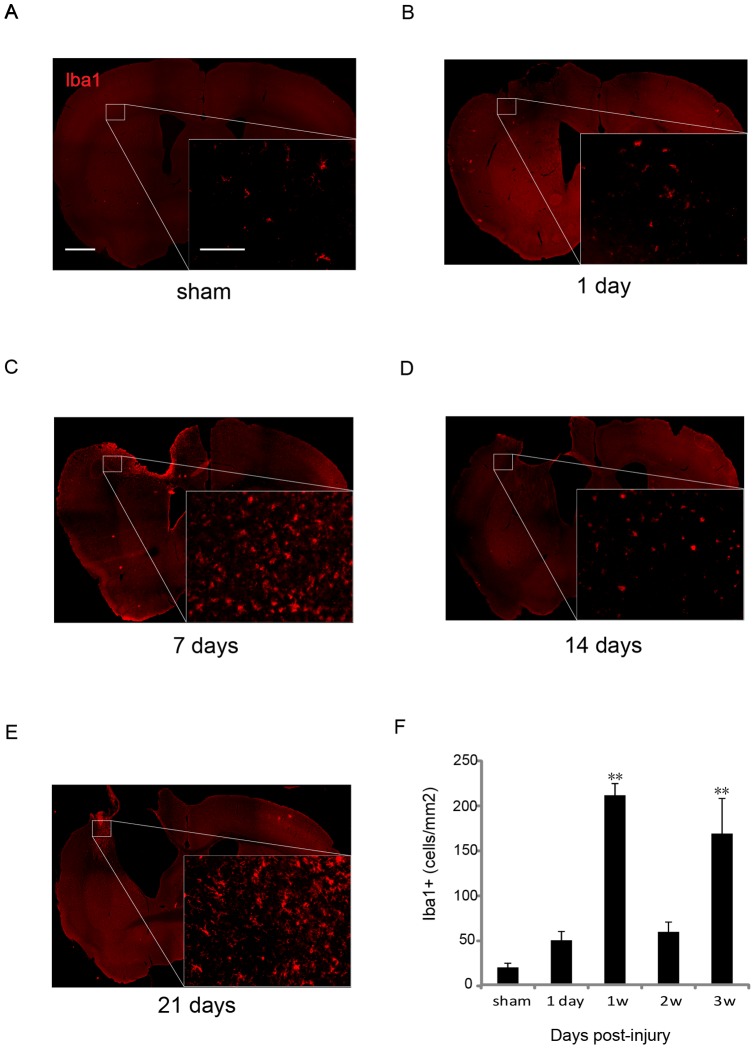
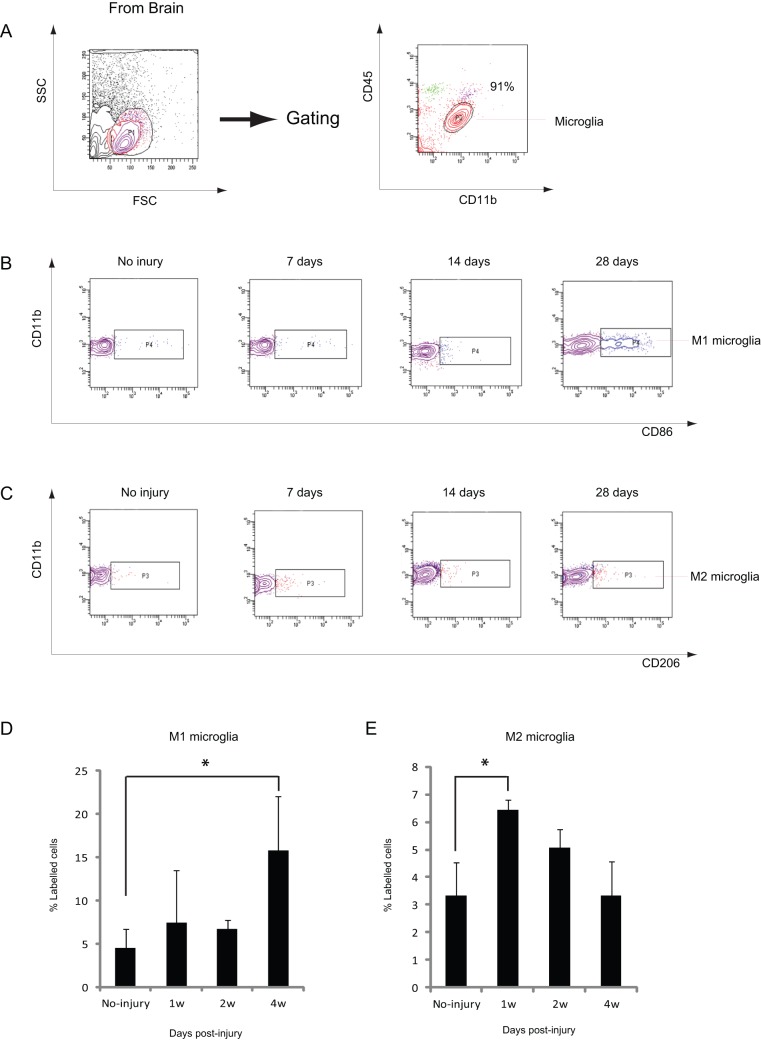
BACKGROUND: Traumatic injury to the central nervous system (CNS) triggers a robust inflammatory response that leads to axonal damage and secondary degeneration of spared tissue. In contrast, some immune responses have neuroprotective effects. However, detailed information regarding the dynamics of immune responses after traumatic CNS injury is still unavailable. METHODS: In the present study, changes in the immune cells present in the injured brain, spleen, and cervical lymph nodes (CLNs), which are draining lymphatic organs from the CNS, were analyzed after controlled cortical impact (CCI) by flow cytometry and immunohistochemistry. RESULTS: The number of neutrophils and macrophages that infiltrated the injured brain immediately increased 1 d post-injury and declined rapidly thereafter. In the injured brain, resident microglia showed a bimodal increase during the first week and in the chronic phase (≥3 weeks) after injury. Increase in the Iba-1(+) microglia/macrophages was observed around the injured site. Morphologic analysis showed that Iba-1(+) cells were round at 1 week, whereas those at 3 weeks were more ramified. Furthermore, CD86(+)/CD11b(+) M1-like microglia increased at 4 weeks after CCI, whereas CD206(+)/CD11b(+) M2-like microglia increased at 1 week. These results suggest that different subsets of microglia increased in the acute and chronic phases after CCI. Dendritic cells and T cells increased transiently within 1 week in the injured brain. In the CLNs and the spleen, T cells showed dynamic changes after CCI. In particular, the alteration in the number of T cells in the CLNs showed a similar pattern, with a 1-week delay, to that of microglia in the injured brain. CONCLUSION: The data from this study provide useful information on the dynamics of immune cells in CNS injuries.
Overview
The claims and statistics of this paper haven’t been checked yet.
Run the check — free, no account needed. It reads the open-access text and checks the sources it cites.
Integrity signals
Registry
Cites
Statistics
Figures
Verification
Claims the paper makes
The claims and statistics of this paper haven’t been checked yet.
Run the check — free, no account needed. It reads the open-access text and checks the sources it cites.
Claims other papers make about this one
Each is checked against this paper’s own text: does it say what the citing paper says it does?
In the citing paper
“Microglia associated with the long-term inflammatory phenotype following TBI are commonly defined as MHC-II/CD86/Cd11b positive, with upregulated expression of NOX24, Tlr4, Trem2, CD68, Clec7a, and Stat1, and higher expression of interferon- and immune-associated signaling genes [100,112,115,116].”
From Untangling senescent and damage‐associated microglia in the aging and diseased brain (2023) · cites this paper as [116]
Self-check
Percentages, sums and reported differences re-computed from the paper’s own numbers.
The self-check needs the paper’s full text.
Citations
Cites
The chemokine system in diverse forms of macrophage activation and polarization
MANTOVANI, A., SICA, A., SOZZANI, S., ALLAVENA, P., VECCHI, A., & LOCATI, M. (2004) · Trends in Immunology · doi:10.1016/j.it.2004.09.015 · Cited by 6,534
Kettenmann, H., Hanisch, U.-K., Noda, M., & Verkhratsky, A. (2011) · Physiological Reviews · doi:10.1152/physrev.00011.2010 · Cited by 3,547
The blood-brain barrier/neurovascular unit in health and disease
Hawkins, B. T., & Davis, T. P. (2005) · Pharmacological Reviews · doi:10.1124/pr.57.2.4 · Cited by 2,661
Kigerl, K. A., Gensel, J. C., Ankeny, D. P., Alexander, J. K., Donnelly, D. J., & Popovich, P. G. (2009) · The Journal of Neuroscience · doi:10.1523/jneurosci.3257-09.2009 · Cited by 2,130
Aloisi, F. (2001) · Glia · doi:10.1002/glia.1106 · Cited by 1,310
Three or more routes for leukocyte migration into the central nervous system
Ransohoff, R. M., Kivisäkk, P., & Kidd, G. (2003) · Nature Reviews Immunology · doi:10.1038/nri1130 · Cited by 1,052
Donnelly, D. J., & Popovich, P. G. (2008) · Experimental Neurology · doi:10.1016/j.expneurol.2007.06.009 · Cited by 995
Dendritic cells permit immune invasion of the CNS in an animal model of multiple sclerosis
Greter, M., Heppner, F. L., Lemos, M. P., Odermatt, B. M., Goebels, N., Laufer, T., Noelle, R. J., & Becher, B. (2005) · Nature Medicine · doi:10.1038/nm1197 · Cited by 862
Regulation of innate immune responses in the brain
Rivest, S. (2009) · Nature Reviews Immunology · doi:10.1038/nri2565 · Cited by 843
Shichita, T., Sugiyama, Y., Ooboshi, H., Sugimori, H., Nakagawa, R., Takada, I., Iwaki, T., Okada, Y., Iida, M., Cua, D. J., et al. (2009) · Nature Medicine · doi:10.1038/nm.1999 · Cited by 842
Cited by
Sorted by citations
The far-reaching scope of neuroinflammation after traumatic brain injury
Simon, D. W., McGeachy, M. J., Bayır, H., Clark, R. S. B., Loane, D. J., & Kochanek, P. M. (2017) · Nature Reviews Neurology · doi:10.1038/nrneurol.2017.13 · Cited by 1,190
Chakarov, S., Lim, H. Y., Tan, L., Lim, S. Y., See, P., Lum, J., Zhang, X.-M., Foo, S., Nakamizo, S., Duan, K., et al. (2019) · Science · doi:10.1126/science.aau0964 · Cited by 1,114
Zhou, W., Ke, S. Q., Huang, Z., Flavahan, W., Fang, X., Paul, J., Wu, L., Sloan, A. E., McLendon, R. E., Li, X., et al. (2015) · Nature Cell Biology · doi:10.1038/ncb3090 · Cited by 940
Microglia in the TBI brain: The good, the bad, and the dysregulated
Loane, D. J., & Kumar, A. (2015) · Experimental Neurology · doi:10.1016/j.expneurol.2015.08.018 · Cited by 850
The contribution of astrocytes and microglia to traumatic brain injury
Karve, I. P., Taylor, J. M., & Crack, P. J. (2015) · British Journal of Pharmacology · doi:10.1111/bph.13125 · Cited by 675
Metadata
- Authors
- Jin, X., Ishii, H., Bai, Z., Itokazu, T., & Yamashita, T.
- Affiliations
- Japan Science and Technology Agency (JP)
- Yunnan Agricultural University (CN)
- Corresponding author
- Yamashita, Toshihide
- Venue
- PLoS ONE
- Publisher
- Public Library of Science (PLoS)
- Published
- 2012-07-24
- Volume
- 7
- Issue
- 7
- Pages
- e41892
- ISSN
- 1932-6203 (ISSN-L)
- PMC
- PMC3404031
- OpenAlex
- W2025828188
- Cited by
- 211
- References
- 48
- Citations by year
- 2026: 7 · 2025: 9 · 2024: 13 · 2023: 13 · 2022: 20 · 2021: 22 · 2020: 23 · 2019: 20 · 2018: 13 · 2017: 19 · 2016: 9 · 2015: 17 · 2014: 10 · 2013: 14 · 2012: 1
- FWCI
- 8.78
- Type
- journal article
- Language
- en
- Open access
- gold
- doi.org
- Locations
- PLoS ONE (publishedVersion, cc-by)
- Europe PMC (PubMed Central) (publishedVersion, cc-by)
- PubMed Central (publishedVersion, cc-by)
- PubMed (publishedVersion)
- DOAJ (DOAJ: Directory of Open Access Journals) (submittedVersion, cc-by-sa)
- Funders
- Japan Science and Technology Agency (CREST)
- Core Research for Evolutional Science and Technology
- Topics
- Health Sciences › Medicine › Clinical Neurology › Traumatic Brain Injury and Neurovascular Disturbances
- Life Sciences › Neuroscience › Neurology › Neuroinflammation and Neurodegeneration Mechanisms
- Health Sciences › Medicine › Clinical Neurology › Traumatic Brain Injury Research
- Keywords
- controlled cortical impact, traumatic brain injury, microglia, macrophages, M1/M2 microglial polarization, dendritic cells, T cells, neutrophils, cervical lymph nodes, spleen, immune cell infiltration, neuroinflammation, Iba1, CD86, CD206
- MeSH terms
- Aging, Animals, Calcium-Binding Proteins, Cerebral Cortex, Dendritic Cells, Disease Models, Animal, Immunohistochemistry, Lymph Nodes, Macrophages, Male, Mice, Inbred C57BL, Microfilament Proteins, Neutrophils, Spleen, T-Lymphocytes, Time Factors, Biomarkers, Microglia, Mice
About these checks
Registry, retraction, Cites and statistics results are computed, not judged, with one exception: a printed reference that no index lists is read once by a model before it counts as a citation error. Claims are extracted by a model and kept only when their quote appears verbatim in the text; each cited source is then checked, with a model’s help, for whether it says what the claim relies on. Those verdicts can be wrong — read the claim’s quote and the cited source before relying on one.
Statistics and arithmetic are recomputed, not judged.
Confidence bands are shown only for fields calibrated on our annotated test set. None is calibrated yet, so no band is shown.
What counts as a claim ›How we measure confidence ›How we check this ›
Are you an author, or do you see a problem with this page? Request a review
